Computational Discovery of Gene Modules,
Regulatory Networks and Expression Programs
by
Georg Kurt Gerber
B.A., Mathematics, UC Berkeley (1991)
M.P.H., Infectious Diseases, UC Berkeley (1994)
S.M., Electrical Engineering and Computer Science, MIT (2003)
Submitted to the Harvard-MIT Division of Health Sciences and
Technology
in partial fulfillment of the requirements for the degree of
Doctor of Philosophy in Computer Science and Medical Engineering
at the
MASSACHUSETTS INSTITUTE OF TECHNOLOGY
September 2007
@ Massachusetts Institute of Technology 2007. All rights reserved.
Author ..
Di...
...
...
Harvard-
Division offealt
eie
s and e
ology
S J ly ,2007
Certified by... ...
David K. Gifford
Professor of Electrical Engineering and Computer Science
Thesis Supervisor
Accepted by...
\.v
/
Martha L. Gray
Edward Hood Taplin Professor of 4edical and Electrical Engineering
Co-Director. Harvard-MIT Division of Health Sciences and
Technology
ARCHIVES
OCT 042007
Computational Discovery of Gene Modules, Regulatory
Networks and Expression Programs
by
Georg Kurt Gerber
Submitted to the Harvard-MIT Division of Health Sciences and Technology on July 1, 2007, in partial fulfillment of the
requirements for the degree of
Doctor of Philosophy in Computer Science and Medical Engineering
Abstract
High-throughput molecular data are revolutionizing biology by providing massive amounts of information about gene expression and regulation. Such information is applicable both to furthering our understanding of fundamental biology and to developing new diagnostic and treatment approaches for diseases. However, novel mathematical methods are needed for extracting biological knowledge from high-dimensional, complex and noisy data sources. In this thesis, I develop and apply three novel computational approaches for this task. The common theme of these approaches is that they seek to discover meaningful groups of genes, which confer ro-bustness to noise and compress complex information into interpretable models. I first present the GRAM algorithm, which fuses information from genome-wide expression and in vivo transcription factor-DNA binding data to discover regulatory networks of gene modules. I use the GRAM algorithm to discover regulatory networks in Saccha-romyces cerevisiae, including rich media, rapamycin, and cell-cycle module networks. I use functional annotation databases, independent biological experiments and DNA-motif information to validate the discovered networks, and to show that they yield new biological insights. Second, I present GeneProgram, a framework based on Hi-erarchical Dirichlet Processes, which uses large compendia of mammalian expression
data to simultaneously organize genes into overlapping programs and tissues into groups to produce maps of expression programs. I demonstrate that GeneProgram outperforms several popular analysis methods, and using mouse and human expres-sion data, show that it automatically constructs a comprehensive, body-wide map of inter-species expression programs. Finally, I present an extension of GenePro-gram that models temporal dynamics. I apply the algorithm to a compendium of short time-series gene expression experiments in which human cells were exposed to various infectious agents. I show that discovered expression programs exhibit tem-poral pattern usage differences corresponding to classes of host cells and infectious agents, and describe several programs that implicate surprising signaling pathways and receptor types in human responses to infection.
Thesis Supervisor: David K. Gifford
Biographical information
Personal
Born: December 31, 1970 in Los Angeles, CA.
Education
B.A., Mathematics, summa cum laude, UC Berkeley, 1991. M.P.H., Infectious Diseases, UC Berkeley, 1994.
S.M., Electrical Engineering and Computer Science, MIT, 2003.
Professional experience
* Graduate Research Assistant, MIT Computer Science and Artificial Intelligence Laboratory (Supervisor: Prof. David Gifford), 2000-present.
* Instructor, Northeastern University Bioinformatics Essentials Graduate Certifi-cate Program, 2002.
* Chief Technology Officer, IS?TV, Inc., 2000.
* Senior Vice President, L-Squared Entertainment, Inc., 1995-1999.
* President and Chief Executive Officer, Infinite Interactions, Inc., 1993-1995. * Graduate Research Assistant, UC Berkeley Department of Computer Science
(Supervisor: Prof. Brian Barsky), 1993-1994.
* Research Associate/Laboratory Automations Specialist, Metabolex, Inc., 1992. * Undergraduate Teaching Assistant, UC Berkeley Department of Mathematics,
1991.
* Undergraduate Research Assistant, UC Berkeley Department of Biophysics (Su-pervisor: Prof. Hans Bremermann), 1990.
* President, Speak Easy Communications System, 1984-1989.
Academic awards and honors
* National Defense Science and Engineering Graduate (NDSEG) Fellowship, 2002-2005.
* Sigma Xi honor society of science and engineering, Associate Member, elected 2003.
* National Science Foundation (NSF) Fellowship (awarded), 2002.
* University of California Regents' Graduate Fellowship, 1992-1994.
* UC Berkeley Highest Distinction in General Scholarship in Mathematics, 1991. * Phi Beta Kappa honor society, elected 1990.
* University of California Regents' Undergraduate Scholarship, 1989-1991. * UC Berkeley Dean's List, every semester attended, 1989-1991.
Acknowledgments
"It was cold consolation to think that I, who looked upon it with my eyes and fondled it with my ten flesh-and-bone fingers, was no less monstrous than the book. I felt it was a nightmare thing, an obscene thing, and that it defiled and corrupted reality. I considered fire, but I feared that the burning of an infinite book might be similarly infinite, and suffocate the planet in smoke."
-Jorge Luis Borges, The Book of Sand
IN SCIENTIFIC papers, we boil our work down into figures, tables and equations. At the end of most papers, there is a tiny section, usually one to two sentences, called "acknowledgements." It's unfortunate that section is so short, because it often contains the keys to the real story behind the science-a story about people. In the seven years I've spent at MIT and Harvard, I've come to realize that science ultimately springs from the incredibly rich and complex interactions we have with colleagues, friends, family and society at large. So, in this section I will try to reveal a little of the real story behind this thesis.
However, I must say upfront that the origins of the most mathematical portions of this work remain more mysterious to me. On those occasions, when traces of infinity shook loose from equations, I credit primarily twilight, the lizards, and the way that light in the mid-summer late in the afternoon sometimes spreads across the bare walls of old houses.
First, I must acknowledge the most direct collaborators on this work. Ziv Bar-Joseph co-developed the GRAM algorithm with me when he was a fellow graduate student at MIT. Ziv has been more than just a fantastic intellectual collaborator; he has been a true friend. Robin Dowell, a post-doc in the Gifford lab, was also a great collaborator. She worked with me on various aspects of GeneProgram, particularly the cross-species analysis. Robin is not only a talented researcher, but she's also a gifted conversationalist. Over the last two years, I don't know how many hours we've spent talking about everything from molecular evolution to car engines.
Next, I must acknowledge the members of my thesis committee, who have guided my work for almost seven years. Professor David Gifford, my thesis supervisor, intro-duced me to the field of computational functional genomics and has been instrumental in encouraging my research by providing ideas, resources, and guidance while also fos-tering the critical collaborative relationships outside of our immediate group. I think that part of the reason that Professor Gifford and I have worked well together is that we share an entrepreneurial spirit. He is always starting new projects, and in-vestigating novel technologies, research ideas and collaborations. Moreover, he's not afraid to step outside the boundaries of traditional academic disciplines, and he's been particularly encouraging of my pursuit of a medical degree simultaneously with my Ph.D.
Professor Tommi Jaakkola introduced me to many topics in machine learning and statistics, and suggested a number of the core computational ideas in my research. He's one of the smartest people I've ever encountered, and his deep knowledge of his field is truly inspirational. Also, Professor Jaakkola is one of the nicest and most encouraging faculty members I've ever met. Despite his busy schedule, he always made time to talk and always treated me as a collaborator. Even when research wasn't going well, Professor Jaakkola never failed to remind me of the true purpose of the academic enterprise-teaching, learning and developing new ideas.
Professor Richard Young has provided much inspiration for the biological parts of this thesis. His passion for biology and unlocking the secrets of genetic regulation is infectious. Professor Young has also been critical in fostering true collaborations between biologists in his lab and computer scientists in my group.
I must also acknowledge a number of graduate students and post-docs in Professor Gifford, Jaakkola, and Young's labs. John Barnett, Tim Danford, Tong Lee, Chris Reeder, Kenzie MacIsaac, Reina Riemann, Alex Rolfe, Alan Qi and Nicola Rinaldi have let me bounce ideas off them, have provided critical comments on manuscripts and presentations, and have been great all-around friends!
Finally, I must acknowledge my family. My brother Karl was my constant com-panion throughout childhood and it was with him that I set out one September, long ago, for Los Angeles Valley College, where I think the whole idea about getting a Ph.D. got started. My sister Margot supposedly first suggested the Valley College plan, so she also shares some part in the saga. Then, of course, there are my parents. My father Barry first introduced me to computers, possibly as early as 1974. Some of my first memories are of my father, brother and me playing Wumpus together on an old terminal. Undoubtedly, it was those experiences that sparked my interest in computers and programming. As far as I can tell, most of what my father knows he's taught himself, and I must credit him for passing on his drive for learning inde-pendently, which has served me well as a researcher. My other earliest memories are of my mother reading to me about dinosaurs, reptiles and pre-historic cultures. To her, it is the world of people and other living things that matters most, and I think she always knew I would end up studying biology and medicine someday. She has supported every step of my academic odyssey from the baked bungalows of Valley College, to the misty hills of Berkeley, to the Infinite Corridor of MIT, to the stone quad of Harvard Medical School.
Finally, I must acknowledge my wife, Anne-Marie. I fell in love with this smart, somewhat offbeat, pretty, brown-haired, blue-eyed girl more than a decade ago. Since then, she has shared my long, strange journey from Hollywood executive to compu-tational biology researcher and medical student. Although this path has not always been an easy one to follow, we have traveled it together, with hands joined, and only in that way has it been possible to make it out of the labyrinth.
Previously published work and collaborations
The section describing DNA microarray technologies in Chapter 1 is an updated version of material that originally appeared in my Masters' thesis [73]. Figure 1-1 is a modified version of a figure that I created for [170].
The work in Chapter 2 (the GRAM algorithm) was done in collaboration with Ziv Bar-Joseph and Tong Lee. Ziv Bar-Joseph and I developed the GRAM algorithm jointly. Tong Lee directly performed or supervised the new biological experiments described in the Chapter 2. The text and figures in Chapter 2 come from two previ-ously published papers [118, 21] and material that also appeared in Ziv Bar-Joseph's Ph.D. thesis [16].
Robin Dowell collaborated on various aspects of the GeneProgram work presented in Chapter 3. In particular, she was instrumental in creating the mouse-human gene mapping, processing the expression data, and interpreting the discovered gene programs.
A publication based on portions of the GeneProgram and GeneProgram++ work (Chapters 3 and 4) is scheduled to appear in [76].
A note on notation
An effort has been made to use consistent notation throughout this thesis. Scalars will be denoted with italic Roman or Greek lower-case letters such as x and y or
p. All vectors will be column vectors and denoted with bold italic Roman or Greek
lower-case letters such as x and y or 1L. Matrices will be denoted with bold italic Roman or Greek upper-case letters such as A and B or r. Sets will be denoted with upper-case Roman italic letters such as C and T. Random variables will be denoted by fonts without serifs such as x and y for random scalars and x and y for random vectors. Unfortunately, lower-case Greek letters are also used for random variables but the sans serif style is not available. In these cases, the intention should be clear from the context.
TO
AUTUMN AND ALL THAT NOVEMBER MAY BRING,AND TO MY WIFE, ANNE-MARIE, WHO FACES THAT WONDROUS MYSTERY WITH ME EVERY DAY.
Contents
1 Introduction 21
1.1 DNA Microarrays ... ... 23
1.1.1 A very brief overview of molecular genetics . ... 23
1.1.2 The "new era" of genomics ... 25
1.1.3 Oligonucleotide microarrays . ... 26
1.1.4 Printed cDNA microarrays . ... . 27
1.1.5 Comparison of DNA microarray technologies ... 28
1.1.6 Microarrays for measuring DNA-protein interactions .... . 28
1.1.7 Limitations of DNA microarrays . ... 29
1.2 Categorization of the work in this thesis . ... 31
1.3 Thesis roadm ap ... . . ... . . . 32
1.3.1 The GRAM algorithm ... 32
1.3.2 The GeneProgram algorithm . ... 33
1.3.3 The GeneProgram++ algorithm . ... 35
2 Genetic RegulAtory Modules (GRAM) 37 2.1 Related work .. . . . . .. . . .. . . . .. . . . .. . . ... . . 38
2.2 The GRAM algorithm ... 39
2.2.1 Formal model description . ... . . . . 40
2.2.2 Experimental determination of strict and relaxed binding thresh-olds . . . 43
2.2.3 Inference of dynamic sub-networks . ... 44
2.3 Gene modules in rich media conditions and modes of regulatory control 44 2.3.1 Discovery of biologically relevant gene modules ... 46
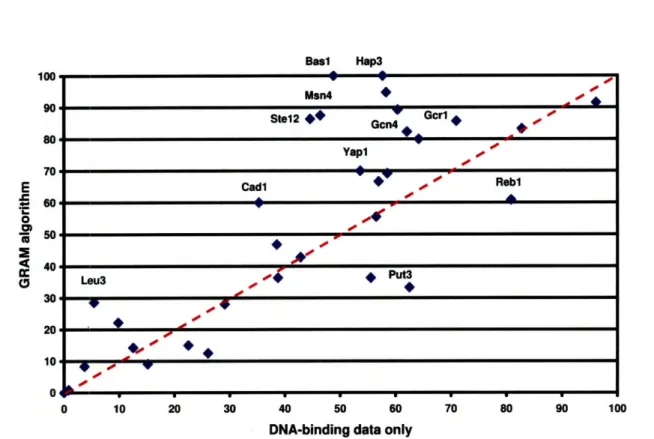
2.3.2 Integration of binding and expression data improves on either data source alone ... .. 46
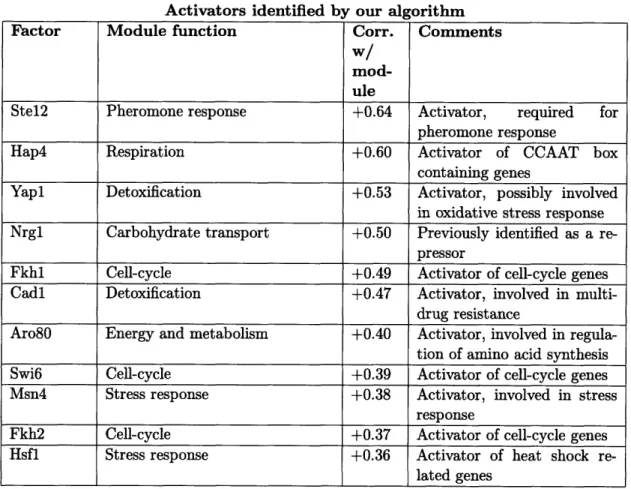
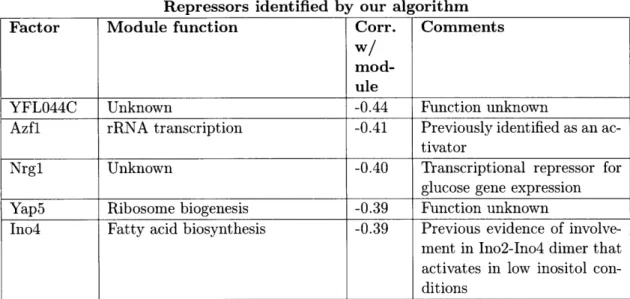
2.3.3 Identification of activators and repressors . ... 51
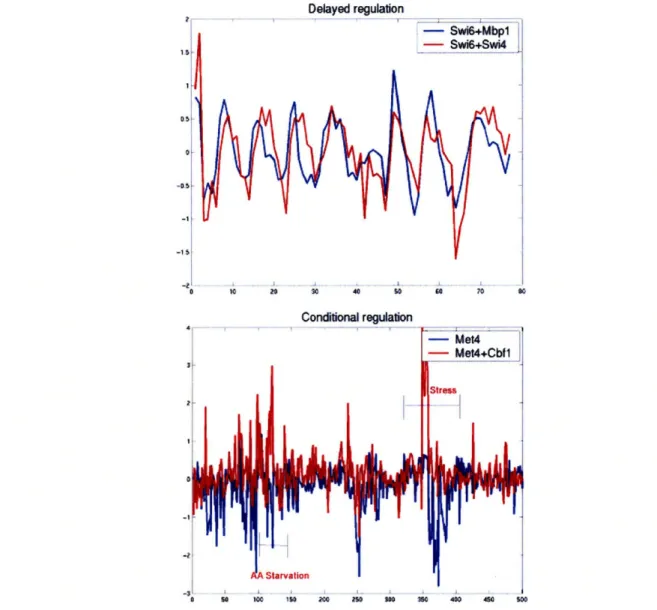
2.3.4 Discovery of modes of combinatorial regulation ... . 53
2.4.1 Selection of relevant factors ... 57
2.4.2 Genome-wide location analysis of selected factors ... . 58
2.4.3 Genome-wide rapamycin regulatory network ... . 58
2.5 The cell-cycle dynamic regulatory network ... 61
2.6 D iscussion . . . 63
2.6.1 Comparison to previous methods ... 63
2.6.2 Limitations of the GRAM algorithm ... 63
2.6.3 Conclusion . .. . . . . 66
3 GeneProgram 67 3.1 Introduction and prior work ... 68
3.2 Dirichlet Processes ... 70
3.2.1 Probability models ... ... 71
3.2.2 Markov Chain Monte Carlo approximate inference ... . 77
3.3 The GeneProgram algorithm and probability model ... . 82
3.3.1 Algorithm overview ... ... 82
3.3.2 The probability model ... ... 82
3.3.3 M odel inference ... 90
3.3.4 Summarizing the model posterior probability distribution . .. 91
3.3.5 Expression data discretization ... 93
3.4 Synthetic data experiments ... .... 94
3.4.1 Data simulation ... 94
3.4.2 GeneProgram accurately recovered coherent gene sets from the noisy synthetic data that other algorithms could not .... . 95
3.5 GeneProgram discovered biologically relevant tissue groups and expres-sion programs in a large compendium of human and mouse body-wide gene expression data ... 96
3.5.1 Data set pre-processing ... ... 98
3.5.2 GeneProgram discovered 19 consensus tissue groups and 100 recurrent expression programs ... 98
3.5.3 GeneProgram automatically assigned tissues to biologically rel-evant groups . . . . 99
3.5.4 GeneProgram outperformed biclustering algorithms in the dis-covery of biologically relevant gene sets ... 99
3.5.5 GeneProgram cross-species expression programs outperformed single-species programs in terms of biological relevance in both the gene and tissue dimensions ... 104
3.5.6 Automatic inference of tissue groups resulted in significant im-provements in model performance ... 104
3.5.7 The generality score quantified the functional specificity of ex-pression programs and organized programs into a comprehen-sive body-wide map ... 106
4 GeneProgram++
4.1 Extending GeneProgram to model patterns of expression change . . . 4.1.1 A simplified model without tissue groups . . . .
4.1.2 The full GeneProgram++ model . . . . 4.2 Additional GeneProgram++ algorithmic improvements . . . . 4.2.1 Recurrent expression programs . . . . 4.2.2 Generality score ...
4.2.3 Validation of improvements using real expression data . . . . . 4.3 Application to human infection time-series data . . . . 4.3.1 D ata sources . . . . 4.3.2 Temporal pattern and expression level discretization . . . . 4.3.3 GeneProgram++ discovered 5 consensus tissue groups and 104
expression programs in the infection time-series data . . . . . 4.3.4 Validation of the biological relevance of the discovered
expres-sion program s . . . . 4.3.5 The generality score naturally categorized programs into a
spec-trum of responses to infection . . . . 4.4 Conclusion and discussion . . . .
5 Conclusion
5.1 The GRAM algorithm ... 5.1.1 Summary of results ...
5.1.2 Specific computational and biological contributions 5.2 The GeneProgram algorithm ...
5.2.1 Summary of results ...
5.2.2 Specific computational and biological contributions 5.3 The GeneProgram++ algorithm . . . .
5.3.1 Summary of results ...
5.3.2 Specific computational and biological contributions 5.4 Directions for future work ...
5.4.1 The GRAM algorithm ...
5.4.2 GeneProgram and GeneProgram++ . . . .
137 143 147 ... 147 ... 147 . . . . . 148 . . . . . 150 . . . . . 150 . . . . . 150 . . . . . 153 ... 153 . . . . . 154 ... 157 . . . . . 157 . . . . . 159 113 116 116 120 123 123 124 125 126 126 130 131 133
List of Figures
1-1 Summary of the ChIP-chip experimental protocol. . ... . . 31
2-1 Pseudo-code for the GRAM algorithm . ... 41
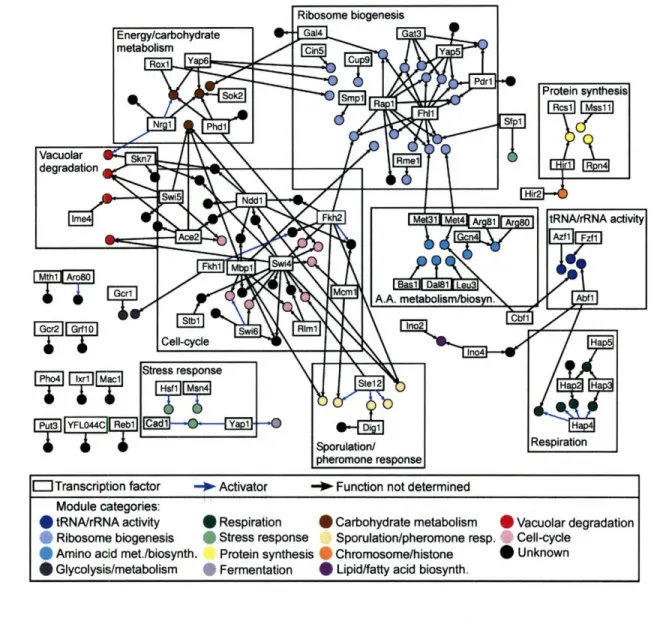
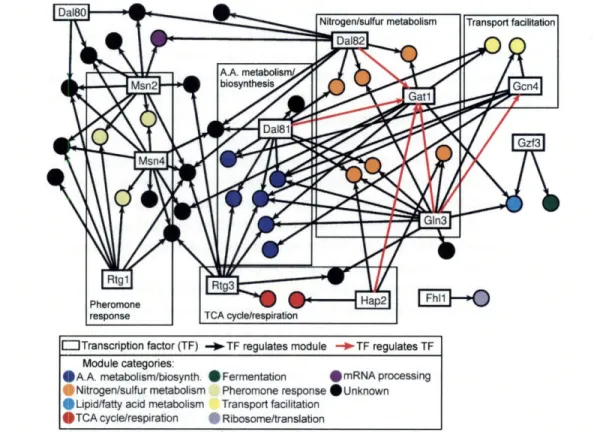
2-2 GRAM rich media gene modules network. . ... . 45
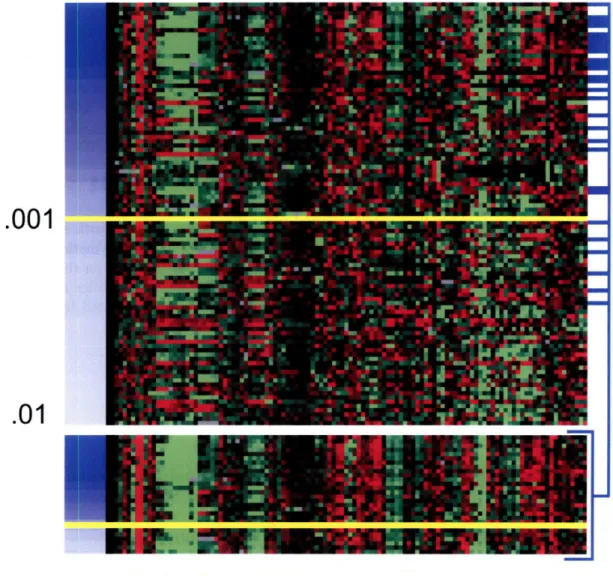
2-3 The GRAM algorithm improves the quality of DNA-binding informa-tion by using expression data. ... 49
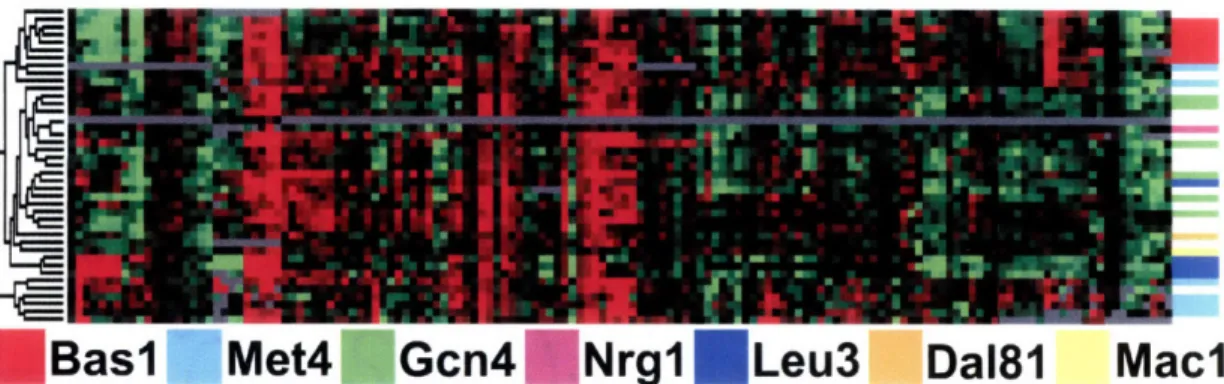
2-4 The GRAM algorithm assigns different regulators to genes with simi-lar expression patterns that cannot be distinguished using expression clustering methods alone ... 50
2-5 Motif enrichment for GRAM modules. . ... . 52
2-6 GRAM algorithm modes of combinatorial regulation. . ... 56
2-7 Rapamycin gene modules network. . ... 59
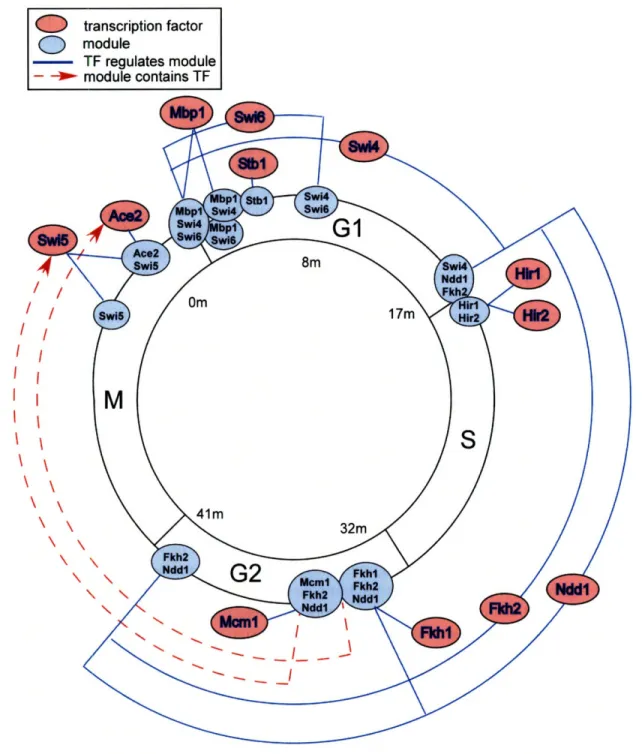
2-8 The cell-cycle dynamic regulatory network. . ... 62
2-9 Comparison of results of the GRAM algorithm to those of Ihmels et al. 64 2-10 Comparison of the results of the GRAM algorithm to those of Pilpel et al . . . . 65
3-1 Putative origin of the Dirichlet Process. . ... . . 72
3-2 Graphical model depiction of a finite mixture model. . ... 73
3-3 Graphical model depiction of the infinite mixture model. ... 75
3-4 Graphical model depiction of the Hierarchical Dirichlet Process. ... 77
3-5 The basic MCMC sampling scheme for infinite mixture models. ... 78
3-6 The basic MCMC sampling scheme for Hierarchical Dirichlet Processes. 80 3-7 GeneProgram algorithm steps overview ... 83
3-8 Conceptual overview of the data generation process for gene expression in mammalian tissues. ... 85
3-9 GeneProgram probability model overview. . ... . . 87
3-10 Graphical model depiction of the GeneProgram model. ... . 89
3-11 Synthetic data experiments using GeneProgram and several other well-known expression analysis methods. . ... 98
3-12 GeneProgram discovered 19 consensus tissue groups using gene
expres-sion data from 140 human and mouse tissue samples. . ... . 101
3-13 Correspondence plots comparing GeneProgram to biclustering
algo-rithms ... ... 103
3-14 Automatic inference of tissue groups improves cross-validation
perfor-mance of the GeneProgram model. . ... 105
3-15 The generality score organized expression programs discovered by
Gene-Program into a comprehensive body-wide map. . ... 110
4-1 GeneProgram++ probability model overview. . ... . 116
4-2 Graphical model depiction of a simplified version of GeneProgram++
without tissue groups. ... ... 117
4-3 Graphical model depiction of the full GeneProgram++ model. ... 120
4-4 Correspondence plots comparing GeneProgram++ to biclustering
al-gorithms in terms of gene set consistency. . ... 127
4-5 Schematic of six pre-defined temporal patterns used in analyzing the
infection time-series compendium. ... . 131
4-6 Examples of genes with the six temporal expression patterns used for
data analysis. ... ... ... 132
4-7 Summary of expression programs (EPs) 1-25 discovered by
GenePro-gram++ in the infection data. . ... ... 135
4-8 Summary of expression programs (EPs) 26-50 discovered by
GenePro-gram++ in the infection data. . ... ... 137
4-9 Summary of expression programs (EPs) 51-75 discovered by
GenePro-gram++ in the infection data ... 139
4-10 Summary of expression programs (EPs) 76-104 discovered by
Gene-Program++ in the infection data. ... ... . . . 141
4-11 The Wnt signaling pathway and overlapping genes in EPs 50 and 84. 143 4-12 The Toll-like receptor signaling pathway and overlapping genes in EP
List of Tables
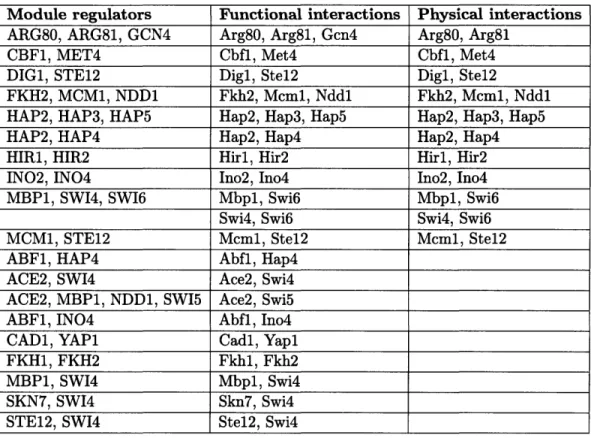
2.1 Previous evidence for regulator-regulator interactions predicted by GRAM
modules ... 47
2.2 The GRAM algorithm can improve the true-positive binding rate with-out increasing the false-positive binding rate ... 50
2.3 Activators identified by the GRAM algorithm. . ... 53
2.4 Repressors identified by the GRAM algorithm. . ... 54
3.1 Summary of random variables in the GeneProgram model. ... . 88
3.2 Tissue population means for synthetic data. . ... 95
3.3 Comparison of GeneProgram to biclustering algorithms for recovery of biologically interpretable gene sets. . ... 103
4.1 Summary of random variables used in the simplified GeneProgram++ model ... ... 118
4.2 Summary of random variables used in the full GeneProgram++ model. 121 4.3 Comparison of GeneProgram++ to biclustering algorithms for recovery of biologically interpretable gene sets. . ... 126
4.4 Summary of infection time-series data sets analyzed. . ... . 129
CHAPTER
1
Introduction
"These ambiguities, redundancies, and deficiencies recall those attributed by Dr. Franz Kuhn to a certain Chinese encyclopedia entitled Celestial Emporium of Benevolent Knowledge. On these remote pages it is written that animals are divided into (a) those that belong to the Emperor, (b) embalmed ones, (c) those that are trained, (d) suckling pigs, (e) mermaids, (f) fabulous ones, (g) stray dogs, (h) those that are included in this classification, (i) those that tremble as if they were mad, (j) innumerable ones, (k) those drawn with a very fine camel's brush, (1) others, (m) those that have just broken a flower vase, (n) those that resemble flies at a distance."
-Jorge Luis Borges, Other Inquisitions
THIS THESIS is about developing and applying new computer algorithms to dis-cover meaningful groups of genes from large collections of high-throughput biological data. The problem is challenging, because the data are complex, high-dimensional and noisy. We have developed several algorithms that address these issues and will describe them in this thesis. However, before delving into computational details, it's worth considering the more philosophical question: why try to put genes into groups in the first place?
Categorizing and grouping things-particularly living organisms and their parts-is an ancient human pursuit'. However, as illustrated by the classification of animals
1The use of computers for grouping biological entities also has a relatively long history. The first such work was published in 1957, by medical researcher and microbiologist Peter Sneath, in a paper titled "The application of computers to taxonomy" [201]. In that work, Dr. Sneath described a hierarchical clustering method and computer program, which he applied to categorizing members of the bacterial genus Chromobacterium that cause a rare tropical infection.
in the Celestial Emporium of Benevolent Knowledge, not all groupings are good ones. The Greek philosopher Aristotle (384-322 BC) developed fairly sophisticated ideas about what constitutes good categories. Chief among his contributions in this field is the notion that a collection of traits, rather than a single characteristic, should be used to differentiate members of a group. In his work, Historia Animalium, he wrote:
"The method then that we must adopt is to attempt to recognize the natu-ral groups, following the indications afforded by the instincts of mankind, which led them for instance to form the class of Birds and the class of Fishes, each of which groups combines a multitude of differentiae, and is not defined by a single one as in dichotomy [78]."
Of course, Aristotle didn't quite figure everything out, and subsequent genera-tions of philosophers and scientists have expanded on his ideas. Three important modern criteria for evaluating the inherent meaningfulness of groups are based on evolutionary, mathematical and cognitive perspectives.
From the evolutionary perspective, a system-from an individual cell to entire ecologies-can be divided into modules, which are relatively independent "building-blocks" comprised of functionally related components [37]. The inherent decompos-ability of a system into modules is best justified from the point of view of evolutionary fitness. Nobel Prize winner and complexity theorist Herbert Simon summarized the argument for modularity eloquently:
"But if the effectiveness of design of each organ depends on the design of the organs with which it interacts, then there is no guarantee that improvements of one organ will not worsen the performance of others ... Suppose, instead, that the effectiveness of each organ depends very little on the design of others, provided that the inputs each requires are supplied by the others. Then, up to a scale factor, the design of each organ can be improved independently of what is happening in the others; and it is easy to show that fitness will rise much more rapidly than when there is mutual dependence of design [37]."
From the mathematical perspective, good groupings of data provide compression of information without loss of important details. Mathematical techniques for com-pressing information enable many modern2 technologies including cell-phones and digital video [47]. The basic idea behind many compression techniques is to assign data items to groups, and then to replace individual items with statistics derived from the groups. In compression algorithms, one must generally trade-off the competing objectives of making the representation of the compressed data as small as possible with retaining as much information as possible [212]. From the practical standpoint, a compressed data set can serve as a useful summary of the original data. Further, if there is noise in data, compression can result in a smoother, more representative view of the information.
2
From the cognitive perspective, good groupings of data boost the human brain's limited ability to understand the natural world. To study the significance of mental categories, the cognitive psychologist Eleanor Rosch did field experiments with the Dugum Dani people of Papua New Guinea in the 1970's [180]. The Dani people lacked words describing color hues other than dark and light. However, when Rosch showed them colored chips of various hues, they were able to sort them into natural "perceptual categories." Rosch later expanded her experiments to study perception of other categories, such as shape and semantics, and in different populations, including American children [181, 182]. Overall, Rosch's experiments and those of others in her field suggest that the human tendency to categorize things is critical for our understanding of the world [132]. Rosch wrote that:
"Categorization occurs ... to reduce the limitless variation ... to man-ageable proportions ... categories would ... follow the lines of natural
correlations of attributes, those that maximize the correlation and thus the predictability of attributes within categories (quoted in [132])."
Later in this thesis, we will revisit the three perspectives discussed above. In par-ticular, we'll describe how the sets of genes discovered using the algorithms developed in this thesis exhibit properties of modularity, represent mathematically principled compressions of data, and help us to understand better both model organisms and human biology.
The work we will present focuses on analysis of data gathered using a major new technique in experimental biology, DNA microarrays, which allow researchers to measure thousands of functional characteristics of a biological system simultaneously. In the next section, we will provide an overview of DNA microarray technologies and discuss some of their limitations, in order to provide context for the work presented in this thesis.
1.1
DNA Microarrays
1.1.1
A very brief overview of molecular genetics
In this subsection, we will discuss the bare essentials of molecular genetics for those unfamiliar with the subject. For more information, please consult a recent text such as [130].
Essential molecules for life: DNA, RNA and proteins
Much of cellular behavior arises from the interactions between three types of molecules: DNA (deoxyribonucleic acid), RNA (ribonucleic acid), and proteins.
DNA may be thought of as the primary long-term information storage molecule in the cell. Often likened to the "blue-print" for the cell, DNA consists of a long backbone of alternating sugar and phosphate residues. Attached to each sugar residue is one of four nitrogen-containing bases: adenine (A), cytosine (C), guanine (G)
and thymine (T). It is the linear ordering or sequence of these bases in the DNA molecule that encodes information. Non-covalent bonds between hydrogen atoms in adenine/thymine and cytosine/guanine allow these bases to form stable pairs. The bases that form such pairs are said to be complementary. It is this base-pairing that allows DNA to exist as a double-stranded molecule in most normal physiological situations. The two strands encode the same information but use complementary bases.
While RNA also serves as an information carrier in the cell, these molecules act in a more transitory manner than do DNA molecules. RNA is quite similar to DNA chemically, differing only in the type of sugar used (ribose instead of deoxyribose) and the use of the base uracil (U) instead of thymine. Unlike DNA, RNA molecules primarily exist in a single-stranded form, which is less stable and subject to cellular degradation. A primary function of cellular RNA is to act as the messenger molecules that carry information copied from DNA. This process of copying DNA to RNA is called transcription, and is carried out by pieces of cellular "machinery" called RNA polymerases. The single-stranded copies are called mRNA (messenger RNA) and serve to amplify the original DNA "signal." In keeping with the "blue-print" analogy, the RNA molecules are like working prints that have been photocopied from the original DNA-based plans.
Many mRNA copies are produced from the DNA, and the information encoded in these copies is then translated into proteins by elaborate pieces of cellular "machinery" called ribosomes. If mRNA copies are not made from a gene, then no protein will be produced and the gene is said to be silent or inactive. When the gene is transcribed into RNA copies, the mRNA is said to be expressed.
Proteins are the primary "work-horses" of the cell, serving in a wide variety of roles including formation of physical structures, communication with other cells, and catalysis of metabolic reactions. In keeping with the "blue-print" analogy, proteins are the wood, walls, windows, doors, and even hammers and cranes used for constructing the building! Proteins consist of chains of amino acids, and the sequence of these amino acids and subsequent molecular modifications enable the protein to fold into a complex three-dimensional structure. While only four different nucleic acids are used to encode information at the DNA or mRNA level, proteins use twenty different amino acids. A triplet genetic code is used, in which three nucleotides, called a codon, specify a single amino acid. Because there are four types of nucleotides used in DNA, there are 43 = 64 possible codons. This allows for a degenerate genetic code, in which a single amino acid can be specified by any of several codons.
Genes and Regulation
Because proteins play such a fundamental role in the life of a cell, biologists are ex-tremely interested in identifying those regions of DNA called genes that ultimately lead to functional proteins. The genome for an organism is its complete hereditary information encoded in DNA, including both genes and regions of DNA that do not code for proteins. A variety of computational and experimental techniques have been used to identify genes [203]. Surprisingly, in more advanced organisms, much DNA
does not code for functional proteins. The explanations for this are complex and still not fully understood [176, 203]. For these and other reasons, discovering genes is by no means a straight-forward or error-free process. Further, even the definition of a gene is rather controversial and has been subject to revision in recent years [203]. Fortunately, there are organizations such as the National Center for Biotechnology Information that seek to compile databases of the latest consensus genetic data. Cur-rently, information is publicly available for many organisms, including bacteria, yeast, worms, plants, rodents, and humans [147].
Genetic regulation-the control over when and where genes are active in the cell-is critical in all organcell-isms. Because the ultimate products of genes are proteins that carry out an extremely diverse set of cellular tasks, lack of control of genetic activity can have disastrous consequences. For instance, in animals, many genes code for proteins involved in cellular growth and division. If these genes are inappropriately regulated, cellular growth may go unchecked, leading to malignant tumor formation. Because genetic regulation is so critical, its study comprises a large part of the field of molecular genetics.
The process of genetic regulation is very complex, and is not yet completely un-derstood for even simple organisms such as bacterial viruses [167, 13]. On the most basic level, genetic regulation is carried out by transcription factors (specialized pro-teins) that act either to inhibit or activate transcription of genes. Many transcription factors bind to regions of DNA near the genes they regulate. In reality, the pro-cess of regulation is much more complicated, especially in more advanced organisms such as humans. Genetic regulation is known to involve combinatorial interactions among transcriptional factors, binding of non-coding RNA molecules, alterations of the three-dimensional chromatin structure of DNA, control of the rates of transcrip-tion and translatranscrip-tion, and many other mechanisms [159, 137, 145, 65, 176, 167, 165].
1.1.2
The "new era" of genomics
Classical molecular genetics tended to focus on the understanding of individual genes, which often involved years of painstaking experimental work for each gene [187]. It has only been in the last several years, with the advent of new automated technolo-gies, that biologists have begun to take a more holistic approach. This approach is sometimes called systems biology, or more specifically genomics, when the goal is to understand organisms at the level of their genomes. This field is generally divided into two sub-disciplines: structural and functional genomics. Structural genomics is primarily concerned with elucidating the sequences of genes and regulatory elements. The definition of functional genomics is a bit less clear, but an article on the topic by Philip Hieter and Mark Boguski [88] provides a useful viewpoint:
". .. functional genomics refers to the development and application of global
(genome-wide or system-wide) experimental approaches to assess gene function by making use of the information and reagents provided by struc-tural genomics. It is characterized by high throughput or large-scale ex-perimental methodologies combined with statistical and computational
analysis of the results ... Computational biology will perform a critical and expanding role in this area: whereas structural genomics has been characterized by data management, functional genomics will be charac-terized by mining the data sets for particularly valuable information."
One of the most valuable tools in functional genomics is the DNA microarray, which allows researchers to measure the expression levels of thousands of mRNAs simultaneously. Although there are a variety of DNA microarray technologies in use, all operate on the basic principle that complementary strands of nucleic acids can "recognize" or hybridize with each other with high specificity through base-pairing.
DNA microarrays consist of a large number of different DNA molecules, called "probes," which are immobilized on a solid surface in an ordered matrix. The posi-tions of the DNA molecules on the array are predetermined, and the different arrayed pieces of DNA usually correspond to portions of genes or genic regions of inter-est. For genome-wide expression analysis, messenger RNA from a group of cells is worked up to produce a sample of nucleic acid "targets," some of which will hybridize with the DNA probes on the microarray [187]. Various methods, usually involving either fluorescence or radioactivity, can be used to detect the degree of hybridization that occurs and thus quantify the expression levels of mRNAs present. The two most popular DNA microarray technologies differ principally in the probes or arrayed ma-terial used: either short sequences of DNA (oligonucleotides) [126] or complementary DNA (cDNA) [56, 43].
1.1.3
Oligonucleotide microarrays
Oligonucleotide arrays use as probes short DNA sequences, typically of 10-60 nu-cleotides, which are synthesized directly on microarray slides. The three major technologies for production of oligonucleotide microarrays involve photolithography, miniature mirrors, or ink-jet printing.
One of the main producers of oligonucleotide arrays is the company Affymetrix, Inc., which uses a photolithographic process borrowed from semiconductor manu-facturing [3]. Affymetrix's microarray manumanu-facturing process begins with a quartz wafer that is coated with silane molecules, forming a uniform matrix. Nucleotides are then attached to this matrix via linker molecules. A photolithographic mask determines what area of the wafer will receive nucleotides. The mask has small windows, and when ultraviolet light is shined through these openings, the exposed linkers become chemically "de-protected," allowing coupling to added nucleotides. The added nucleotides also have chemical groups at a particular position that are re-moved when exposed to ultraviolet light. By using a sequence of different masks, and adding nucleotides in the appropriate order, a large number of oligonucleotides of cho-sen sequences may be synthesized directly on the quartz wafer. Current Affymetrix GeneChips@ have over 1.3 million spatially distinct "features" (oligonucleotides of different sequences) on a single array. Each oligonucleotide probe is typically 25 bases long (a 25mer). For expression analysis applications, approximately twenty probes are carefully chosen to represent a given gene transcript. Computational and
em-pirical methods are used to choose the probes, in order to maximize sensitivity and specificity. For each probe selected, a mismatch probe is constructed that differs from the probe by one nucleotide near the center of the sequence. These mismatch probes
serve as controls for non-specific hybridization.
NimbleGen Systems, Inc. employs an alternative manufacturing method also based on photochemistry, but that uses miniature mirrors instead of photolithographic masks to focus light [154]. The mirrors are computer-controlled to produce high-resolution ultraviolet light patterns on a solid substrate, creating "virtual masks." Current Nimblegen arrays contain up to 2.1 million unique probe features on a single array, with probe sizes ranging from 24-70 nucleotides.
Agilent Technologies, Inc., produces oligonucleotide microarrays using an ink-jet printing method [5]. Their manufacturing process uses standard phosphoramidite chemistry to synthesize oligonucleotides base-by-base. The four different nucleotides are sprayed onto the microarray as needed in precise, minute quantities using ink-jet nozzles. Oligonucleotides of 60 bases in length (60mers) are typically used for these arrays. Current Agilent arrays contain up to 244,000 probes on a single array.
The sample preparation, hybridization, and scanning methods for all the oligonu-cleotide microarrays described above are similar. For example, for expression analysis using Affymetrix microarrays, the sample or target is typically prepared by collecting mRNA from a population of cells and then using a viral enzyme, reverse transcrip-tase, to produce a DNA copy of the RNA. The DNA is then transcribed back into RNA in vitro using a source of ribonucleotides with attached biotin molecules. Biotin is a small molecule that binds very tightly to the protein streptavidin, which is used later in the microarray assay. The purpose of these steps is to amplify the amount of starting mRNA and to label the material. The labelled RNA is then hybridized to the microarray, and a fluorescent molecule attached to strepavadin is added. After several more staining and washing steps, the result is that areas on the chip will fluoresce proportionately to the concentration of hybridized RNA present [4]. A laser is used to excite the fluorescing molecules, and an optical scanner captures the emissions. Image processing algorithms are then used to correct for background noise and other optical effects [3]. The final output is a set of numbers that are related to the level of mRNA present for each gene.
1.1.4
Printed cDNA microarrays
In contrast to oligonucleotide arrays, cDNA arrays typically use much longer pieces of DNA (often a few hundred nucleotides in length [56, 43]). The DNA attached to these arrays is typically obtained from cDNA libraries. These libraries are usually constructed by making cDNA copies (with reverse transcriptase) of mRNA from par-ticular cell types [56] (e.g., cells from different tissue sources). Once a set of cDNA probes has been selected, the typical procedure is to amplify the cDNA using the polymerase chain reaction (PCR) and then "print" it onto a glass microscope slide. Printing is done using a variety of technologies, including a robotic arm that spots the DNA onto the slide using a pen-like apparatus [43, 187], and the Agilent ink-jet technology [5]. The cDNA array technique is very flexible, because DNA from almost
any source may be used. Specialized arrays have been constructed with cDNAs from human lymphocytes and other tissues, fruit flies, yeast, bacteria, and many other sources [7, 220, 202, 63].
As with the procedure for expression analysis using oligonucleotide arrays de-scribed above, the target material to be hybridized to a cDNA array consists of a sample of mRNA prepared from a population of cells. However, in the case of cDNA arrays, labelling is done during the reverse transcription to cDNA step. The in vitro transcription step is skipped, and the cDNA is hybridized directly to the microarray.
These is another important difference in target preparation that is done to com-pensate for the somewhat inexact printing process. Because inconsistent amounts of cDNA can be deposited at a given spot, direct comparisons across different arrays may be inaccurate. Thus, a method of competitive hybridization is used in which two sep-arate samples labelled with different fluorescent dyes are simultaneously hybridized to the array.
The remaining laser excitation and scanning processes for cDNA arrays are also similar to those used for oligonucleotide arrays. One difference is that two lasers of different wavelengths are used, so that the intensity of fluorescence of the two samples can be measured separately. A ratio is then reported, giving the fold difference in expression between the two samples. Thus, with this technique expression levels are always reported as ratios relative to one sample.
1.1.5
Comparison of DNA microarray technologies
All the microarray technologies described above have been applied to a variety of bi-ological research problems [56, 43, 3, 154, 5]. In the past, cDNA microarrays were the dominant technology. Knowledge of a gene's DNA sequence was not required, longer probes were presumed to lead to less cross-hybridization, and they were cheaper to produce. However, with the sequencing of many biologically important organisms, the development of oligonucleotide arrays using longer probes or mismatch pairs, and cost reductions in oligonucleotide array manufacture, these advantages have become less important. Thus, recent experimental studies now most commonly employ com-mercially manufactured oligonucleotide arrays.
Each microarray manufacturer claims various technological advantages. Agilent argues that their technology is accurate, very flexible for producing custom arrays, and the most cost effective. Affymetrix claims to make the best quality products, because of the superiority of their manufacturing process and more extensive expe-rience producing microarrays. NimbleGen produces the highest density microarrays, and argues that their "virtual mask" technology allows them to make very high qual-ity custom arrays more cost effectively than can Affymetrix. At this time, it is unclear which, if any, of these technologies has significant practical advantages over the others.
1.1.6
Microarrays for measuring DNA-protein interactions
Although DNA microarrays were originally used for measuring the expression levels of genes, they have been more recently applied to localizing DNA-protein interactionsgenome-wide. In this location analysis application, a chemical such as formaldehyde is first used to cross-link proteins to DNA in cells. Extracted DNA is then broken into randomly sized pieces using sonication. An antibody to a selected protein is then used to immunoprecipitate DNA fragments bound to the protein. The resulting precipitated nucleic acids are purified, PCR amplified and fluorescently labeled to provide the material for hybridization to a microarray for detection. Figure 1-1 shows a cartoon of the experimental protocol.
This method of chromatin immunoprecipitation, followed by DNA microarray hy-bridization (termed ChIP-chip), has emerged as a powerful tool for studying in vivo genome-wide protein-DNA interactions including transcription factor binding [174, 125, 103, 199, 118, 90, 217, 122, 218, 82, 40, 177, 164], DNA replication and recombi-nation [222, 77], and nucleosome occupancy and histone modification state [28, 153, 179, 144, 113, 27, 223]. Such information has been used to discover transcription factor DNA binding motifs, to predict gene expression, and to construct large-scale regulatory network models [82, 134, 121, 85, 21, 113, 27, 131].
A major difference between microarrays used for ChIP-chip experiments and those used for measuring gene expression levels is that the former typically need to array a much larger portion of the genome. The coding regions of genes comprise a relatively small part of the total DNA of eukaryotic organisms [203]. Because proteins may in-teract with DNA anywhere throughout the genome, microarrays used for ChIP-chip analysis should in principle cover the entire genome. Cost and technology limitations drove initial ChIP-chip array designs. Early studies employed printed cDNA arrays, with only a single 500-2,000 base-pair (bp) probe representing each intergenic re-gion [118, 82, 113]. Improvements in array technology and reduced costs have allowed for smaller probe lengths and more complete genome coverage. For instance, a recent
printed array design using Agilent technology covers the non-repeat portions of the yeast or human genomes with oligonucleotide probes every few hundred bases,
yield-ing approximately 42,000 array features for yeast and 5 million for humans [164, 117]. Another recent array design uses Affymetrix microarrays with probes representing every 20 to 35 base-pairs of sequence across human chromosomes 21 and 22 [40, 27].
1.1.7 Limitations of DNA microarrays
As with any technology, DNA microarrays have their limitations. The biggest issue is that microarray data is extremely noisy. Indeed, some recent studies have found
microarray data to be only moderately reproducible at best [100, 173]. Noise is
intro-duced during the many steps of array manufacture, sample preparation, hybridization, and detection [84]. For instance, pipette error, temperature fluctuations, and reagent quality can introduce variation in mRNA amplification and the efficiency of fluores-cent tagging. The variability of all these factors-from chip-to-chip, laboratory-to-laboratory, and even experimenter-to-experimenter-makes it challenging to compare results or to quantify precisely the detection limits of microarrays.
High levels of noise are especially problematic for microarrays, because they mea-sure the expression levels of thousands of genes simultaneously. Thus, it becomes extremely likely by chance alone that at least some genes will have very high or
Crosslink
IF
Fragment
Immuno-precipitate
Further sample
preparation
Hybridize
AP
B
4 F4 4 .,,ww8 iiini.*****iiwiwi@I@I1
mvicroarray
readout
1 IJ
Figure 1-1: The ChIP-chip experimental protocol is used to measure genome-wide protein-DNA binding. Formaldehyde or another chemical is used to cross-link proteins to protein-DNA in cells. Extracted DNA is then broken into randomly sized pieces, typically using sonication. An antibody to a selected protein is then used to immunoprecipitate DNA fragments bound to the selected protein. The resulting precipitated nucleic acids are purified, PCR ampli-fied and fluorescently labeled to provide the material for hybridization to a microarray for detection.
low expression values. In a recent commentary in The Lancet, Dr. John Ioannidis described several studies that suffered from this problem:
"The promise of microarrays has been of apocalyptic dimensions. As put forth by one of their inventors, 'all human illness can be studied by microarray analysis, and the ultimate goal of this work is to develop effective treatments or cures for every human disease by 2050 [184].' All diseases are to be redefined, all human suffering reduced to gene-expression
profiles ... Yet ... on close scrutiny, in five of the seven largest studies
on cancer prognosis, this technology performs no better than flipping a
coin ... Well, I think there is no free lunch in good research. Microarrays
need evidence and this cannot be obtained from a couple of small studies,
no matter how high-tech ... we should aim for many independent studies
with a total of several thousand patients, a hundred-fold more than the current standard [101]."
As suggested in the above commentary, larger sample sizes are an important com-ponent for the improvement of the quality of research studies using microarrays. A complementary approach is to develop better computational and experimental meth-ods for reducing the effective noise level of microarrays (see for example the refer-ences [97, 214, 53, 108, 54]). The work in this thesis presents several computational methods that achieve this objective, by exploiting the idea that more statistical power can be derived from groups than from single genes.
1.2
Categorization of the work in this thesis
The work described in this thesis is cross-disciplinary, involving development of new computer algorithms and their application to biological data. Multi-disciplinary work is inherently difficult to categorize.
From the computational perspective, the author developed new algorithms, ex-tended existing ones, and wrote computer programs to implement them. That work drew on techniques from the computer science and mathematical subdisciplines of software engineering, machine learning, computational geometry, statistics, functional analysis and numerical analysis.
From the biological perspective, the author analyzed and interpreted experimental data using knowledge from the biological subdisciplines of molecular genetics,
func-tional genomics, cell biology, anatomy, physiology, immunology and microbiology. However, this work was clearly not experimental biology, because the author did not perform experiments in a biological laboratory.
Computational biology perhaps provides the most succinct categorization of the cross-disciplinary work described in this thesis. The National Institutes of Health Biomedical Information Science and Technology Initiative Consortium's working def-inition of computational biology is:
"The development and application of data-analytical and theoretical meth-ods, mathematical modeling and computational simulation techniques to the study of biological, behavioral, and social systems [148]."
1.3
Thesis roadmap
In this thesis, we describe three novel computational approaches-the GRAM (Chap-ter 2), GeneProgram (Chap(Chap-ter 3) and GeneProgram+++ (Chap(Chap-ter 4) algorithms-and show that each method finds biologically meaningful sets of genes in large com-pendia of DNA microarray data. In this section, for each of the three approaches, we provide a brief overview of the problems addressed by the method and then outline the organization of each chapter, describing the method and its applications to bio-logical data. Chapter 5 provides a summary of the contributions made in this thesis, and discusses directions for future work.
1.3.1
The GRAM algorithm
Problem overview
Understanding of regulatory interactions and molecular mechanisms governing genetic networks is of fundamental importance to basic biology, and is also relevant to im-proved diagnosis and treatment of human diseases. A variety of new high-throughput data sources have recently become available, and these hold the promise of revolution-izing molecular biology by providing a large-scale view of the regulation of genes in the cell. Fundamental goals at this scale involve discovering patterns of combinatorial regulation and how the activity of genes involved in related biological processes is co-ordinated and interconnected. However, each high-throughput data source measures only a particular aspect of cellular activity and suffers from limitations in accuracy. Thus, an important goal is to integrate information from multiple data sources, so that each type of data can compensate for the limitations of the others. A further goal is to develop automated methods that can aid in deducing abstractions that can con-ceptually reduce genetic network complexity without significant loss of explanatory power.
Initial work on constructing genome-wide regulatory networks relied exclusively on expression data (see Section 2.1 for details). However, these approaches assume that expression levels of regulated genes depend on expression levels of regulators. This assumption is often not biologically realistic, because the expression levels of
many regulators do not reflect their physiologic activity due to factors such as post-translational modifications, protein degradation mechanisms, and cellular sequestra-tion of regulators [143].
Large scale, genome-wide location analysis for DNA-binding regulators offers a second means for identifying regulatory relationships [118]. Location analysis iden-tifies physical interactions between regulators and DNA regions, providing strong direct evidence for genetic regulation. Although useful, binding information is also limited, as the presence of the regulator at a promoter region indicates binding but not function; the regulator may act positively, negatively or not at all. In addition, as with all microarray based data sources, location analysis data contains substantial experimental noise. Because expression and location analysis data provide comple-mentary information, our goal was to develop an efficient computational method for integrating these data sources. We expected that such an algorithm could provide assignments of groups of genes to regulators that would be both more accurate and more biologically relevant than assignment based solely on either data source alone.
Chapter 2 organization overview
In Chapter 2, we present a novel algorithm, GRAM (Genetic RegulAtory Modules), which fuses information from genome-wide expression and in vivo transcription factor-DNA binding data sets to discover regulatory networks of gene modules. A gene module is defined as a set of genes that are both co-expressed and bound by the same set of transcription factors. After some brief introductory material, we discuss prior work on gene module discovery in Section 2.1. Next, we present the algorithm in detail in Section 2.2. In Section 2.3, we use the GRAM algorithm to discover a genome-wide regulatory network using binding information for 106 transcription factors in Saccharomyces cerevisiae in rich media conditions and over 500 expression experiments. We also validate the quality of these results by performing analyses using four independent data sources, and use the discovered modules to label transcription factors as activators or repressors and identify patterns of combinatorial regulation. In Section 2.4, we analyze a new genome-wide location analysis data set for regulators in yeast cells treated with rapamycin, and use the GRAM algorithm to provide biological insights into this regulatory network. In Section 2.5, we present a method for using modules to build automatically genetic regulatory sub-networks for specific biological processes, and use this technique to reconstruct accurately key elements of the cell-cycle in yeast. Finally, Section 2.6 concludes the chapter with a discussion of the advantages and limitations of the GRAM algorithm.
1.3.2
The GeneProgram algorithm
Problem overview
The great anatomic and physiologic complexity of the mammalian body arises from the coordinated expression of genes. A fundamental challenge in computational bi-ology is the identification of sets of co-activated genes in a given biological context
and the characterization of the functional breadth of such sets. Understanding of the functional generality of gene sets has both practical and theoretical utility. Sets of genes that are very specific to a particular cell type or organ may be useful as diagnostic markers or drug targets. In contrast, sets of genes that are active across diverse cell types can give us insight into unexpected developmental and functional similarities among tissues. While there has been considerable effort in systems bi-ology to understand the structure and organization of co-expressed sets of genes in isolated tissues in the context of pathological processes, such as cancer and infec-tion [107, 128, 189, 215], relatively little atteninfec-tion has been given to this task in the context of normal physiology throughout the entire body [198, 205]. By analyzing gene expression in this latter context, we can gain an understanding of baseline gene expression programs and characterize the specificity of such programs in reference to organism-wide physiological processes.
Analysis of large genome-wide mammalian expression data compendia present several new challenges that do not arise when analyzing data from simpler organisms. First, tissue samples usually represent collections of diverse cell-types mixed together in different proportions. Even if a sample consists of a relatively homogenous cell population, the cells can still behave asynchronously, due to factors such as microen-vironments within the tissue that receive different degrees of perfusion. Second, each tissue sample is often from a different individual, so that the compendium represents a patchwork of samples from different genetic and environmental backgrounds. Fi-nally, the number of expression programs and distinct cell populations present in a compendium is effectively unknown a priori.
Chapter 3 organization overview
In Chapter 3, we present GeneProgram, a novel unsupervised computational frame-work that uses expression data to simultaneously organize genes into overlapping programs and tissues into groups to produce maps of inter-species expression pro-grams, which are sorted by generality scores that exploit the automatically learned groupings. Our method addresses each of the above challenges relating to the use of large mammalian expression data compendia by using a probabilistic model that: 1) allocates mRNA to different expression programs that may be shared across tissues, 2) is hierarchical, treating each tissue as a sample from a population of related tissues, and 3) uses Dirichlet Processes, a non-parametric Bayesian method that provides prior distributions over numbers of sets while penalizing model complexity.
We begin in Section 3.1 by providing some introductory material and discussion of prior work relating to discovery of gene sets from expression data compendia. In Section 3.2, we present background material on ordinary and Hierarchical Dirichlet Process mixture models, which are a core component of the GeneProgram probability model. In Section 3.3, we provide a detailed description of the GeneProgram algo-rithm and probability model. In Section 3.4, we perform synthetic data experiments to explore the kinds of structures GeneProgram and several other well-known unsu-pervised learning algorithms can recover from noisy data. In Section 3.5, we apply GeneProgram to the Novartis Gene Atlas v2 [205], consisting of expression data for