A Comparison of Propofol- and
Dexmedetomidine-induced Electroencephalogram Dynamics
Using Spectral and Coherence Analysis
The MIT Faculty has made this article openly available.
Please share
how this access benefits you. Your story matters.
Citation
Akeju, Oluwaseun, Kara J. Pavone, M. Brandon Westover, Rafael
Vazquez, Michael J. Prerau, Priscilla G. Harrell, Katharine E.
Hartnack, et al. “A Comparison of Propofol- and
Dexmedetomidine-Induced Electroencephalogram Dynamics Using Spectral and
Coherence Analysis.” Anesthesiology 121, no. 5 (November 2014):
978–989.
As Published
http://dx.doi.org/10.1097/aln.0000000000000419
Publisher
Ovid Technologies (Wolters Kluwer) - Lippincott Williams & Wilkins
Version
Author's final manuscript
Citable link
http://hdl.handle.net/1721.1/102342
Terms of Use
Creative Commons Attribution-Noncommercial-Share Alike
A Comparison of Propofol- and Dexmedetomidine-induced
Electroencephalogram Dynamics Using Spectral and Coherence
Analysis
Oluwaseun Akeju, M.D., M.M.Sc.1,4, Kara J. Pavone, B.S.1, M. Brandon Westover, M.D.,
Ph.D.2,4, Rafael Vazquez, M.D.1,4, Michael J. Prerau, Ph.D.1,4, Priscilla G. Harrell, M.D., M.P.H.1,4, Katharine E. Hartnack, B.S.1, James Rhee, M.D., Ph.D.1,4, Aaron L. Sampson,
B.S.1, Kathleen Habeeb, M.S.N.3, Gao Lei, M.D.1,4, Eric T. Pierce, M.D., Ph.D.1,4, John L.
Walsh, M.D.1,4, Emery N. Brown, M.D., Ph.D.1,4,5,6,7, and Patrick L. Purdon, Ph.D.1,4,5
1Department of Anesthesia, Critical Care and Pain Medicine, Massachusetts General Hospital,
Boston, MA
2Department of Neurology, Massachusetts General Hospital, Boston, MA 3Clinical Research Center, Massachusetts General Hospital, Boston, MA 4Harvard Medical School, Boston, MA
5Department of Brain and Cognitive Science, Massachusetts Institute of Technology, Cambridge,
MA
6Harvard-Massachusetts Institute of Technology Division of Health Sciences and Technology,
Massachusetts Institute of Technology, Cambridge, MA
7Institute for Medical Engineering and Sciences, Massachusetts Institute of Technology,
Cambridge, MA
Abstract
Background—Electroencephalogram patterns observed during sedation with dexmedetomidine appear similar to those observed during general anesthesia with propofol. This is evident with the occurrence of slow (0.1–1 Hz), delta (1–4 Hz), propofol-induced alpha (8–12 Hz), and
dexmedetomidine-induced spindle (12–16 Hz) oscillations. However, these drugs have different molecular mechanisms and behavioral properties, and are likely accompanied by distinguishing neural circuit dynamics.
Methods—We measured 64-channel electroencephalogram under dexmedetomidine (n = 9) and propofol (n = 8) in healthy volunteers, 18–36 years of age. We administered dexmedetomidine with a 1mcg/kg loading bolus over 10 minutes, followed by a 0.7mcg/kg/hr infusion. For propofol, we used a computer controlled infusion to target the effect-site concentration gradually from and 0 µg/mL to 5 µg/mL. Volunteers listened to auditory stimuli and responded by button-press to
Corresponding Author: Patrick L. Purdon, 149 13th Street, Rm 4005, Charlestown, MA 02129, Phone: 617-724-1060, Fax:
NIH Public Access
Author Manuscript
Anesthesiology. Author manuscript; available in PMC 2015 November 01.
Published in final edited form as:
Anesthesiology. 2014 November ; 121(5): 978–989. doi:10.1097/ALN.0000000000000419.
NIH-PA Author Manuscript
NIH-PA Author Manuscript
determine unconsciousness. We analyzed the electroencephalogram using multitaper spectral and coherence analysis.
Results—Dexmedetomidine was characterized by spindles with maximum power and coherence at ~13 Hz, (mean±std; power, −10.8dB±3.6; coherence, 0.8±0.08), while propofol was
characterized with frontal alpha oscillations with peak frequency at ~11 Hz (power, 1.1dB±4.5; coherence, 0.9±0.05). Notably, slow oscillation power during a general anesthetic state under propofol (power, 13.2dB±2.4) was much larger than during sedative states under both propofol (power, −2.5dB±3.5) and dexmedetomidine (power, −0.4dB±3.1).
Conclusion—Our results indicate that dexmedetomidine and propofol place patients into different brain states, and suggests that propofol enables a deeper state of unconsciousness by inducing large amplitude slow oscillations that produce prolonged states of neuronal silence.
Introduction
General anesthetic and sedative agents induce stereotypical changes in the
electroencephalogram that were first observed in the 1930’s, giving rise to the idea that the electroencephalogram could be used to monitor depth of anesthesia.1–3 Given our growing knowledge of anesthetic molecular pharmacology, neural mechanisms, and clinical behavior, it is reasonable to conclude that anesthetic agents can be distinguished and monitored by their unique electroencephalogram signatures. However, the most widespread approach for using the electroencephalogram to monitor anesthesia-induced altered arousal is based on empirically-derived indices that reduce the electroencephalogram to a single number between 0 an 100.4 In general, these indices are derived using regression methods that link electroencephalogram features to clinical ratings of sedation and consciousness. Sedative-hypnotic drugs induce large-amplitude oscillations (10’s to 100’s of microvolts) that become slower with increasing doses of drug.1,5 Most indices reflect this general tendency: if the electroencephalogram is slow, index values will be low, whereas if the electroencephalogram is fast, index values will be high. Despite the appealing simplicity of this construct, and early successes in reducing the amount of anesthetic agents
administered,6 problems with electroencephalogram -based indices have become evident, as clinical experience with these monitors has grown. In practice, these indices can vary substantially from clinical assessments of consciousness,7 and show limited efficacy in reducing awareness compared to end-tidal anesthetic gas concentrations.8
Relatively similar electroencephalogram patterns can arise under the γ-Aminobutyric acid receptor-specific agonist propofol and the α2-adrenoceptor agonist dexmedetomidine. Propofol is associated with highly coordinated frontal thalamocortical alpha oscillations,9–15 and asynchronous slow oscillations (0.1–1 Hz).16 Similarly, dexmedetomidine gives rise to slow oscillations and spindle-like activity, which we refer to as “dex-spindles,” with a similar frequency range and spatial distribution as propofol-induced frontal alpha.17–19 Although their electroencephalogram patterns may sometimes appear similar, the behavioral or clinical properties of these drugs are very different.20,21 Propofol can produce sedation at low doses, and unconsciousness at higher doses.9 Dexmedetomidine, at the clinically recommended dose, induces a state similar to non-rapid eye movement (NREM) sleep,21 in which patients can be aroused easily with verbal or tactile stimuli.22 These differences
NIH-PA Author Manuscript
NIH-PA Author Manuscript
motivate the questions: 1) Are there specific brain dynamics induced by these drugs that can explain the observed differences in clinical response and behavior, and 2) Can these brain dynamics be detected in the electroencephalogram?
We therefore hypothesized that propofol-induced slow oscillations would have lower coherence, and larger power/amplitude than dexmedetomidine-induced slow oscillations. Similarly, spindles observed during sleep and dexmedetomidine-induced unconsciousness has a morphology that is intermittent in nature. In contrast, propofol-induced frontal alpha oscillations have a morphology that is continuous in nature. These alpha oscillations are very coherent. We therefore also hypothesized that alpha oscillations induced during general anesthesia with propofol are different and significantly more coherent than the dex-spindles induced during sedation with dexmedetomidine.
To explore these hypotheses, we measured and compared the electroencephalogram under dexmedetomidine (n = 9) and propofol (n = 8) in healthy volunteers, 18–36 years of age. The propofol dataset is from a normal healthy volunteer study previously reported.9,10
Materials and Methods
Patient Selection and Data Collection
We measured 64-channel electroencephalogram under dexmedetomidine (n = 9) and propofol (n = 8) in healthy volunteers, 18–36 years of age. These studies were approved by the Human Research Committee at the Massachusetts General Hospital. All subjects provided informed consent and were American Society of Anesthesiology Physical Status I with Mallampati Class I airway anatomy. In addition to standard pre-anesthesia assessments, a urine toxicology screen was performed to ensure that subjects had not taken drugs that might confound the electroencephalogram or behavioral results. We administered a urine pregnancy test for each female subject to confirm that they were not pregnant. Before the start of the study, we required subjects to take nothing by mouth for at least 8 hours. For dexmedetomidine-induced unconsciousness, a 1mcg/kg loading bolus over 10 minutes, followed by a 0.7mcg/kg/hr infusion (x 50 minutes) was administered. For propofol-induced unconsciousness, we used a computer-controlled infusion to achieve propofol target effect-site concentrations of 0, 1, 2, 3, 4, and 5 µg/mL. We maintained each target effect-effect-site concentration level for 14 min. During the study, subjects breathed 21% oxygen by volume (dexmedetomidine), and 30% oxygen by volume (propofol). When a subject became apneic, an anesthesiologist assisted breathing with bag/mask ventilation (propofol). We monitored each subject’s heart rate with an electrocardiogram, oxygen saturation through pulse oximetry, respiration and expired carbon dioxide with capnography, and blood pressure cuff (dexmedetomidine) or arterial line (propofol). During induction and emergence from dexmedetomidine- and propofol-induced unconsciousness, we recorded
electroencephalogram s using a 64-channel BrainVision Magnetic Resonance Imaging Plus system (Brain Products, Munich, Germany) with a sampling rate of 1,000 Hz
(dexmedetomidine) and 5000 Hz (propofol), resolution 0.5 µV least significant bit, bandwidth 0.016–1000 Hz. Volunteers were instructed to close their eyes throughout the study to avoid eye-blink artifacts in the electroencephalogram. Volunteers were presented with auditory stimuli during the study and asked to respond by button presses to assess the
NIH-PA Author Manuscript
NIH-PA Author Manuscript
level of conscious behavior. For dexmedetomidine, the stimuli consisted of the volunteer’s name presented every two minutes. For propofol, the stimuli consisted of either a verbal stimulus or an auditory click, which were presented every 4 s in a repeating sequence of click-click-verbal-click-click, with a total of 210 stimuli per target effect-site concentration level. Verbal stimuli consisted either of the subject’s name or a word randomized with an equal number of name or word stimuli at each level. The click train was delivered
binaurally, with 40-Hz clicks in the left ear and 84-Hz clicks in the right ear. Subjects were instructed to press one button if they heard their name and to press the other button if they heard any other stimulus. Stimuli were recorded at a sampling rate of 44.1 kHz and were presented using Presentation software (Neurobehavioral Systems, Inc., Berkeley, California) with ear-insert headphones (ER2; Etymotic Research, Elk Grove Village, Illinois) at ~81 decibels peak sound pressure level. Button-press stimuli were recorded using a custom-built computer mouse with straps fitted to hold the first and second fingers in place over the mouse buttons. The mouse was also lightly strapped to the subject’s hand using tape and an arterial line board to ensure that responses could be recorded accurately. Details for study procedures, and data collection for the propofol data have been previously reported.9,10
Behavioral Analysis
We estimated the probability of response to the verbal stimuli under propofol by using Bayesian Monte Carlo methods to fit a state-space model to this data.9,23,24
Electroencephalogram Preprocessing and Epoch Selection
We applied an anti-aliasing filter and down-sampled the electroencephalogram data to 250 Hz before analysis. Electroencephalogram signals were re-montaged to a nearest-neighbor Laplacian reference, using distances along the scalp surface to weigh neighboring electrode contributions.9
First, 2-minute electroencephalogram segments were selected from all subjects during the awake, eyes closed baseline. Eye closure facilitates distinguishing between normal awake, eyes-closed occipital alpha oscillations and the frontal alpha oscillations associated with anesthesia induced altered arousal.
Electroencephalogram data segments were selected based on the behavioral response. For dexmedetomidine, the onset of unconsciousness was defined as the first failed behavioral response that was followed by a series of at least five successive failures (10-minutes). To characterize the electroencephalogram signature of dexmedetomidine-induced
unconsciousness, we used the first 2-minute electroencephalogram epoch obtained for each volunteer 8-minutes after the onset unconsciousness.
For propofol, we identified data segments using a combination of behavioral and
neurophysiological endpoints. We identified two states, one where subjects had a non-zero probability of response to auditory stimuli, and another where subjects were unconscious with a zero probability of response, propofol-induced unconsciousness trough-max (TM) and propofol-induced unconsciousness peak-max (PM) respectively.9 Eight volunteers exhibited the propofol-induced unconsciousness (TM) and propofol-induced
unconsciousness (PM) electroencephalogram states. In the trough-max pattern,
propofol-NIH-PA Author Manuscript
NIH-PA Author Manuscript
induced alpha waves are strongest at the troughs of the slow oscillation. This pattern begins ~20 min before loss of consciousness and extends ~10 min after loss of consciousness (the troughs are Laplacian surface-negative deflections).9 This pattern arises during the transitions to and from unconsciousness, and bisects unconsciousness defined by loss of response to auditory stimuli.9 As such, the TM pattern marks the earliest part of propofol-induced alterations in consciousness that we neurophysiologically identified to border the states of consciousness and unconsciousness. For each volunteer subject, we chose TM electroencephalogram epochs that occurred within the first 2-minutes of the onset of this pattern. In the PM pattern, propofol-induced alpha waves are strongest at the peaks of the slow oscillation. That is, the phase–amplitude modulation shifted by 180°, such that the alpha amplitudes were largest at the peaks of low-frequency oscillations (the peaks are Laplacian surface-positive deflections).9 PM coupling is a propofol-induced signature of unconsciousness in the cortex that precedes the onset of burst suppression. Importantly, this pattern arises after loss of consciousness, when the probability of response to auditory stimuli is zero.9 Clinically, this neurophysiological pattern can be related to a general anesthetic state.9,16 For each volunteer subject, we chose PM electroencephalogram epochs that occurred within the first 2-minutes of the onset of this pattern. These neurophysiological signatures are stably maintained over changing propofol effect site concentrations; ~1–2 µg/mL for trough max and ~3–5 µg/mL for PM.9 For the remainder of this paper, we refer to the selected TM electroencephalogram epoch as “propofol-induced unconsciousness (TM),” and the selected PM electroencephalogram epoch as “propofol-induced unconsciousness (PM).” Table 1 provides a clinical context to the behavioral states from which these electroencephalogram epochs were obtained.
Spectral Analysis
The power spectral density, also referred to as the power spectrum or spectrum, quantifies the frequency distribution of energy or power within a signal. The spectrogram is a time-varying version of the spectrum. For example, figure 1 shows the behavioral response and representative frontal and occipital volunteer electroencephalogram spectrograms under dexmedetomidine. Also, supplemental digital content 1A–C shows representative frontal spectrograms of dexmedetomidine-induced unconsciousness, propofol- induced
unconsciousness (TM) and propofol-induced unconsciousness (PM). In these spectrograms, frequencies are arranged along the y-axis, and time along the x-axis, and power is indicated by color on a decibel (dB) scale. Supplemental digital content 1D–F shows representative raw electroencephalogram signals in the time domain. Supplemental digital content 1G–L shows 8–16 Hz and 0.1–1 Hz bandpass filtered electroencephalogram signals in the time domain. We computed spectra and spectrograms using the multitaper method, implemented in the Chronux toolbox.25 We computed group-level spectrograms by taking the median across volunteers. We also calculated the spectrum for the selected electroencephalogram epochs. The resulting spectra were then averaged for all epochs, and 95% confidence intervals were computed via taper-based jackknife techniques.25 The spectral analysis parameters were: window length T = 4s with 0s overlap, time-bandwidth product TW = 3, number of tapers K = 5, and spectral resolution 2W of 1.5 Hz. We estimated the peak power, and its frequency, for the dex-spindle (12–16 Hz), and frontal alpha (8–12 Hz) oscillation
NIH-PA Author Manuscript
NIH-PA Author Manuscript
for each individual subject. We then averaged across subjects to obtain the group-level peak power and frequency for these oscillations.
Coherence Analysis
The coherence quantifies the degree of correlation between two signals at a given frequency. It is equivalent to a correlation coefficient indexed by frequency: a coherence of 1 indicates that two signals are perfectly correlated at that frequency, while a coherence of 0 indicates that the two signals are uncorrelated at that frequency. The coherence Cxy(f) function
between two signals x and y is defined as:
where Sxy(f) is the cross-spectrum between the signals x(t) and y(t), Sxx(f) is the power
spectrum of the signal x(t) and Syy(f) is the power spectrum of the signal y(t). Similar to the
spectrum and spectrogram, the coherence can be estimated as a time-varying quantity called the coherogram. We computed coherograms between two frontal electroencephalogram electrodes F7 and F8 using the multitaper method, implemented in the Chronux toolbox.25 We computed group-level coherograms by taking the median across volunteers. We also calculated coherence for the selected electroencephalogram epochs. The resulting coherence estimates were then averaged for all epochs, and 95% confidence intervals were computed via taper-based jackknife techniques.25 The coherence analysis parameters were: window length T = 4s with 0s overlap, time-bandwidth product TW = 3, number of tapers K = 5, and spectral resolution 2W of 1.5 Hz. We estimated the peak coherence, and its frequency, for the dex-spindle, travelling peak, and frontal alpha oscillation for each individual subject. We then averaged across subjects to obtain the group-level peak coherence and frequency for these oscillations.
Statistical Analysis
To compare spectral and coherence estimates between groups, we used jackknife-based methods, namely the two-group test for spectra (TGTS), and the two-group test for
coherence (TGTC), as implemented by the Chronux toolbox.26,27 This method accounts for the underlying spectral resolution of the spectral and coherence estimates, and considers differences to be significant if they are present for contiguous frequencies over a range greater than the spectral resolution 2W. Specifically, for frequencies f > 2W, the null hypothesis was rejected only if the test statistic exceeded the significance threshold over a contiguous frequency range ≥ 2W. For frequencies 0 ≤ f ≤ 2W, to account for the properties of multitaper spectral estimates at frequencies close to zero, the null hypothesis was rejected only if the test statistic exceeded the significance threshold over a contiguous frequency range from 0 to max(f,W) ≤ 2W. We selected a significance threshold of P < 0.001 for all comparisons, applying a Bonferonni correction for multiple comparisons where appropriate.
NIH-PA Author Manuscript
NIH-PA Author Manuscript
Results
Spectral Analysis
Dexmedetomidine vs. Baseline Power Spectra—We observed differences in the spectrogram that were induced by dexmedetomidine. Compared to baseline, the spectrogram during dexmedetomidine-induced unconsciousness exhibited increased power across a frequency range of 2–15Hz (Fig. 2A, 2B). We next compared the electroencephalogram spectrum during dexmedetomidine-induced unconsciousness to baseline, and found significant differences in power across most frequencies between 0 and 40 Hz. electroencephalogram power exhibited a dex-spindle oscillation peak (mean±std; peak frequency, 12.9Hz±0.7; peak power, −10.8dB±.3.6), and was larger during
dexmedetomidine-induced unconsciousness across a range of frequencies less than 16.6 Hz (Fig. 2C; 0.1–7.8Hz, 11.5–16.6 Hz; P < 0.001, TGTS). electroencephalogram power was lower during dexmedetomidine-induced unconsciousness in beta/gamma frequency ranges (Fig. 2C; 21.2–40 Hz; P < 0.001, TGTS). Our results show that, compared to the awake-state, slow/delta and spindle oscillations (dex-spindles) are exhibited during
dexmedetomidine-induced unconsciousness.
Propofol vs. Baseline Power Spectra—We observed differences in the spectrogram that were induced by propofol. Propofol-induced unconsciousness (TM) was characterized by broad-band (~1–25Hz) increased power whereas during propofol-induced
unconsciousness (PM), the increased power appeared confined to slow, delta and alpha frequency bands (Fig. 3A, 3B, 3C). We next compared the electroencephalogram spectrum during propofol-induced unconsciousness (TM) and propofol-induced unconsciousness (PM) to the baseline electroencephalogram and to each other. During propofol-induced unconsciousness (TM), electroencephalogram power was significantly larger than baseline across a broad frequency range spanning alpha, beta and gamma frequencies (Fig. 3D; 10.5 Hz-50 Hz; P < 0.0003, TGTS).
During propofol-induced unconsciousness (PM), electroencephalogram power exhibited an alpha oscillation peak (peak frequency,10.8Hz±0.7; peak power, 1.1dB±4.5) and was significantly larger than baseline across all frequencies studied (Fig. 3E; 0.1–40Hz; P < 0.0003, TGTS).
When we compared the power between the TM and PM propofol electroencephalogram epochs, we found that oscillations during propofol-induced unconsciousness (PM) were significantly larger across slow, delta, theta and alpha frequencies (Fig. 3F; 0.1–13.4 Hz; P < 0.0003, TGTS). Slow oscillation power during propofol-induced unconsciousness (PM) (power, 13.2dB±2.4) was larger than during propofol-induced unconsciousness (TM) (power, −2.5dB±3.1). This means that the amplitude of slow-oscillations during induced unconsciousness (PM) was approximately 6-fold larger than during propofol-induced unconsciousness (TM), and the baseline state.
Qualitatively, during propofol-induced unconsciousness (PM), the electroencephalogram spectrogram exhibited a visibly narrower 8–12 Hz oscillation bandwidth compared to propofol-induced unconsciousness (TM) (Figs. 3B, 3C). Our results are consistent with
NIH-PA Author Manuscript
NIH-PA Author Manuscript
reports that frontal alpha oscillations are exhibited during propofol-induced unconsciousness (PM), and that higher-frequency beta-gamma oscillations are observed during propofol-induced unconsciousness (TM).9–15
Dexmedetomidine vs. Propofol Power Spectra—Next we compared the spectra during dexmedetomidine-induced unconsciousness to propofol-induced unconsciousness (TM), and propofol-induced unconsciousness (PM). We found that electroencephalogram power was larger during dexmedetomidine-induced unconsciousness compared to propofol-induced unconsciousness (TM) unconsciousness in a frequency range spanning slow, delta, theta and alpha frequencies (Fig. 4A; 0.7–10Hz; P < .0005, TGTS). We also found that propofol-induced unconsciousness (TM) electroencephalogram power was larger in a frequency range spanning beta, and gamma frequencies (Fig. 4A; 14.9–40Hz; P < .0005, TGTS). Qualitatively, the spectrum during dexmedetomidine-induced unconsciousness showed a clear dex-spindle peak at ~13 Hz, while propofol-induced unconsciousness (TM) did not exhibit a clearly distinguishable peak. During propofol-induced unconsciousness (PM), electroencephalogram power was significantly larger than dexmedetomidine-induced unconsciousness across all frequencies between 0.1 and 40 Hz (Fig. 4B; 0.1–40Hz; P < . 0005, TGTS). Slow oscillation power during propofol-induced unconsciousness (PM) (power, 13.2dB±2.4) was larger than during dexmedetomidine-induced unconsciousness (power, −0.4dB±3.1). This means that the amplitude of slow oscillations during propofol-induced unconsciousness (PM) was approximately 4.8-fold larger than dexmedetomidine-induced unconsciousness slow oscillations. Similarly, during propofol-dexmedetomidine-induced
unconsciousness (PM), the electroencephalogram exhibited frontal alpha oscillations (power, 1.1dB±4.5), which were also larger than the dex-spindles (power, −10.8dB±3.6). This means that the amplitude of alpha oscillations during propofol-induced
unconsciousness (PM) was approximately 3.9-fold larger than dexmedetomidine-induced unconsciousness spindle oscillations. Our results show that the spindle-like
electroencephalogram pattern induced by dexmedetomidine is distinct from the propofol-induced frontal alpha oscillations. Also, amplitude wise, propofol-propofol-induced unconsciousness (PM) slow oscillations were much larger than dexmedetomidine-induced unconsciousness slow oscillations.
Coherence Analysis
Dexmedetomidine vs. Baseline Coherence—We observed differences in the coherogram that were induced by dexmedetomidine. Dexmedetomidine-induced
unconsciousness was characterized by an increase in coherence across a frequency range of 1–15Hz (Fig. 5A and 5B) and a decrease in 0.1–1Hz coherence (solid arrow, Fig. 5B). We next compared the electroencephalogram coherence during dexmedetomidine-induced unconsciousness to baseline, and found significant differences in coherence across
frequencies between 2.4 and 18.8 Hz, with a coherence peak (peak frequency, 13.4Hz±0.8; peak coherence, 0.78±0.08) consistent with the dex-spindle (Fig. 5C; 2.4–18.8Hz; P < 0.001, TGTC). Our results show that compared to the awake-state, dexmedetomidine-induced unconsciousness was characterized by dex-spindles that were significantly more coherent and a non-significant decrease in slow oscillation coherence.
NIH-PA Author Manuscript
NIH-PA Author Manuscript
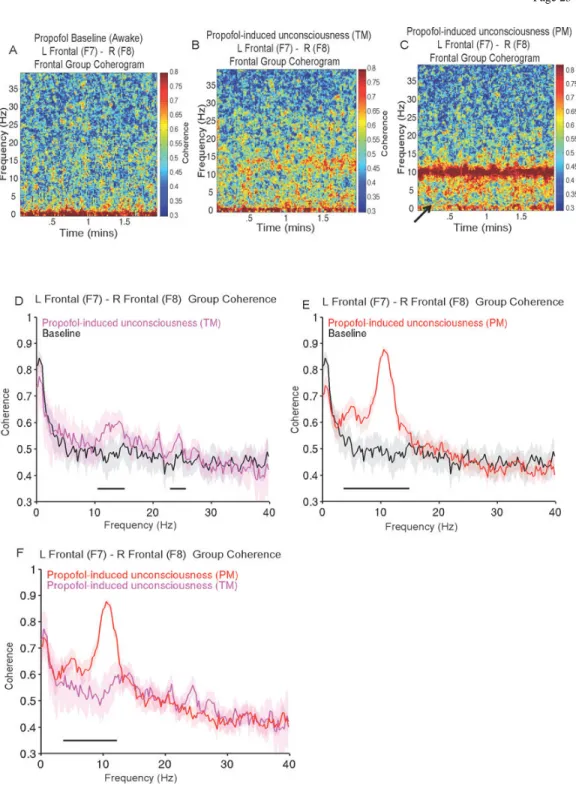
Propofol vs. Baseline Coherence—Compared to baseline, we also observed
differences in the coherogram during induced unconsciousness (TM) and propofol-induced unconsciousness (PM). Propofol propofol-induced unconsciousness (TM) was characterized by a broad (~1–25Hz) increase in coherence on the coherogram. Propofol-induced
unconsciousness (PM) was characterized by a narrow band of alpha oscillation coherence centered at ~10Hz (Fig. 6A, 6B, 6C) and a decrease in 0.1–1Hz coherence (solid arrow, Fig. 6B). We next compared the coherence during propofol-induced unconsciousness (TM) and propofol-induced unconsciousness (PM) to the baseline and to each other. We found that the oscillations induced during propofol-induced unconsciousness (TM) were coherent in beta and gamma frequency ranges (Fig. 6D; 10.7–15.4 Hz, 17.3–25.9 Hz; P < 0.0003, TGTC). Notably, during propofol-induced unconsciousness (PM), there was a distinct alpha oscillation coherence peak (peak frequency, 10.8Hz±0.9; peak coherence, 0.89±0.05) and significant increase in coherence within theta and alpha frequencies (Fig. 6E; 3.9–15.1 Hz; P < 0.0003, TGTC). Also, propofol-induced unconsciousness (PM) was characterized by a non-significant decrease slow oscillation coherence.
When we compared the propofol electroencephalogram epochs, we found that propofol-induced unconsciousness (PM) oscillations were coherent in theta and alpha frequency ranges (Fig. 6F; 3.9 Hz-12.5 Hz; P < 0.0003, TGTS). Our results are consistent with previous reports that coherent frontal beta/gamma oscillations and alpha oscillations are exhibited during propofol-induced unconsciousness (TM) and propofol-induced unconsciousness (PM), respectively.9–13
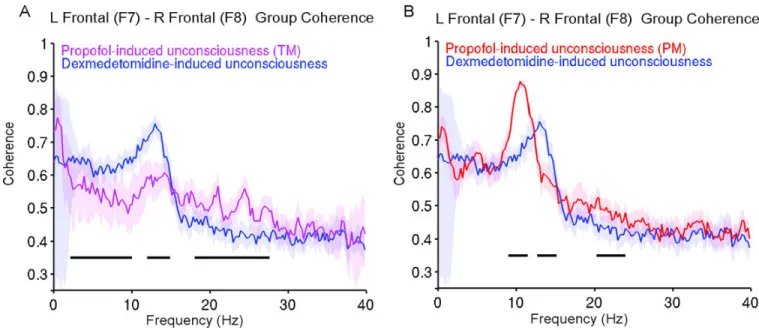
Dexmedetomidine vs. Propofol Coherence—We next compared coherence patterns during dexmedetomidine-induced unconsciousness to both propofol-induced
unconsciousness electroencephalogram epochs. Compared to propofol-induced
unconsciousness (TM), during dexmedetomidine-induced unconsciousness, coherence was larger in the delta, theta, spindle frequency bands with a coherent dex-spindle peak (Fig. 7A; 2.4–10.3 Hz, 12.2–15.3Hz; P < 0.0005, TGTC). Coherence was larger during propofol-induced unconsciousness (TM) compared to dexmedetomidine-propofol-induced unconsciousness within beta/gamma frequency bands (Fig. 7A; 17.3–25.9 Hz, P < 0.0005, TGTC). Next, we compared the coherence patterns during dexmedetomidine-induced unconsciousness to propofol-induced unconsciousness (PM). We found that dex-spindles and propofol-induced frontal alpha oscillations were distinct in terms of peak coherence and frequency (Fig. 7B). Coherence during propofol-induced unconsciousness (PM) was significantly larger at frequencies surrounding the alpha oscillation peak and at a narrow gamma band (Fig. 7B; 9.3–11.7 Hz, 19.5–26.9 Hz; P < .0005, TGTC). Coherence during dexmedetomidine-induced unconsciousness was significantly larger at frequencies surrounding the dex-spindle peak (Fig. 7B; 12.9–15.4 Hz; P < .0005, TGTC). Our results using coherence analysis show again that the spindle-like electroencephalogram pattern induced by dexmedetomidine is distinct from the propofol-induced frontal alpha oscillations.
Discussion
Although propofol- and dexmedetomidine-induced electroencephalogram signatures may appear grossly similar, our analysis identifies differences in the power spectrum and
NIH-PA Author Manuscript
NIH-PA Author Manuscript
coherence that likely relate to the specific underlying mechanisms and clinical properties of these drugs. We briefly summarize our findings as follows:
i. Similar to sleep spindles, dexmedetomidine-induced unconsciousness is
characterized by spindles whose maximum power and coherence occur at ~13 Hz. These dex-spindles were different in both the power spectrum and coherence from induced alpha and beta oscillations. Alpha oscillations during propofol-induced unconsciousness (PM) were more coherent, and were approximately 3.9-fold larger in amplitude than dexmedetomidine-induced unconsciousness spindle oscillations.
ii. Both dexmedetomidine-induced unconsciousness and propofol-induced unconsciousness are associated with slow/delta oscillations. However, the amplitude of slow oscillations during propofol-induced unconsciousness (PM), which is synonymous with general anesthesia, was much larger than those observed during both dexmedetomidine-induced unconsciousness and propofol-induced unconsciousness (TM).
Slow oscillations have been proposed as a shared mechanism for unconsciousness during sleep and anesthesia.9,16,20,28 Since dexmedetomidine acts through neural circuits involved in the generation of NREM sleep,21,29 dexmedetomidine-induced slow waves are likely similar in nature to sleep slow waves. At the neuronal level, slow oscillations are associated with an alternation between ON states where neurons are able to fire, and OFF states where neurons are silent.16,30,31 In sleep31 and under the α2-adrenoceptor agonist xylazine,32 these OFF periods appear to be relatively brief, occupying a fraction of the slow oscillation period. In contrast, under propofol, these OFF periods are prolonged, occupying the majority of the slow oscillation period.16 This prolonged state of neuronal silence along with other potential effects on arousal mechanisms could explain why general anesthesia with propofol produces a deeper state of unconsciousness from which patients cannot be aroused,
compared to sleep or dexmedetomidine-induced unconsciousness, where patients can be aroused to consciousness. In this paper, we observed that propofol-induced unconsciousness (PM) slow oscillation power/amplitude was much larger than those during propofol-induced unconsciousness (TM) dexmedetomidine-induced unconsciousness. This much larger slow oscillation power/amplitude may explain why propofol OFF states appear prolonged compared to sleep or xylazine anesthesia. We speculate that the size of the propofol-induced slow oscillation, and the duration of the associated OFF states, could come from propofol’s actions at interneurons, which could help support larger slow waves and deeper levels of hyperpolarization required to sustain OFF states.16 Our results suggest that the power or amplitude of slow oscillations could be used to distinguish between propofol-induced unconsciousness (PM), sedative states, and sleep or sleep-like states such as
dexmedetomidine-induced unconsciousness. For both dexmedetomidine and propofol, we observed decreases in slow oscillation coherence in the unconscious state that were not statistically significant compared to baseline. We hypothesize that this could be a
consequence of analyzing only one pair of electrodes, since in previous work these changes in coherence or synchrony were evident across multiple channels sampling wide areas of the cortex.16 In future works, we will apply multivariate coherence methods such as global coherence10 to improve quantification of this phenomenon.
NIH-PA Author Manuscript
NIH-PA Author Manuscript
The dex-spindle pattern has a frequency range and transient time-domain morphology that appears similar to sleep spindles. This likely suggests that the same thalamocortical circuit underlying sleep spindles33,34 generates dex-spindles.35 Biophysical models suggest a thalamocortical basis for propofol-induced frontal alpha oscillations.13 This frontal alpha electroencephalogram activity is thought to contribute to alterations in consciousness by restricting communication within frontal thalamocortical circuits from a wide to a narrow frequency band.12,13 They may also signify a change in anterior-posterior cortical
coupling.36 Our results show that propofol-induced frontal alpha waves are larger in power/ amplitude and more coherent than dex-spindles. This may further explain why propofol is able to induce deeper levels of unconsciousness than dexmedetomidine. Our analysis suggests that these drugs are acting differently within the same underlying thalamocortical system. These differences may relate to the drugs underlying molecular and neuronal mechanisms. In particular, propofol’s beta oscillations, as well as its highly coherent frontal ~10 Hz alpha oscillation, appear to be generated by enhanced γ-Aminobutyric acid
inhibition at cortical and thalamic interneurons.13,37 Meanwhile, dexmedetomidine appears to act through endogenous NREM sleep circuits,17–19 which may explain why dex-spindles appear similar in morphology to sleep spindles. Since we analyzed Laplacian-referenced electroencephalogram, which favors local signals over global ones, it is unlikely that the observed alpha- and spindle-band coherences are due broad common-mode signal. In this paper, we have demonstrated differences in the properties of slow oscillations and thalamocortical oscillations induced by dexmedetomidine and propofol. Given our knowledge of the molecular pharmacology, neural circuits,21 and clinical properties associated with these drugs, it is not surprising that these drugs have distinct
electroencephalogram signatures. Moreover, based on our analysis and discussion, it is likely that these differences in electroencephalogram dynamics are directly related to underling differences in molecular and neural circuit mechanisms. The
electroencephalogram signatures we describe can be computed and displayed in real-time, suggesting that it is possible to display these dynamics in a straightforward way as we do with other physiological signals. Furthermore, our results suggest that the
electroencephalogram could be monitored and interpreted by anesthesiologists, like other clinical physiological signals. Future studies investigating the relationship(s) between electroencephalogram signatures of other commonly used general anesthetic agents with careful assessments of level of sedation, and consciousness are warranted.
Supplementary Material
Refer to Web version on PubMed Central for supplementary material.
Acknowledgments
Funding: DP2-OD006454 (to PLP), DP1-OD003646 and TR01-GM104948 (to ENB), and T32GM007592 (to OA
and JR) from the National Institutes of Health, Bethesda, Maryland; Foundation of Anesthesia Education and Research, Rochester, Minnesota (to OA); Massachusetts General Hospital Faculty Development Award, Boston, MA (to OA); Funds from the Department of Anesthesia, Critical Care and Pain Medicine, Massachusetts General Hospital, Boston, Massachusetts.
NIH-PA Author Manuscript
NIH-PA Author Manuscript
The authors Patrick L. Purdon, Oluwaseun Akeju, Michael J. Prerau, and Emery N. Brown have submitted a provisional patent application describing the use of the electroencephalogram measures described in this manuscript for monitoring sedation and general anesthesia.
References
1. Gibbs FA, Gibbs EL, Lennox WG. Effect on the electroencephalogram of certain drugs which influence nervous activity. Arch Intern Med. 1937; 60:154–169.
2. Kiersey DK, Bickford RG, Faulconer A Jr. Electro-encephalographic patterns produced by thiopental sodium during surgical operations; description and classification. BJA. 1951; 23:141– 152. [PubMed: 14848401]
3. Faulconer A. Correlation of concentrations of ether in arterial blood with electroencephalographic patterns occurring during ether-oxygen and during nitrous oxide, oxygen and ether anesthesia of human surgical patients. Anesthesiology. 1952; 13:361–369. [PubMed: 14943989]
4. Palanca BJ, Mashour GA, Avidan MS. Processed electroencephalogram in depth of anesthesia monitoring. Curr Opin Anaesthesiol. 2009; 22:553–559. [PubMed: 19652597]
5. Rampil IJ. A primer for EEG signal processing in anesthesia. Anesthesiology. 1998; 89:980–1002. [PubMed: 9778016]
6. Gan TJ, Glass PS, Windsor A, Payne F, Rosow C, Sebel P, Manberg P. Bispectral index monitoring allows faster emergence and improved recovery from propofol, alfentanil, and nitrous oxide anesthesia. BIS Utility Study Group. Anesthesiology. 1997; 87:808–815. [PubMed: 9357882] 7. Kaskinoro K, Maksimow A, Langsjo J, Aantaa R, Jaaskelainen S, Kaisti K, Sarkela M, Scheinin H.
Wide inter-individual variability of bispectral index and spectral entropy at loss of consciousness during increasing concentrations of dexmedetomidine, propofol, and sevoflurane. BJA. 2011; 107:573–580. [PubMed: 21733891]
8. Avidan MS, Jacobsohn E, Glick D, Burnside BA, Zhang L, Villafranca A, Karl L, Kamal S, Torres B, O’Connor M, Evers AS, Gradwohl S, Lin N, Palanca BJ, Mashour GA. Prevention of
intraoperative awareness in a high-risk surgical population. N Engl J Med. 2011; 365:591–600. [PubMed: 21848460]
9. Purdon PL, Pierce ET, Mukamel EA, Prerau MJ, Walsh JL, Wong KF, Salazar-Gomez AF, Harrell PG, Sampson AL, Cimenser A, Ching S, Kopell NJ, Tavares-Stoeckel C, Habeeb K, Merhar R, Brown EN. Electroencephalogram signatures of loss and recovery of consciousness from propofol. Proc Natl Acad Sci U S A. 2013; 110:E1142–E1151. [PubMed: 23487781]
10. Cimenser A, Purdon PL, Pierce ET, Walsh JL, Salazar-Gomez AF, Harrell PG, Tavares-Stoeckel C, Habeeb K, Brown EN. Tracking brain states under general anesthesia by using global coherence analysis. Proc Natl Acad Sci U S A. 2011; 108:8832–8837. [PubMed: 21555565] 11. Murphy M, Bruno MA, Riedner BA, Boveroux P, Noirhomme Q, Landsness EC, Brichant JF,
Phillips C, Massimini M, Laureys S, Tononi G, Boly M. Propofol anesthesia and sleep: A high-density EEG study. Sleep. 2011; 34 283-91A.
12. Supp GG, Siegel M, Hipp JF, Engel AK. Cortical Hypersynchrony Predicts Breakdown of Sensory Processing during Loss of Consciousness. Curr Biol. 2011; 21:1988–1993. [PubMed: 22100063] 13. Ching S, Cimenser A, Purdon PL, Brown EN, Kopell NJ. Thalamocortical model for a
propofol-induced alpha-rhythm associated with loss of consciousness. Proc Natl Acad Sci U S A. 2010; 107:22665–70. [PubMed: 21149695]
14. Veselis RA, Reinsel RA, Feshchenko VA, Johnson R Jr. Information loss over time defines the memory defect of propofol: A comparative response with thiopental and dexmedetomidine. Anesthesiology. 2004; 101:831–841. [PubMed: 15448514]
15. Gugino LD, Chabot RJ, Prichep LS, John ER, Formanek V, Aglio LS. Quantitative EEG changes associated with loss and return of consciousness in healthy adult volunteers anaesthetized with propofol or sevoflurane. BJA. 2001; 87:421–428. [PubMed: 11517126]
16. Lewis LD, Weiner VS, Mukamel EA, Donoghue JA, Eskandar EN, Madsen JR, Anderson WS, Hochberg LR, Cash SS, Brown EN, Purdon PL. Rapid fragmentation of neuronal networks at the onset of propofol-induced unconsciousness. Proc Natl Acad Sci U S A. 2012; 109:3377–3386. [PubMed: 22331909]
NIH-PA Author Manuscript
NIH-PA Author Manuscript
17. Huupponen E, Maksimow A, Lapinlampi P, Sarkela M, Saastamoinen A, Snapir A, Scheinin H, Scheinin M, Merilainen P, Himanen SL, Jaaskelainen S. Electroencephalogram spindle activity during dexmedetomidine sedation and physiological sleep. Acta Anaesthesiol Scand. 2008; 52:289–294. [PubMed: 18005372]
18. Aksu R, Kumandas S, Akin A, Bicer C, Gumus H, Guler G, Per H, Bayram A, Boyaci A. The comparison of the effects of dexmedetomidine and midazolam sedation on electroencephalography in pediatric patients with febrile convulsion. Paediatr Anaesth. 2011; 21:373–378. [PubMed: 21371166]
19. Mason KP, O’Mahony E, Zurakowski D, Libenson MH. Effects of dexmedetomidine sedation on the EEG in children. Paediatr Anaesth. 2009; 19:1175–1183. [PubMed: 20017865]
20. Brown EN, Lydic R, Schiff ND. General anesthesia, sleep, and coma. N Engl J Med. 2010; 363:2638–2650. [PubMed: 21190458]
21. Brown EN, Purdon PL, Van Dort CJ. General anesthesia and altered states of arousal: A systems neuroscience analysis. Annu Rev Neurosci. 2011; 34:601–628. [PubMed: 21513454]
22. Langsjo JW, Alkire MT, Kaskinoro K, Hayama H, Maksimow A, Kaisti KK, Aalto S, Aantaa R, Jaaskelainen SK, Revonsuo A, Scheinin H. Returning from oblivion: imaging the neural core of consciousness. J Neurosci. 2012; 32:4935–4943. [PubMed: 22492049]
23. Wong KF, Smith AC, Pierce ET, Harrell PG, Walsh JL, Salazar AF, Tavares CL, Cimenser A, Prerau MJ, Mukamel EA, Sampson A, Purdon PL, Brown EN. Bayesian analysis of trinomial data in behavioral experiments and its application to human studies of general anesthesia. Conf Proc IEEE Eng Med Biol Soc. 2011; 2011:4705–4708. [PubMed: 22255388]
24. Smith AC, Frank LM, Wirth S, Yanike M, Hu D, Kubota Y, Graybiel AM, Suzuki WA, Brown EN. Dynamic analysis of learning in behavioral experiments. J Neurosci. 2004; 24:447–461. [PubMed: 14724243]
25. Percival, DB.; Walden, AT. Spectral analysis for physical applications: Multitaper and conventional univariate techniques. Cambridge; New York, NY, USA: Cambridge University Press; 1993.
26. Bokil H, Purpura K, Schoffelen JM, Thomson D, Mitra P. Comparing spectra and coherences for groups of unequal size. J Neurosci Methods. 2007; 159:337–345. [PubMed: 16945422]
27. Goldfine AM, Victor JD, Conte MM, Bardin JC, Schiff ND. Determination of awareness in patients with severe brain injury using EEG power spectral analysis. Clin Neurophysiol. 2011; 122:2157–2168. [PubMed: 21514214]
28. Franks NP. General anaesthesia: From molecular targets to neuronal pathways of sleep and arousal. Nat Rev Neurosci. 2008; 9:370–386. [PubMed: 18425091]
29. Nelson LE, Lu J, Guo T, Saper CB, Franks NP, Maze M. The alpha2-adrenoceptor agonist dexmedetomidine converges on an endogenous sleep-promoting pathway to exert its sedative effects. Anesthesiology. 2003; 98:428–436. [PubMed: 12552203]
30. Steriade M, Nunez A, Amzica F. A novel slow (< 1 Hz) oscillation of neocortical neurons in vivo: depolarizing and hyperpolarizing components. J Neurosci. 1993; 13:3252–3265. [PubMed: 8340806]
31. Nir Y, Staba RJ, Andrillon T, Vyazovskiy VV, Cirelli C, Fried I, Tononi G. Regional slow waves and spindles in human sleep. Neuron. 2011; 70:153–169. [PubMed: 21482364]
32. Chauvette S, Crochet S, Volgushev M, Timofeev I. Properties of slow oscillation during slow-wave sleep and anesthesia in cats. J Neurosci. 2011; 31:14998–5008. [PubMed: 22016533] 33. Contreras D, Destexhe A, Sejnowski TJ, Steriade M. Spatiotemporal patterns of spindle
oscillations in cortex and thalamus. J Neurosci. 1997; 17:1179–1196. [PubMed: 8994070] 34. Destexhe A, Contreras D, Sejnowski TJ, Steriade M. A model of spindle rhythmicity in the
isolated thalamic reticular nucleus. J Neurophysiol. 1994; 72:803–818. [PubMed: 7527077] 35. McCormick DA, Bal T. Sleep and arousal: Thalamocortical mechanisms. Annu Rev Neurosci.
1997; 20:185–215. [PubMed: 9056712]
36. Ku SW, Lee U, Noh GJ, Jun IG, Mashour GA. Preferential inhibition of frontal-to-parietal feedback connectivity is a neurophysiologic correlate of general anesthesia in surgical patients. PloS one. 2011; 6:e25155. [PubMed: 21998638]
NIH-PA Author Manuscript
NIH-PA Author Manuscript
37. Vijayan S, Ching S, Purdon PL, Brown EN, Kopell NJ. Thalamocortical Mechanisms for the Anteriorization of Alpha Rhythms during Propofol-Induced Unconsciousness. J Neurosci. 2013; 33:11070–11075. [PubMed: 23825412]
NIH-PA Author Manuscript
NIH-PA Author Manuscript
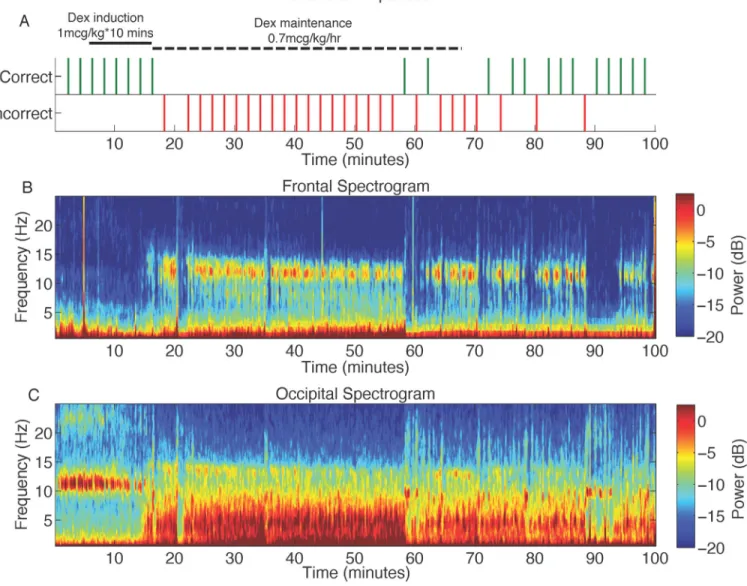
Figure 1. Representative behavioral response, along with frontal and occipital spectrograms during the dexmedetomidine study
A. The volunteer was presented with an auditory stimulus at 2-min intervals during the study and asked to respond by button presses to assess the level of conscious behavior. Missing behavioral responses are indicated by an absence of tick marks.
B. Frontal spectrogram of the volunteer in panel A above. The spectrogram displays the frequency content of signals as they change over time. Frequency is plotted on the y-axis, time is plotted on the x-axis, and the amount of energy or power in the signal is indicated in color. The onset of incorrect responses to the auditory stimuli parallels increased spindle power at ~13 Hz.
C. Occipital spectrogram of the volunteer in panel A above. The onset of incorrect responses to the auditory stimuli parallels the loss of the awake-eyes closed alpha, and increased power in slow (0.1–1Hz), delta (1–4Hz), and theta (4–8Hz) frequency bands.
db: decibel
Dex: dexmedetomine Hz: hertz
NIH-PA Author Manuscript
NIH-PA Author Manuscript
Figure 2. Group level spectrograms, and spectral analysis comparing dexmedetomidine baseline to dexmedetomidine-induced unconsciousness
A. Group level spectrogram of dexmedetomidine baseline showing absence of power in the spindle frequency band.
B. Group level spectrogram of dexmedetomidine-induced unconsciousness, showing increased power in the delta (1–4 Hz), theta (4–8 Hz) and alpha/spindle frequency bands (8– 16 Hz).
C. Power spectra of dexmedetomidine baseline vs. dexmedetomidine-induced
unconsciousness. Electroencephalogram power was larger during dexmedetomidine-induced unconsciousness at 0–7.8Hz, and 11.5–16.6 Hz (P < 0.001, TGTS). Electroencephalogram power was lower during dexmedetomidine-induced unconsciousness at 21.2–40 Hz (P < 0.05, TGTS).
NIH-PA Author Manuscript
NIH-PA Author Manuscript
Median spectra presented with 95% jackknife confidence intervals. Horizontal solid black line(s) represent frequency ranges at which significant difference existed.
dB: decibel Hz: hertz
TGTS: two group test spectrum
NIH-PA Author Manuscript
NIH-PA Author Manuscript
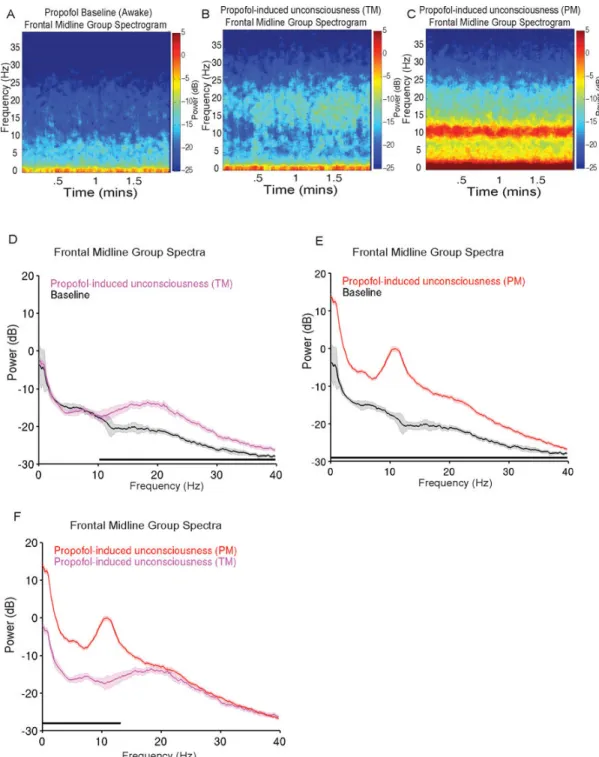
Figure 3. Group level spectrograms, and spectral analyses comparing propofol baseline, propofol-induced unconsciousness (TM), and propofol-induced unconsciousness (PM) A. Group level spectrogram of propofol baseline showing absence of power in the alpha frequency band.
B. Group level spectrogram of propofol-induced unconsciousness (TM), showing increased power in alpha-beta frequency bands.
C. Group level spectrogram of propofol-induced unconsciousness (PM), showing increased power in slow (0.1–1Hz), delta (1–4 Hz) and alpha (8–13 Hz) frequency bands.
NIH-PA Author Manuscript
NIH-PA Author Manuscript
D. Power spectra of propofol baseline vs. propofol-induced unconsciousness (TM).
Electroencephalogram power was significantly larger than baseline across a broad frequency range at 10.5–40 Hz (P < 0.0003, TGTS).
E. Power spectra of propofol baseline vs. propofol-induced unconsciousness (PM). Electroencephalogram power was significantly larger than baseline at 0.1–40 Hz (P < 0.0003, TGTS).
F. Power spectra of propofol-induced unconsciousness (TM) vs. propofol-induced unconsciousness (PM). Electroencephalogram power was significantly larger during propofol-induced unconsciousness (PM) at 0.1–13.4 Hz (P < 0.0003, TGTS).
Median spectra presented with 95% jackknife confidence intervals. Horizontal solid black line(s) represent frequency ranges at which significant difference existed.
dB: decibel Hz: hertz PM: peak max
TGTS: two group test spectrum TM: trough max
NIH-PA Author Manuscript
NIH-PA Author Manuscript
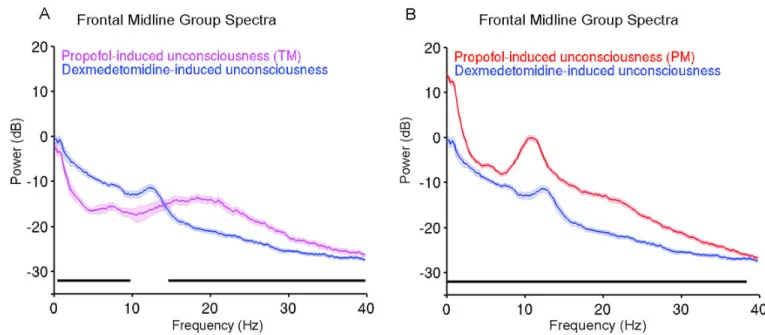
Figure 4. Group level spectral analyses comparing dexmedetomidine-induced unconsciousness to propofol-induced unconsciousness (TM) and propofol-induced unconsciousness (PM)
A. Power spectra of dexmedetomidine-induced unconsciousness vs. propofol-induced unconsciousness (TM). Electroencephalogram power was larger during propofol-induced unconsciousness (TM) compared to dexmedetomidine-induced unconsciousness at 14.9– 40Hz (P < .0005, TGTS). Electroencephalogram power was larger during dexmedetomidine-induced unconsciousness at 0.7–10 Hz (P < .0005, TGTS).
B. Power spectra of dexmedetomidine-induced unconsciousness vs. propofol-induced unconsciousness (PM). Electroencephalogram power was significantly larger than dexmedetomidine-induced unconsciousness at 0.1–40Hz (P < 0.0005, TGTS).
Median spectra presented with 95% jackknife confidence intervals. Horizontal solid black line(s) represent frequency ranges at which significant difference existed.
dB: decibel Hz: hertz PM: peak max
TGTS: two group test spectrum TM: trough max
NIH-PA Author Manuscript
NIH-PA Author Manuscript
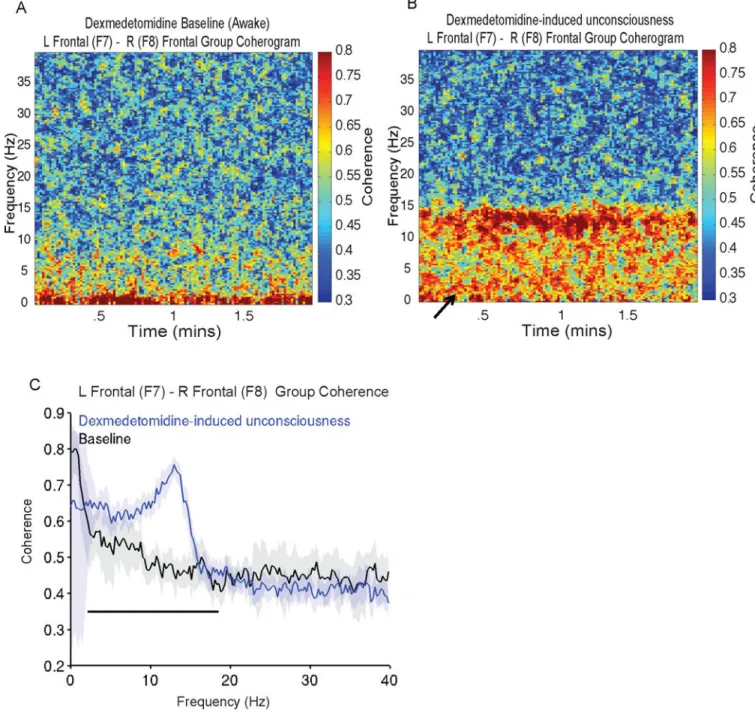
Figure 5. Group level coherograms, and coherence analysis comparing dexmedetomidine baseline to dexmedetomidine-induced unconsciousness
A. Group level coherogram of dexmedetomidine baseline showing relative absence of coherence in the spindle frequency band.
B. Group level coherogram of dexmedetomidine-induced unconsciousness, showing increased coherence in the delta, theta and alpha frequency bands and decreased coherence in the slow wave frequency band (solid arrow).
C. Coherence of dexmedetomidine baseline vs. dexmedetomidine-induced unconsciousness. Coherence was larger during dexmedetomidine-induced unconsciousness at 2.4–18.8 Hz (P < 0.001, TGTC).
NIH-PA Author Manuscript
NIH-PA Author Manuscript
Median coherence presented with 95% jackknife confidence intervals. Horizontal solid black line(s) represent frequency ranges at which significant difference existed. Hz: hertz
TGTC: two group test coherence
NIH-PA Author Manuscript
NIH-PA Author Manuscript
Figure 6. Group level coherograms, and coherence analyses of propofol baseline and propofol-induced unconsciousness (TM and PM)
A. Group level coherogram of propofol baseline showing relative absence of coherence in the delta, theta, alpha and beta frequency bands.
B. Group level coherogram of propofol-induced unconsciousness (TM), showing increased coherence in alpha/beta frequency bands.
C. Group level coherogram of propofol-induced unconsciousness (PM), showing increased coherence in slow, delta and alpha frequency bands and a decrease in slow oscillation coherence (solid arrow).
NIH-PA Author Manuscript
NIH-PA Author Manuscript
D. Coherence of propofol baseline vs. propofol-induced unconsciousness (TM). Coherence was larger for propofol-induced unconsciousness (TM) in a broad beta/gamma range at 3.9– 15.1 Hz, and 17.3–25.9 Hz (P < 0.0003, TGTC).
E. Coherence of propofol baseline vs. propofol-induced unconsciousness (PM). Coherence was larger for propofol-induced unconsciousness (PM) 3.9–15.1 Hz (P < 0.0003, TGTC). F. Coherence of propofol-induced unconsciousness (TM) vs. propofol-induced
unconsciousness (PM). Coherence was larger for propofol-induced unconsciousness (PM) at 3.9–12.5 Hz (P < 0.0003, TGTC).
Median coherence presented with 95% jackknife confidence intervals. Horizontal solid black line(s) represent frequency ranges at which significant difference existed. Hz: hertz
PM: peak max
TGTC: two group test coherence TM: trough max
NIH-PA Author Manuscript
NIH-PA Author Manuscript
Figure 7. Group level coherence analyses comparing dexmedetomidine-induced unconsciousness to propofol-induced unconsciousness (TM) and propofol-induced unconsciousness (PM)
A. Coherence of dexmedetomidine-induced unconsciousness vs. propofol-induced
unconsciousness (TM). Dexmedetomidine-induced unconsciousness coherence was larger at 2.4–10.3 Hz, 12.2–15.3Hz (P < 0.0005, TGTC). Coherence was larger during propofol-induced unconsciousness (TM) compared to dexmedetomidine-propofol-induced unconsciousness at 17.3–25.9 Hz (P < 0.0005, TGTC).
B. Coherence of dexmedetomidine-induced unconsciousness vs. propofol-induced
unconsciousness (PM). Propofol-induced unconsciousness (PM) coherence was larger than dexmedetomidine-induced unconsciousness in frequencies surrounding the alpha oscillation peak and at a narrow gamma band, 9.3–11.7 Hz and 19.5–26.9 Hz (P < .0005, TGTC). Dexmedetomidine-induced unconsciousness coherence was larger in frequencies surrounding the dex-spindle peak, 12.9–15.4 Hz (P < .0005, TGTC).
Median coherence presented with 95% jackknife confidence intervals. Horizontal solid black line(s) represent frequency ranges at which significant difference existed. Hz: hertz
PM: peak max
TGTC: two group test coherence TM: trough max
NIH-PA Author Manuscript
NIH-PA Author Manuscript
NIH-PA Author Manuscript
NIH-PA Author Manuscript
NIH-PA Author Manuscript
Table 1
Behavioral Characteristics of Selected Electroencephalogram Epochs Selected Electroencephalogram Epochs Probability of Response to Verbal Stimuli (%) mean (± SD) Behavioral State Dexmedetomidine-induced
unconsciousness Not Measured*
Sedation Propofol-induced unconsciousness (TM) 91.5 (15.4) Sedation Propofol-induced unconsciousness (PM) 0 General Anesthesia •
this study was not structured to measure the probability of response during dexmedetomidine-induced unconsciousness (a sedative dose was administered) due to the sufficient arousal stimulus the auditory tasks posed.
PM: peak max SD: standard deviation TM: trough max