SCIENTIFIC ARTICLE
Evaluation of early tissue reactions after lumbar
intertransverse process fusion using CT in a rabbit
Jun Shinbo&Pierre Mainil-Varlet&Atsuya Watanabe&
Suzanne Pippig&Jens Koener&Suzanne E. Anderson
Received: 17 January 2009 / Revised: 22 April 2009 / Accepted: 1 June 2009 / Published online: 25 June 2009
# ISS 2009
Abstract
Objective The objective of the study was to evaluate tissue reactions such as bone genesis, cartilage genesis and graft materials in the early phase of lumbar intertransverse process fusion in a rabbit model using computed tomography (CT) imaging with CT intensity (Hounsfield units) measurement, and to compare these data with histological results.
Materials and methods Lumbar intertransverse process fusion was performed on 18 rabbits. Four graft materials were used: autograft bone (n=3); collagen membrane
soaked with recombinant human bone morphogenetic protein-2 (rhBMP-2) (n=5); granular calcium phosphate (n = 5); and granular calcium phosphate coated with rhBMP-2 (n=5). All rabbits were euthanized 3 weeks post-operatively and lumbar spines were removed for CT imaging and histological examination.
Results Computed tomography imaging demonstrated that each fusion mass component had the appropriate CT intensity range. CT also showed the different distributions and intensities of bone genesis in the fusion masses between the groups. Each component of tissue reactions was identified successfully on CT images using the CT intensity difference. Using CT color mapping, these observations could be easily visualized, and the results correlated well with histological findings.
Conclusions The use of CT intensity is an effective approach for observing and comparing early tissue reac-tions such as newly synthesized bone, newly synthesized cartilage, and graft materials after lumbar intertransverse process fusion in a rabbit model.
Keywords CT intensity . Color mapping . Intertransverse process fusion . Newly synthesized bone . Computed tomography
Introduction
Posterolateral intertransverse process fusion with autoge-nous iliac crest bone is the most common type of fusion performed in the lumbar spine and is frequently utilized for the treatment of lumbar spine disorders [1]. However, the use of autogenous iliac crest bone can lead to complica-tions, including nonunion at the recipient site and morbidity at the bone donor site [1].
J. Shinbo
:
P. Mainil-Varlet:
A. Watanabe:
J. KoenerTissue Engineering & Osteoarticular Research Unit, Institute of Pathology, University of Bern, Bern, Switzerland
S. Pippig
Scil Technology GmbH, Munich, Germany
A. Watanabe
:
S. E. AndersonMusculoskeletal Radiology, Department of Diagnostic, Interventional and Pediatric Radiology, University of Bern, Inselspital, Bern, Switzerland P. Mainil-Varlet Allevia AG, Bern, Switzerland S. E. Anderson
Medical imaging, School of Medicine Sydney,
Darlinghurst Campus, The University of Notre Dame Australia, Fremantle, WA, Australia
J. Shinbo (*)
Department of Orthopedics,
Funabashi Municipal Medical Center (FMMC), 1-21-12, Kanasugi, Funabashi,
Chiba, Japan
To overcome these complications, substitutes for autoge-nous iliac bone have been developed [2]. Recent studies have demonstrated that these substitutes should be bulky and compression-resistant to maintain the space for the fusion mass volume against the pressure from adjacent soft tissues, thereby reducing the required concentration of osteoinduc-tive molecules such as bone morphogenetic proteins in advanced animal models [3–5]. It has been reported that the use of recombinant human bone morphogenetic protein-2 (rhBMP-2) and osteoconductive biphasic ceramic compound within a collagen sponge, in combination, could be a promising candidate for bone graft substitutes [5].
Plain radiography is a simple and noninvasive method of evaluating the fusion mass. However, plain radiography has a disadvantage in that the radiograph is easily misinterpreted when evaluating whether the fusion mass is solid or not [1,6– 8]. This problem is compounded by the use of ceramic composite because of its marked relative density [9].
Although computed tomography (CT) also has the same potential misinterpretation pitfalls as plain radiography, CT has been shown to provide a more precise evaluation method for investigating fusion compared with plain radiography [4,
6–8]. Moreover, CT with reformatted images allows for evaluation of bone status in multiple plains [6, 8, 10]. Several reports have shown how CT intensity (Hounsfield units [HU]) can precisely evaluate bone objects in clinical and/or experimental settings [11–17]. In addition, helical CT can now be combined with image processing to visualize trabecular bone using CT HU intensity as a guide for CT color mapping [11]. However, few studies using CT HU intensity measurement have been performed on early bone genesis after intertransverse process fusion.
The purpose of this study was to evaluate tissue reactions such as bone genesis, cartilage genesis, and graft materials in the early phase using a clinically available CT scanner.
Materials and methods
This study was performed in accordance with the Swiss Animal Protection Law under license number 35.
Surgical procedures and graft materials
Eighteen structurally mature rabbits were subject to a one-level posterolateral intertransverse process fusion bilaterally at the L5–L6 level under sterile conditions and general anesthesia following the procedure developed by Boden et al. [1]. The animals were divided arbitrarily into four groups and four different materials were assigned to each group. The four groups were:
1. Autograft with autogenous iliac bone, 3.0 cc (n=3)
2. 1.5 g of collagen membrane (4.5 ml) soaked with 0.15 mg of rhBMP-2 (n=5) (Scil Technology, Munich, Germany) 3. 1.5 g of granular calcium phosphate (n=5) (Scil
Technology)
4. 1.5 g of granular calcium phosphate coated with 0.15 mg of rhBMP-2 (n=5) (Scil Technology) The granular calcium phosphate was identical for the last two groups. After operation, the rabbits were individually housed for 3 weeks in cages that were approximately 0.9× 1.2 m in size. Daily rounds ensured that animals were moving all extremities, posturing well, and feeding appropriately. The rabbits were euthanized 3 weeks after the operation (a time point at which Boden et al. suggested that the fusion with the autograft is not solid and newly synthesized bone is likely to be observed [1]), and the lumbar spines were removed. CT evaluation was then performed, followed by histological treatment of the samples. Finally, an evaluation of CT images was performed and compared with the histological findings.
Computed tomography
Rabbit spine specimens underwent CT scanning (Sensation-16 array; Siemens, Erlangen, Germany) with the original axial data set having a 0.75-mm slice thickness with reconstructions at 0.8-mm slice thickness in all planes, with a 512×512 reconstruction matrix and a field of view of 80 mm ×80 mm. Sagittal images were generated by using a multiplanar reconstruction procedure.
Histology
Specimens were fixed in 10% neutral-buffered formalin at room temperature for 96 h and then dehydrated through graded ethanol and cleared in toluene under vacuum and pressure on a tissue processor. The specimens were then infiltrated with an increasing concentration of polymethyl methacrylate (PMMA) and embedded in PMMA. Four sections (5 µm) per fusion site were cut in the sagittal plane and stained with modified toluidine blue stain. A sub-specialized histologist defined each tissue in the fusion mass, such as fibrous tissue, cartilage tissue, immature bone, autograft bone, residue of collagen membrane, and granules in the fusion mass. Immunoreactions, if any, were also observed.
Evaluation by computed tomography
All image data gathered by helical CT were processed using image analysis software (OsiriX, v.2.2.1). Preliminary training was performed to determine the area of fibrous tissue, newly synthesized cartilage, newly synthesized bone, and graft materials including autograft, residue of collagen membrane, and granules in sagittal CT images,
based on HU intensity values by comparing slices from both sagittal CT images and identical sagittal histological samples.
The HU of the fibrous tissue, the newly synthesized cartilage, the newly synthesized bone, and the graft materials in the fusion mass were measured. Autograft bone was not counted as newly synthesized bone. In addition, the CT intensity of cortical bone in intact L5 vertebrae was also measured as an internal control.
A skilled pathologist determined the region of interest (ROI) for each tissue. The ROI for each tissue was defined as follows. For measurement of fibrous tissue, newly synthesized cartilage, newly synthesized bone, autograft, residue of collagen membrane, and granules, the ROI was set manually, referring to the tissues as designated during preliminary training. All the ROIs were set in three sagittal plains among which the median slice was identical to that of the histological sample. Most ROIs had at least 50 pixels within the identified region. However, when the object tissue had less than 50 pixels, several ROIs were identified in different slices until the summation of the pixels was greater than 50 pixels. A representative CT HU of fibrous tissue, newly synthesized cartilage, newly synthesized
bone, autograft bone, residue of collagen membrane, and granules was determined by calculating the average of all the CT HU gathered from three CT slices.
For CT color mapping, to highlight the regions of bone generation and remodeling, the CT HU was set from 0 to 1,600 HU represented by colors ranging from dark purple to red. Color assignments were made to correspond with the range of HU measurement for each tissue.
Results
Histological findings
A representative section for each group is shown in Fig. 1A. In the autograft group, immature bone lay near the transverse processes and autograft bone. Part of the autograft bone was remodeled. Newly synthesized cartilage was often observed near both the autograft bone and the transverse processes. In the collagen/BMP group, the immature bone lay at the boundary between the degraded collagen membrane and the outer soft tissue. Newly synthesized cartilage was sometimes seen near the
imma-Fig. 1 Representative histology, CT images, and CT color-mapped images for each group. For all images, the upper region is the ventral side and the lower region is the dorsal side. The left side is the cranial
region and the right side is the caudal region. a Histological sections. b CT images (window level: 450 HU; window width: 1,500). c Color-mapped images (window level: 800 HU; window width: 1,600)
ture bone and the transverse processes. In the granule-only group, a subtle immature bone was found only near the transverse processes. Most of the granules remained intact. In the granule/BMP group, much newly synthesized bone was observed both near the transverse processes and between the granules. A relatively large mass of cartilage tissue was found surrounding the newly synthesized bone. The granules were observed to have started to degrade.
Computed tomography
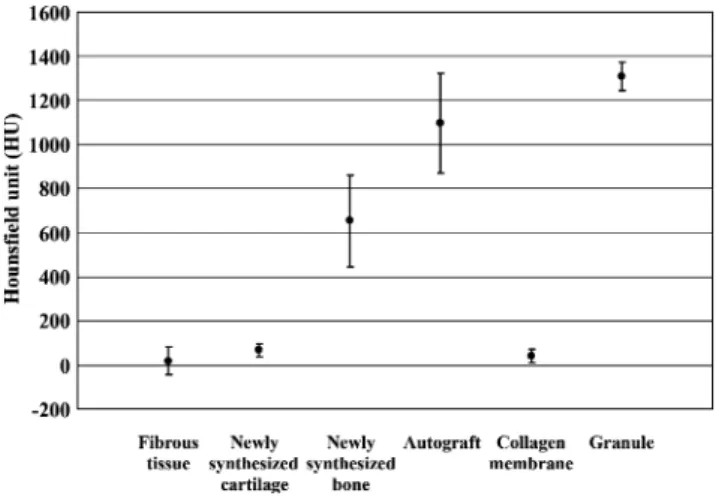
The average CT HU for the cortical bone in intact L5 vertebrae was 1,836±227 HU. The fibrous tissue, the newly synthesized cartilage, the newly synthesized bone, the autograft bone, the residue of collagen membrane, and granules were found to have CT original intensity of 20± 62 HU, 68±27 HU, 654±206 HU, 1,098±225 HU, 42± 29 HU, and 1,310±64 HU respectively (Fig. 2). Newly synthesized bone could be clearly differentiated from other tissues by this measurement.
Conventional CT and color-mapped images are shown in Fig.1B and C. The color bar was defined as follows: 1. The range from 0 to 300 HU, the dark purple to blue
area, indicated fibrous tissue, uncalcified cartilage tissue, and collagen membrane
2. The range from 300 to 1,000 HU, the green to yellow area, indicated synthesized bone
3. The range from 1,000 to 1,600 HU, the yellow to orange area, indicated remodeled autograft and granules
4. The range from 1,200 to 1,600 HU, the red area, indicated less remodeled autograft and granules For the autograft group, the area in green to yellow indicating newly synthesized bone was surrounded by the areas in red indicating autograft bone. For the collagen/
BMP group, the area in green to yellow indicating newly synthesized bone spanned between the transverse process-es. In the granule-only group, the area in red indicating the granules was dominant in the fusion mass. However, the area in yellow corresponded to regions between granules; no newly synthesized bone was observed in the histological sections. In the granule/BMP group, the area in green to yellow indicating newly synthesized bone was much broader than that in the granule-only group. In the area in dark purple to blue, newly synthesized cartilage was found in histological samples, although fibrous tissue has nearly the same color range. Apart from the yellow area in the granule-only group, all the color images correlated well with the histological findings.
Discussion
In this study, we have shown that tissue reactions such as bone genesis, cartilage genesis and graft materials can be quantified using CT imaging based on signal intensity (HU) as well as visualized with color mapping in the early phase of lumbar intertransverse process fusion.
Computed tomography has been reported to be better at detecting bone fusion in posterolateral lumbar fusion than conventional radiography [6] and is frequently used to evaluate spine fusion in both clinical and experimental studies. Observations of bone bridging, bone continuity, and radiolucent gaps are used to evaluate spine fusion. However, such evaluations are relatively subjective and may be misinterpreted compared with direct surgical examination. Computed tomography classification using CT HU has already been successfully applied in the evaluation of trabecular bone [11], bone graft within an intervertebral lumbar cage [12,13], fracture site [14], bone periacetabular resorption after total hip replacement [15, 16], and for the fusion mass of posterior spinal fusion [17]. According to the literature, there are several key points to ensure the evaluation including:
1. Slice thickness 2. ROI
3. Window level and width
To prevent artifacts caused by metallic implants, or cortical bone with higher HU, a thinner CT slice provides more accurate results [11–13]. A safe distance should be applied when ROIs are set near the implant or the bone graft [13]. Lengsfeld et al. reported that 300 to 1,600 HU effectively delineated bone area on CT images and a threshold above this HU range was introduced to delete metal-induced enhancement [16]. Kobayashi et al. demon-strated visualization at 80 to 1,100 HU and quantification of trabecular bone using color mapping [11].
Fig. 2 Comparison of the average CT HU intensity (± SD) of each fusion mass structure after lumbar intertransverse process fusion. This demonstrates that each tissue has its own range of CT HU
In this study, the HU signal intensity was set at 0 to 1,600 HU to enable the detection of newly synthesized bone, fibrous tissue, newly synthesized cartilage, residue of collagen membrane, and granules in the fusion mass. Newly synthesized cartilage was included because of its important role in osteogenesis through membranous ossification. However, identification of newly synthe-sized cartilage was difficult in color-mapped images without histological sections because of its similarity to fibrous tissue. Conversely, there was a clear difference between the HU of the fibrous tissue and newly synthesized bone. As a result, newly synthesized bone was relatively easy to identify among other tissues at 300 to 1,000 HU.
One limitation of this study is the temporal change of the signal intensity of newly synthesized bone during bone genesis progression. It should become more difficult to distinguish the newly synthesized bone from granules as bone genesis progresses, as the appearance of the newly synthesized bone and the granules might overlap. Another limitation is the partial volume effect, which could lead to the misinterpretation that images of smaller structures with high CT intensity were depicted as larger than their actual size [11]. Different bone substitutes have different proper-ties in bone genesis and influence local interpretation. Therefore, the property of materials has to be taken into consideration when the fusion mass is color encoded. Another limitation was the relatively small number of rabbits used. Therefore, further studies with larger numbers of subjects are needed. In this study, we used a clinically available CT scanner, although a dedicated microCT unit would have been the preferred option if it had been available. However, this study does show that useful results are obtained in small animal studies using a clinical CT scanner and that early bone reactions can be measured using color-encoded CT images.
Advantages of this CT technique are that it allows for objectivity of the findings, it correlates well with histology, and the results are reproducible. Therefore, use of this technique may allow for continued follow-up in animal models, permitting longer term experiments and could decrease the need for early euthanasia. In an increasingly cost-efficient oriented world, the ability to follow animals over a long period of time with objective quantification techniques is advantageous.
In conclusion, evaluation using CT image intensity measurements and color-encoded images in early tissue reaction after lumbar intertransverse process fusion in a rabbit model visualizes tissue reactions such as bone genesis, cartilage genesis, and graft materials in the early phase of lumbar intertransverse process fusion in a rabbit model. Also, CT images correlate well with histological findings. There are many potential applications of
color-encoded CT images, for example, the investigation of new industrial materials.
References
1. Boden SD, Schimandle JH, Hutton WC. An experimental lumbar intertransverse process spinal fusion model. Radiographic, histo-logic, and biomechanical healing characteristics. Spine.
1995;20:412–20.
2. Boden SD. Bioactive factors for bone tissue engineering. Clin
Orthop Relat Res. 1999;367(Suppl):S84–94.
3. Martin GJ Jr, Boden SD, Marone MA, Moskovitz PA. Postero-lateral intertransverse process spinal fusion with rhBMP-2 in a nonhuman primate: important lessons learned regarding dose, carrier, and safety. J Spinal Disord. 1999;12:179–86.
4. Suh DY, Boden SD, Louis-Ugbo J, et al. Delivery of recombinant human bone morphogenetic protein-2 using a compression-resistant matrix in posterolateral spine fusion in the rabbit and in
the non-human primate. Spine. 2002;27:353–60.
5. Barnes B, Boden SD, Louis-Ugbo J, et al. Lower dose of rhBMP-2 achieves spine fusion when combined with an osteoconductive bulking agent in non-human primates. Spine.
2005;30:1127–33.
6. Brodsky AE, Kovalsky ES, Khalil MA. Correlation of radiologic assessment of lumbar spine fusions with surgical exploration.
Spine. 1991;16:S261–5.
7. Siambanes D, Mather S. Comparison of plain radiographs and CT scans in instrumented posterior lumbar interbody fusion.
Ortho-pedics. 1998;21:165–7.
8. Yee AJ, Bae HW, Friess D, Robbin M, Johnstone B, Yoo JU. Accuracy and interobserver agreement for determinations of rabbit posterolateral spinal fusion. Spine. 2004;29:1308–13.
9. Boden SD, Martin GJ Jr, Morone M, Ugbo JL, Titus L, Hutton WC. The use of coralline hydroxyapatite with bone marrow autogenous bone graft, or osteoinductive bone protein extract for
posterolateral lumbar fusion. Spine. 1999;24:320–7.
10. DePalma AF, Rothman RH. The nature of pseudoarthrosis. Clin
Orthop Relat Res. 1968;59:113–8.
11. Kobayashi F, Ito J, Hayashi T, Maeda T. A study of volumetric visualization and quantitative evaluation of trabec-ular bone trabeculae in helical CT. Dentomaxillofac Radiol.
2003;32:181–5.
12. Spruit M, Meijers H, Obradov M, Anderson PG. CT density measurement of bone graft within an intervertebral lumbar cage: increase of hounsfield units as an indicator for increasing bone
mineral content. J Spinal Disord Tech. 2004;17:232–5.
13. Burkus JK, Dorchak JD, Sanders DL. Radiographic assessment of interbody fusion using recombinant human bone morphogenetic protein type 2. Spine. 2003;28:372–7.
14. Lynch JA, Grigoryan M, Fierlinger A, et al. Measurement of changes in trabecular bone at fracture sites using X-ray CT and automated image registration and processing. J Orthop Res. 2004;22:362–7.
15. Schmidt R, Pitto RP, Kress A, et al. Inter- and intra-observer assessment of periacetabular osteodensitometry after cemented and uncemented total hip arthroplasty using computed
tomogra-phy. Arch Orthop Trauma Surg. 2005;125:291–7.
16. Lengsfeld M, Gunther D, Pressel T, Leppek R, Schmitt J, Griss P. Validation data for periprosthetic bone remodeling theories. J
Biomech. 2002;35:1553–64.
17. Lindfors NC, Tallroth K, Aho AJ. Bioactive glass as bone-graft substitute for posterior spinal fusion in rabbit. J Biomed Mater