Design and Measurements of Novel Electromagnetic
Properties in Spiral Transmission Fibers
by
Dana Shemuly
B.Sc. Physics
Hebrew University, Israel, 1999
ARCHNES
MASSACHUSETTS INSTiJTEOF TECHNOLOGY
JUl
0
6 2012
LIBRARIES
Submitted to the Department of Materials Science and Engineering
in Partial Fulfillment of the Requirements for the Degree of
Doctor of Philosophy in Materials Science and Engineering
At the
Massachusetts Institute of Technology
February 2012
C2012 Massachusetts Institute of Technology
All rights reserved
Signature of Author:
//
Certified by:
Department of Materials Science and Engineering December 21, 2011
Professor of Materials
Yoel Fink Science and Engineering Thesis Supervisor
Accepted by:
R. P. Sin
Gerbrand Ceder rmons Professor of Materials Science and Engineering Chair, Departmental Committee on Graduate Students
-Design and Measurements of Novel Electromagnetic
Properties in Spiral Transmission Fibers
by Dana Shemuly
Submitted to the Department of Materials Science and Engineering
on December 21, 2011, in Partial Fulfillment of the Requirements for the Degree of Doctor of Philosophy in Materials Science and Engineering
ABSTRACT:
One dimensional photonic band gap fibers have proven to be fascinating and versatile devices, as demonstrated by many applications. The ability to control and design these fibers to achieve specific functionalities will enable us to advance the research done with these fibers and to gain new applications. In this work we explore our ability to control different fabrication parameters to design a fiber according to certain requirements. We use these capabilities to design and fabricate a near IR fiber for high peak power laser transmission. Since a multimode fiber supports many modes one can gain further control over fiber properties by controlling modal content in the fiber. We developed two techniques for controlled coupling and demonstrated them using one dimensional photonic band gap fibers. Using a spatial light modulator, one can dynamically control the modal content in the fiber, including superposition of more than one mode. We experimentally demonstrate this capability by coupling to one of two modes and superposition of the two. Using a static technique, we experimentally demonstrate a single-mode transmission of the azimuthally polarized mode (TEoi) in a highly multi-mode cylindrical photonic band gap fiber. Theoretical calculations verify the validity of this technique and accurately predict the coupling efficiency. Single-mode propagation in a large hollow core fiber can enable numerous applications, especially in control of particles along the entire length of the fiber. Finally, we examined the effects of the spiral cross-section of the fiber on its optical properties. The fiber's chiral symmetry combined with its infinite translational symmetry creates a truly planar chiral structure, similar to many artificial chiral structures recently studied. The low-symmetry geometry of the fiber, which lacks any rotational and mirror symmetries, exclusively supports modes with angular momentum greater than zero and shows in-principle directional optical activity and asymmetric propagation. We use general symmetry arguments to provide qualitative analysis of the waveguide's modes and numerically corroborate this using finite element simulation. We also demonstrated these properties experimentally using spiral fibers. Thesis Supervisor: Yoel Fink
Title: Director of Research Laboratory of Electronics and Professor of Materials Science and Engineering
Acknowledgments
I am heartily thankful to my supervisor, Professor Yoel Fink. His enthusiasm, knowledge and guidance have been constant inspiration. He has been helpful and encouraging during the many ups and downs of the research and PhD program. Deepest gratitude is also due to my thesis committee members: Professor John D. Joannopolous and Professor Silvija Gradebak. Their input and insights have been valuable. Special thanks also to Professor Steven Johnson, an enthusiastic and gifted teacher whose class was the first I took in MIT. Years later, his help and passion for research were invaluable to my research of spiral fibers. I am grateful to Professor Aharon Agranat, who led me here with his advice and help.
It is a pleasure to thank past and present members of my research group including Dr. Ayman Abouraddy, Jerimy Arnold, Dr. Gilles Benoit, Noemie Chocat, Dr. Sylvain Danto, Daosheng Deng, Dr. Shunji Egusa, Dr. Alexander Gumennik, Guillaume Lestoquoy, Dr. Nick Orf, Dr. Peter Rakich, Zach Ruff, Dr. Ofer Shapira, Dr. Fabien Sorin, Grisha Spektor, Sasha Stolyarov, Jeff Viens, Dr. Zheng Wang and Dr. Lei Wei. Each and every one of them has been helpful with many aspects of my research, as well as good friends. I owe my deepest gratitude to Dr. Ofer Shapira, who has been a mentor as well as a friend. His infinite knowledge and equally infinite patience and willingness to help have not only allowed this research, but have shaped me and enabled me to be here today. My discussions and work with Zach Ruff, a dedicated researcher and scientist, have taught me most of what I know about materials and have also been fun. Dr. Zheng Wang was a patient instructor who taught me how to learn from my mistakes
-an import-ant lesson for -any researcher. Dr. Sylvain D-anto has shown me that you c-an be a great scientist without sacrificing your other loves. He is a dear friend of mine. Dr. Nick Orf has walked me through my first years in the lab - there was no machine he did not know or could not fix. Dr. Lei Wei and Sasha Stolyarov have always provided support and advice.
Thanks to the people in OmniGuide, especially Vladimir Fuflyigin, Michael Donohue and Chia-Chun Chung, who were always willing to share their knowledge. Also thank you to the ISN staff, and in particular, William DiNatale and Steven Kooi, who have solved many problems with various equipment, allowing me to produce many of the beautiful pictures in this thesis.
No man is an island and in the taxing road to graduation filled with ups and downs, I would not have managed without my friends: Einat Lev, who has been there for me always, giving a shoulder to cry on or a smile to share; Sarah Thevenet and Sarah Bernardis, who have shared classes and so much more with me; and Tamar, Amit, Maya, Nadav, Sharon, Oded, Yadid, Ifaat, Edya and Shay, who have all been good friends. I would also like to thank Anoma and Rohan who have served as surrogate family away from home.
Last, but never least, my family. My parents, Ronnie and Chana, who planted the seeds for this endeavor and who have supported me and gave me love all my life. My brothers, Yuval and Dror, who always knew how to make me smile. My daughter, Shani, who might not have made things easier, but is worth everything. And finally, my husband, Zachi, who has traveled across the ocean, following my dream: without your love I could never make it.
Table of Contents
1
Introduction... 62 Fiber Fabrication and D esign ... 9
2.1 Introduction ... 9
2.2 Fiber Fabrication ... 11
2.2.1 Introduction and Theory ... 11
2.2.2 Fabrication ... 13 2.2.3 Fiber D esign ... 16 2.2.4 M aterials... 19 2.3 Experim ent ... 21 2.4 Conclusions ... 26 3 C ontrolled Coupling ... 28 3.1 Introduction ... 28 3.2 Theory ... 30
3.3 Spatial Light M odulator Project... 33
3.3.1 Theory ... 34
3.3.2 Experim ent and Results... 37
3.4 TE Project... 40
3.4.1 Introduction... 40
3.4.2 Theory and Sim ulation... 41
3.4.3 Experim ent and Results... 49
3.5 Conclusions ... 53
4 Spiral Fiber ... 55
4.1 Introduction ... 55
4.2 Sym m etries... 57
4.3 Sim ulation ... 64
4.3.1 One D im ensional Photonic Band Gap Fiber... 67
4.3.2 One Dimensional Photonic Band Gap Fiber with a Triangular "Seam "68 4.3.3 Elliptical One Dimensional Photonic Band Gap Fiber... 73
4.3.4 Spiral Fiber ... 76
4.5 Optical Activity ... 85
4.6 Conclusions ... 89
5 Conclusions... 90
6 Bibliography... 92
1 Introduction
Since they were first introduced more than a century ago, waveguides have been integrated into our daily lives; from Internet and long-distance communication, to museum lighting and medical devices, waveguides are everywhere. In this thesis we will highlight how understanding the fundamental principles behind one type of waveguide-the one dimensional photonic band gap fiber, can provide us extreme flexibility in designing the fiber to achieve a specific goal. We will show tools developed to allow us control fabrication and use of the fiber to achieve tailoring the waveguide for our needs.
Waveguides have been studied for the past century. They were first suggested by J. J. Thomson in 1893 [1], and mathematically studied by Lord Rayleigh in 1897 [2]. Metallic waveguides were studied in the 1930s, and in the 1970s, they were proposed as means for long-haul communication systems, only to be replaced by the emergence of optical fibers.
Since first guiding light in water fountains for decorative uses in the 19th century,
optical waveguides have come a long way. By the time the laser was invented in the 1960s, glass fibers, made from high index core covered with lower index cladding, were already in use for medical purposes. Over the next 30 years, the need for wider bandwidth pushed research and produced three generations of fibers with fiber losses dropping from ldB/m to less than 0.2dB/km [3]. Today commercial fibers are usually made from silica and doped silica, and serve many purposes. Optical fiber confines the light through the principle of total internal reflection (or index guiding), where light is confined due to the differences in index of refraction between core and cladding.
Photonic crystals, introduced in 1987 by Yablonovitch [4], have enabled a new form of waveguide. In photonic crystals, the light is being manipulated due to the periodicity of the crystal which may give rise to band gaps. Light with frequencies within such a band gap will be "forbidden" to travel in the crystal [5]. These structures present a novel way to construct waveguides; by inserting a defect in the crystal, we can confine light to the defect. Similar to the millimetric metallic waveguide which confines waves with certain frequencies to propagates only along its axis, these photonic crystal waveguides can confine light, not due to index guiding (as in silica optical fibers), but
due to their band gap. Fashioning photonic crystals into fibers, by using one or two dimensional photonic crystal fibers as the walls surrounding the fibers' core, has produced the photonic crystal fiber (PCF) and the Bragg fiber (one dimensional photonic crystal fibers) [66, 7]. In these fibers, much like millimetric waves in a metallic waveguide, light can be transmitted in an air filled core, allowing transmission of wavelengths not available to conventional silica fibers.
Though the periodic structure of photonic crystals is a good example of "the whole is greater than the sum of its parts," having optical properties well beyond those of its constituent materials, the materials' properties still play an important role. Band gap appearance and width, for example, are dependent on the materials indices of refraction. In our group, we have pioneered the fabrication of one dimensional photonic band gap fibers based on the combination of polymers and glasses [7, 8]. In the last decade, it has been shown that other materials can also be incorporated into the fibers, expanding their applications and capabilities even further [9]. The insertion of metal, semiconductors, and recently even piezoelectric materials has enabled fabrication of devices from photodetectors [10] to piezoelectric transducer [11]. More functionality can be gained by breaking the periodicity of the structure, allowing control of dispersion [12] or adding a Fabry-Perot filter to the fiber [12, 13]. This continuously expanding range of possibilities proves these fibers to be a fruitful base for many applications and a handy tool for continued research. To fully realize this potential, it is useful to have the knowledge and control that will allow us to use a conscious and methodic approach to fiber fabrication and use.
In this thesis we are going to show how we can achieve a new level of flexibility and capabilities by having a better understanding of fiber properties and structure which will allow us to design the fiber to achieve a specific goal. We will show how we can design the fiber structure and fabrication, controlling the different parameters in the process to tailor the fiber to our needs. And we will show how we can control the fiber optical properties by understanding the coupling the propagation process in the fabricated fiber to tailor the way light couples and travels through the fiber to achieve a specific field in and out of the fiber. Having the capabilities to control both the fiber physical structure and light propagation we will finally show how the fiber's structure produce
new functionalities based on its symmetries. Though we will focus on the transmission fiber many design and control tools explained here are relevant to other fibers and waveguides. We will mention, whenever relevant, where our conclusions could be expanded to include more than the examples given here.
In Chapter 2, we will explore our ability to control and tailor the fabrication process to achieve certain goals. We will explain the fabrication process and how one can relate different parameters in the fabrication to the final fiber properties. Identifying the control parameters and the feedback tools in the fabrication process, we will demonstrate fabricating low-loss high-power laser transmission fiber.
In Chapter 3, we will focus on the interaction of light with the fiber. After the fiber is fabricated one can still gain control of the fiber optical properties by controlling the coupling and modal content of the fiber. Each of the eigenstates of the fiber has different properties, and by controlling the eigenstate population in the fiber, one can gain higher levels of flexibility in fiber applications. We will describe the mechanism of coupling and fiber modes, and show two possible techniques developed to control the coupling to the fiber. These two techniques differ in methods and goals and can be used for different requirements.
Finally, we will show in Chapter 4 how the fiber fabrication technique produces a new type of waveguide- a spiral fiber. We will show how the fiber symmetries affect its optical properties, reminiscent of those of many artificial planar chiral structures studied in the past decade. We will show experimental results demonstrating some of the properties shown in theory and by finite element simulation. We will also discuss properties of the fibers that can have potentially exciting applications. This chapter demonstrates how an understanding of fiber fabrication, structure and properties can open up new possibilities for novel uses for these versatile fibers.
2 Fiber Fabrication and Design
2.1 Introduction
High power lasers in the near infrared (NIR) have many applications, such as in the medical field and in the industry. Fibers which are flexible waveguides, that can guide light from one point to another, can be used in combination with high power lasers to ease the transport of the light from the laser to the target destination. A good example for such an application is the optical ignition [14]. A laser is used to create a spark and ignite an engine. For this application, a high power laser source is needed. By using fibers as part of the systems, a few advantages can be achieved: first, the placement of the laser source far from the engine and use of the flexible fiber to deliver the light to the engine, and second, the use of multiplexing, by which one laser source is used to ignite more than one engine and the light is delivered from the laser to the different engines by using fibers.
To allow the use of fibers for high power applications, the fiber first has to be able to withstand the high powers without any damage. For this reason hollow core fibers have a distinct advantage. In hollow core fibers, unlike silica fibers, the light is confined and travels in air and not through the material. Therefore, the only interaction the transmitted light has with the fiber material is at the core walls and cladding where the light intensity is lower and, therefore, the light-matter interaction is much smaller than in silica fibers. This smaller interaction makes material loss, dispersion or defects have much smaller effect on the transmission through the fiber. Furthermore, the frequencies that can be transmitted using the fiber are determined by the fiber structure and not the material absorption, which allows transmission in larger variety of wavelengths. Aside from transmitting high-peak power pulses, for many applications the quality of the beam at the output of the waveguide is important. High quality mode at the output of the waveguide allows easy focusing and handling of the beam for any use intended.
Hollow core waveguides for the NIR can be achieved by either combining a coating of metal and polymer or by using a periodic structure to confine the light in the core. Both techniques have been used and demonstrated to deliver high-peak-power laser pulses. A metal coated waveguide allows transmitting high-peak power pulses, but it is
complicated to fabricate and produces poor mode quality [14, 15]. Photonic crystal fibers, either with two dimensional symmetry (called photonic crystal fibers, or PCF), or with one dimensional symmetry (called one dimensional photonic band gap fibers, 1D-PBG fibers, or Bragg fibers) present an interesting alternative. PCFs are usually made from silica with air holes in a periodic structure around the air core. These fibers have also been used to deliver high-peak power laser pulses with good mode quality. Unfortunately, despite the hollow core design, a proportion of the guided mode propagates within the solid glass material. The core and mode field size are limited by the close-packed hexagonal geometry of the fiber resulting in high optical density within the glass. Hence, the effects of self-phase modulation (SPM) and other optical nonlinear responses limit the pulse energy. Furthermore, due to the interaction with the silica, these fibers are still somewhat limited by the damage threshold of the silica [16, 17, 18, 19].
1D-PBG fibers or Bragg fibers were first conceived at the end of the 1970s by Yeh and Yariv [20]. A bilayer structure surrounds an air core with a periodic one dimensional structure. The periodicity of the structure gives rise to a band gap which allows confinement of light to the core. Since being suggested in the 1970s, these fibers have been used to demonstrate many interesting properties and applications [21-24]. It has been shown [25] that one of the advantages of photonic crystal structures, in general, is their scalability. This scalability implies that if a structure is designed to confine light at a specific wavelength, k, the same structure scaled down by 2, for example, will confine light at a wavelength, )/2. Though this property seems interesting, it becomes of practical importance due to the fabrication technique used to create fibers. Much like silica fibers, 1D-PBG fibers are made by creating a preform- a large scaled up model of the fiber, which is mounted on a tower and then drawn into fiber [23]. This technique makes the use of the scaling properties of the 1D-PBG fiber, since scaling down the structure simply means drawing the fiber from the preform into a smaller cross-section. In theory, this allows the same preform to be drawn to transmit light at almost any wavelength. In practice, there are some limitations, but the combination of the scaling property and the fabrication technique have allowed the demonstration of fibers that can transmit light from less than Ipm out past 10 pm [22, 23].
Like the structure's scale, many other structure's properties affect the light propagation properties directly. As the layers' thicknesses determine the wavelengths that can be transmitted through the fiber, the core diameter determines the number of modes in the fiber and its sensitivity to bending losses. Moreover, deviation from the ordered structure, the insertion of a thicker layer, for example, can profoundly alter the fiber properties allowing, in this case, the control and tailoring of dispersion properties [12]. Even though the interaction with the materials in the bilayers is much smaller than in regular silica fibers, materials properties still affect the fibers properties, e.g. the layers' indices of refraction and index contrast will affect the existence of band gap and its width.
In this chapter we will explain the method of fabricating a low-loss, high-peak power 1D-PBG fiber. We will discuss material selection and structure design. Finally we will show experimental results and techniques and demonstrate high-power transmission through the fiber.
2.2 Fiber Fabrication
2.2.1 Introduction and Theory
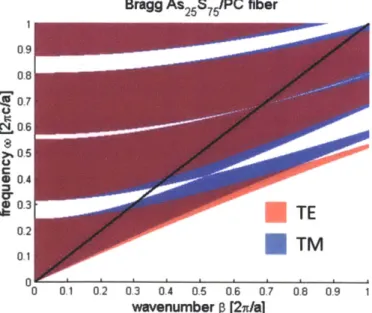
It has been shown that an all dielectric planar structure constructed of multilayer films of high dielectric contrast can reflect light at certain wavelengths for all incidence angles and polarizations [21] - omni-directional reflectance. These structures can serve as an directional reflector in a hollow core waveguide. The reason for this omni-directional reflectance lies in the appearance of a photonic band gap due to the periodicity of the structure and the high index contrast between the layers (Figure 2.1).
Bragg As25S7 /PC fiber 02 0.6 0.5 0 0.4 a-0.3 0.2 0.1 0 0.1 0.2 0.3 0.4 0.5 0.6 0.7 wavenumber p [2W/a] 0.8 0.9
Figure 2.1: An example of a band diagram for a flat one dimensional periodic stack made of
polycarbonate (n=l.57) and As25S75 (n=2.27). The shaded regions describe states which are extended.
Blue indicate transvers magnetic (TM) polarization (E out of the incidence plane) and red transverse electric (TE) polarization (E in the incidence plane), or purple for both. The white regions above the light line are the band gap regions. The axes are the wavenumber along the fiber axis, normalized by the width of the bilayer, a, and the normalized freqeuncy.
The hollow core one dimensional photonic band gap fiber is constructed of a set of concentric layers surrounding an air core (Figure 2.2, on the right). This structure has several symmetries allowing for an elegant solution of the Maxwell equations [26]. The guided modes are discrete solutions positioned within the band gap as seen in Figure 2.2
R = 2.0 a 0.5 0.4 70 ej 0.3 S $ 0.2 LL 0.1 0 0 r 0.1 0.2 0.3 Wavevectorp (2n/a) 0.4 0.5
Figure 2.2: Right panel: a schematic of a hollow core photonic band gap fiber (Bragg fiber). The
blue layers are the high index material, and the orange layers are the low index material. Left Panel: an example of a band diagram of a Bragg fiber, with the core guided modes marked in red and blue inside the band gap [24]. The HE,1 mode is the closest to the light line (marked in black). It is the fundamental mode and easy to couple to (due to its resemblance to a Gaussian beam).
(left panel). The symmetries of the fiber and its modes will be discussed in some length in Chapter 4.
For the purpose of this chapter, it is important to know that exceptional degrees of freedom in independently tailoring waveguide properties, such as absorption, dispersion and nonlinearity, are achieved by controlling structural parameters including core size and layer thickness. Further optimization on constituent materials allows enhancement or suppression of light-matter interaction. By careful design of the structure parameters and choice of materials, we can achieve our goal of low-loss high-power fiber.
2.2.2 Fabrication
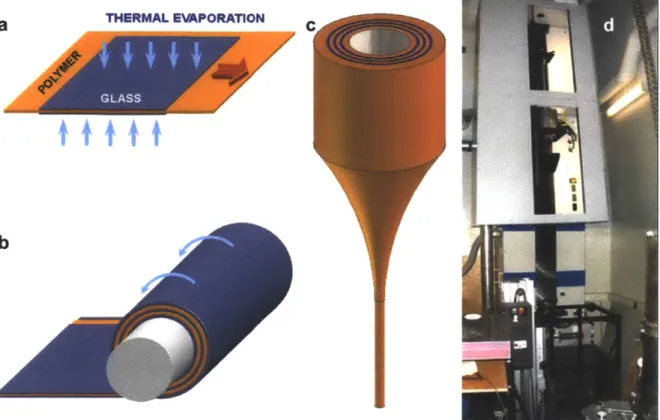
The fiber fabrication is based on the optical fiber drawing process in which a macroscopic preform is drawn in a thermo-mechanical process into a fiber [23]
(Figure 2.3). The preform is made by rolling a polymer sheet covered with glass to achieve the periodic bilayer structure. As the process of making and drawing the preform involves multiple thermal and stress cycles, several material requirements arise in order to allow for a successful process. Not only should both materials (polymer and glass) have high index contrast, they should also have compatible glass transition temperature, Tg, thermal expansion coefficients and viscosities at the drawing temperature. These properties will allow co-drawing the materials during the drawing process, ensuring the fiber will maintain the structure of the preform. This limits the possible choice of materials. Successful photonic band gap fibers were drawn using a polymer as the low index material; using polymers such as poly(ether sulfone), PES, poly(ether imide), PEI, cyclo-olefin copolymer (COC) and polycarbonate (PC), and chalcogenide glass as the high index material; using arsenic sulfide and arsenic selenide combinations among others.
The process begins with the thermal evaporation of the high index chalcogenide glass on both sides of a low-index thin polymer film (Figure 2.3a). To obtain a long sheet of polymer/glass, a custom roll-to-roll evaporator is used in which a polymer web passes over two sets of evaporator boats, allowing glass to be deposited independently on either side of the film. It has been shown that to eliminate surface modes, the first layer needs to be half a layer thickness of the high-index of refraction material [25]. To achieve this, we
a
THERMAL EMPORAIONt
JI
t
C,
I
Figure 2.3: Illustration of the preform-based fabrication process. a) The high index material (glass) is thermally evaporated onto the low-index material (a thin polymer film). b) The glass/polymer sheet is then rolled onto the madrel to create the interchanging layers. A polymer layer is wrapped around the coated fi lm
for protection. c) The preform is consolidated in a vacuum oven and mounted onto a draw-tower (seen in d) where it is thermally drawn to mesoscopic-scale fibers. The cross-section of the resulting fibers retains the same structure and relative sizes ofthe components at the preform level.
can simply coat both sides of the polymer with half a layer of glass. During the rolling this will accomplish having half a layer as the first layer and subsequently full layers.
2.2 2.2 2- 2 1.8 -1.8 i 1.6 -1.6 1.4 1.4 1.2 0 30 60 93 .2 angle [deg]
Figure 2.4: Simulated band diagram for an ideal PBG structure of As25S75 and polycarbonate with a fundamental band gap centered at 1.55 pm. Regions with propagating modes are shaded (blue for TM, red for TE and purple for both)
To create a hollow core fiber, the film is then wrapped around a ceramic or metal tube covered with Teflon (Figure 2.3b). To provide mechanical strength, additional polymer films are then added to create a thick cladding layer. The preform is then consolidated by heating in a vacuum oven, fusing the films together. After consolidation, the preform is cooled and the tube removed from the center. The preform is placed in a draw tower (Figure 2.3d) where the tip of the preform is heated until it softens and can be pulled to a fiber (Figure 2.3c). Throughout the process, pressure is applied to the core of the fiber by flowing inert gas through the preform core, in order to keep the core from collapsing due to surface energy. In order to control the fiber properties, it is important to maintain the relative ratio of the core size and layers thickness, to scale uniformly the fiber down from the preform. This means that any change between the ratio of the outer and inner diameter of the preform to the fiber (normalize-shrink down ratio or NS) would cause the layers thickness to chirp (increase or decrease in thickness), decreasing the fiber's spectral bandwidth. Therefore, controlling the fiber dimensions during the draw is extremely important.
During the draw we want to maintain the fiber dimensions: the outer and inner diameter (and therefore also the layers thicknesses), the periodicity of the layers and the band gap width and position. To control these properties, we can control the pulling speed (the draw speed), the gas pressure and the furnace temperature. All of these
parameters will affect the fiber differently with different response times, and they are not independent. A good understanding of the process coupled with fabrication experience is needed to maintain and achieve the desired goal. To help, we use several measurements tools during the draw to get as much information as possible to help with making decisions and changing the process to allow the desired result to be reached. The fiber's outer diameter is constantly measured using a laser micrometer, giving us the outer diameter and its standard deviation. This measurement allows us to avoid chirp in the bilayers, but also maintains the fiber shape along its axis, as a change along the axis will also reduce fiber performance.
Another monitoring tool used during the draw is direct and indirect monitoring of the fiber band gap. An FTIR microscopy (Bruker, Tensor 37) is used to measure the light reflecting off the fiber outer walls. These measurements can be used to indicate the level of order of the periodic structure, as well as give an indirect measure of the fiber band gap. A more direct measurement of the fiber's axial transmission spectrum is done to ensure the correct position of the fiber's transmission band gap using an infrared spectrometer (Photon control, SPM-002 NIR1700). An example of the theoretical band gap for both reflection and transmission is shown in Figure 2.4.
The end result of this process is hundreds of meters of fiber from a single preform.
2.2.3 Fiber Design
Due to the close relationship between the fiber structure and its properties, we have a high degree of control over the fiber's properties by using careful design of the fiber and careful materials selection. We will discuss the materials in details in the next section but for now we will briefly explain how different parameters can be chosen and tailored to achieve a specific set of fiber properties, in this case a low-loss, high-power fiber in the NIR.
The layers' thicknesses determine the position of the band gap. If we aim for a fiber in the NIR, for example, a fiber that could transmit light at 1.55pm, we can now determine the required layers thickness according to the approximate "quarter
wavelength" condition where each layer thickness is about - - where di is the
thickness to the ith layer {i=1,2} and ni is the index of refraction of the ith layer. Thus the thickness of the layers is determined solely by the required wavelength and the chosen materials index of refraction. For materials with index of refraction of 2.27 (As2 5S75) and 1.52 (PC), this means layer thickness of 187nm and 333nm, respectively. Fiber which transmit light at a different wavelength could simply be achieved by changing the layers' thickness according to this condition.
As described in the Fabrication section (2.2.2), during the draw the preform is scaled down to achieve the fiber. This means that the preform is a scaled up structure of the fiber. If we want to reach certain thicknesses we merely need the thickness of the layers in the preform to maintain the ratio we aim for (in this example's case 333/187). Although theoretically this holds true, in practice there are several limitations. As any deviation from the layers' periodicity or thickness will cause reduction in fiber performance, so will deviation along the layers. This means that any deviations in the layers' thickness in the preform will translate to deviation in the fiber and reduce performance. Therefore, extreme caution has to be taken when choosing polymer and evaporating the glass to allow for maximum thickness uniformity. In the case of the polymer, commercially available films of polycarbonate come with the required uniformity for thicknesses thicker than 20pm. This will limit the scale down factor, or draw-down ratio, of the polymer to fiber. The ratio between the diameter of the preform, D, for example, to the diameter of the fiber, d, will be limited by the value 20/.333 or: D/d>60. For the glass layer, the limit is different. Since we evaporate the glass on the polymer and later roll the polymer covered sheet on a mandrel, we need to consider stress relief in the glass. Stress accumulated during the deposition step will cause cracks and defects in the glass layers that will affect the fiber quality. Though we can minimize stress by controlling the evaporation process and careful choosing of mandrel size, the thicker the layers, the higher the risk of damage to the film during the fabrication process and the formation of defects. Experimentally we have seen that, for small mandrel size (small core), glass thickness below 20pm will allow for high quality film limiting the draw down ratio to be smaller than 110: D/d<20/.187=1 10.
After understanding the limits to the draw-down ratio we can now address the core size. The core size determines several key properties of the fiber (for more analytical review see 24]). The smaller the core, the larger interaction the light will have with the
layers' material, and the more affected the fiber properties will be by material properties such as absorption and dispersion. As seen in [27], the amount of field in the cladding for a 1D-PBG fiber is proportional to R-1, where R is the core radius. As a side note, this is also the reason why many solutions to the high-power waveguide problem have chosen to favor large core waveguides. On the other hand, the susceptibility to coupling between modes inside the fiber is also dependent on the core size: the smaller the core, the larger the spacing between modes (the differences in the wave-vectors, Ap=pi-p2) and the less chance of inter-mode coupling. This effect is dependent on the radius, too, as inter-mode coupling oc AP2 oc
R. This effect defines what happens when the fiber is bent or when there are defects present. The larger the fiber core, the more likely a bend or a defect will cause one mode to couple to another, reducing mode quality at the output and increasing the propagation loss. In the case of high power transmission, this increase in loss can cause fiber failure. Though in this example fewer modes are desirable, other applications may benefit from having many modes. One such application can be data transmission where more modes mean more data. We can control the amount of data that can be transmitted by choosing the core size, which will control the exact amount of modes supported by the fiber.
To fully eliminate inter-mode coupling in the fiber the core has to be very small. A calculation in [27] shows that to achieve a practical "single-mode" operation, the core diameter has to be between 8 and 22 wavelengths, or, in the case of 1.55 pm fiber, between 12pm and 34ptm. Knowing the limits on the draw-down ratio allows for an inner core diameter of the preform to be between 0.75mm and 3.5mm. This poses several problems: first, as just shown, the smaller the core, the larger the interaction with the cladding and the higher the absorption loss due to that interaction; second, a practical problem- the smaller core requires rolling on a smaller mandrel with higher curvature. This high curvature increases the chance of formation of cracks and defects in the glass layer, but is also practically difficult to roll. Due to both these reasons, we have experimentally chosen a mandrel size of 4mm. Although it does not allow for a "single
mode" operation, it is still small enough to allow for very little inter-mode coupling, but not too small to make fabrication cumbersome or affect losses substantially.
We have defined the layers thicknesses and core size in our fiber and preform, the final parameters to be defined are the materials used for the layers. We will discuss the materials properties and selection in the next section.
2.2.4 Materials
Even though in the 1D-PBG fiber the light is confined to the air filled core, the materials still affect the fiber properties. The index ratio between the two materials will determine whether there is a band gap and its width. Furthermore, though the interaction with the materials is small, the fiber loss is still affected by the materials absorption, especially due to the light penetration into the first layers. Therefore, it is important to choose two materials with high index contrast and low absorption. On the other hand, due to the constraints of the fabrication process the materials have to have compatible transition temperature to allow for co-drawing. A more thorough description of material choice and analysis can be found in [28, 29].
Past research has demonstrated the compatibility of high temperature thermoplastics such as PES and PEI with chalcogenide glasses such as arsenic triselenide (As2Se3) and arsenic trisulfide (As2S3) with the drawing process and has allowed for the
fabrication of 1D-PBG fibers. Though these polymers are compatible with the drawing process and have high contrast index with the chalcogenide glasses, their extinction coefficient is relatively high affecting the performance of the fiber. Using polymers with lower extinction coefficients, such as COC and PC, allows lowering the absorption losses of the fiber.
Polycarbonate is an optical polymer commercially available and used in many applications. Its extinction coefficient at 1.55[tm is over an order of magnitude less than either PES's or PEI's coefficient (Figure 2.5). Since it also exhibits low absorption into the visible spectrum, using polycarbonate creates the opportunity for low-loss fibers with band gaps approaching the UV.
Since polycarbonate has a significantly lower glass transition temperature (Tg=150 C) than either PES (Tg~220'C) or PEI (Tg~230'C), it is no longer compatible to
Loss [db/m]
1.3
0 --2000 -4000 -6000 -8000 1.4 1.5 1.6 1.7 1.8
Wavelength
[urn]
PES
PEI
Figure 2.5: Materials' loss for three polymers- PEI, PES and PC. PC has much lower losses through large part of the spectrum [28].
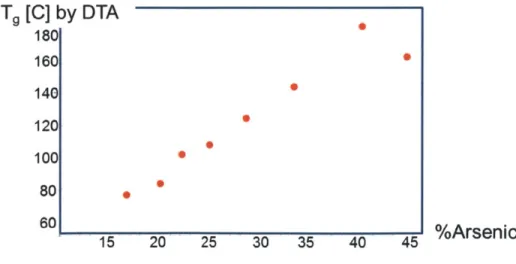
co-draw with As2S3 and As2Se3. Fortunately, it is possible to alter the glass transition temperature without changing the index of refraction considerably, allowing for co-drawing without compromising the optical properties. As can be seen in Figure 2.6 by increasing the sulfur content in As2S3, the Tg of the glass can be reduced sufficiently to
co-draw with polycarbonate, slightly decreasing the glass's index of refraction
(nAs2S3= 2.4, nAs25S75=2.2 7 at 1.55pm). Though we reduce the index of refraction, the ratio between the index of the glass and polymer isn't harmed considerably as the index of refraction of PC (n=1.53) is lower than that of either PES (n=1.61) or PEI (n=1.66) at
Tg [C] by DTA 180 160 140 120 0 100 80 15 20 25 30 35 40 45 %Arsenic
1.55 pm.
Another important aspect of glass used for fiber fabrication is the effect of the fabrication process on the glass composition. Since the specific glass composition is not commercially available we synthesize it from its elemental components (arsenic and sulfur). During this process, the different components are mixed, melted and then quenched to achieve the required glass. To achieve a uniform material, it is important to make sure the elements do not phase separate during any part of the process. Another problematic step is the evaporation step. While evaporating the glass, the different elements can evaporate differently changing the glass stoichiometry. Using tools such as electron microprobe analysis (JEOL JXA-733), thermal gravitational analysis (1 OC min', TA Instruments Q50) and differential scanning calorimetry (10 C min-], TA instruments DSC Q1000) can supply information regarding glass composition during these steps. We have verified that though literature indicates a possibility of phase separation [30] we can see in our tests a single glass transition temperature (Tg120 C) and no crystallization peaks. Furthermore we can see that during the evaporation process the arsenic content increases from As25S75 (+-0.5 mol %) to As2 8S7 2 (+-1.0 mol %). This is not surprising,
since the glass decomposes from the melt into an arsenic rich vapor (As25S7 5-> As4S4 +
S2 [31]) and sulfur gas, which can be pulled from the chamber.
The extinction coefficient of the glass is much lower than that of the polymer [32]. We can determine the extinction coefficient of both glass and polymer using the cutback method. Since the polymer has much higher absorption losses its losses can be expected to dominate the fiber absorption loss.
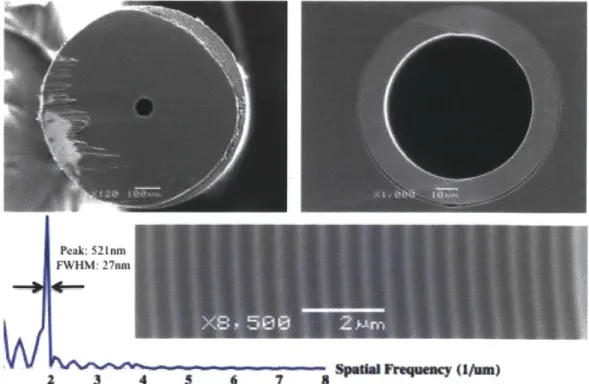
We have demonstrated the low-loss high-power fiber by fabricating a transmission fiber for 1.55 pm and showing transmission of a high-power pulsed laser. The fiber was made with PC and As25S75 bilayers. To verify the layers thickness and
uniformity, a scanning electron microscopy imaging (SEM, JEOL 6060) was used to image the fiber's cross-section (Figure 2.7). The image allows us to use several analysis tools for evaluating fiber quality and properties. By simply reviewing the image, we can see any large defects in this fiber section, such as inclusions, dust, missing section in bilayers or bubbles. Although one cross-section only provides a sample and cannot testify for the lack of such defects in the rest of the fiber, their presence is indicative of a possible problem. Performing a Fourier transform on the image of the layers allows us to not only verify their periodicity and thickness, but to quantify the level of periodicity or the deviation from it (for example revealing chirped structure). The position of the peak in the Fourier transform will give us the bilayer thickness and its width- the deviation from periodicity. A wide peak is indicative of a disordered structure. In the example shown in Figure 2.7, done on a structure with 22 bilayers, the peak reveals bilayer thickness of 521nm (as explained above we expect a bilayer thickness of
Peak: 521mn
FWHM: 27m4
Figure 2.7: Cross-sectional SEM images of a PBG fiber with a 60Pm-core, a 760ptm outer
333+187=510nm) with a full-width at half-maximum (FHWM) of 27nm. The width of the peak is below the resolution of the SEM image- meaning it is proportional to the pixel size, and therefore indicative of a periodic structure.
The SEM image also allows us to measure the fiber diameter and core diameter, in this case: 760ptm outer diameter and a 60ptm core (40k at 1.5pm). Knowing the size of the preform outer diameter and inner diameter, we can now calculate both the draw-down ratio and the NS (the ratio of inner and outer diameter of the preform compared to the inner and outer diameter of the fiber). In this case, the NS is one, indicating maintenance of the original preform structure, or alternatively, a uniform scale down of the preform into the fiber.
After the fiber is drawn, we perform several measurements to analyze its properties. We couple to the fiber using a tunable laser (Ando AQ4321D) coupled to a single mode silica fiber. The output from the silica fiber is a linearly polarized Gaussian beam. Due to its polarization and intensity distribution, we expect this beam to couple to the HE11 mode- the fiber's lowest energy mode (a more detailed explanation of this
coupling will be provided in the next chapter). Any deviation of the output from a pure HEII mode is indicative of inter-mode coupling in the fiber due to bending or defects in the fiber. By eliminating bends in the fiber, we can use the output of the fiber as another
1 I I I I I I I I 0.9- 0.8-0.7- -0.6- -0.5- 0.4 -0.3- -0.2- -
0.1-0 TMO1 HE HE21 TEOl EHi1 EH21 TM02 HE12 HE22 TE02 EH12 EH22
Figure 2.8: The modal content of the first 12 modes at the output of a Im fiber as analyzed using the
modal decomposition technique. The vertical axis represents the coupling coefficient, i.e. the part of the intensity in a specific mode. It is clear the output beam is dominated by the HE,, (more than 95%).
indication of fiber quality. The accurate understanding of the modal content in the fiber is also important for accurate analysis of the fiber losses. Having more than one mode in the fiber necessitates taking into account the different losses of each mode and their propagation through the fiber. We can quantify the deviation from a pure mode at the output and accurately access the modal content at the output using a modal decomposition analysis tool developed in our group [24]. This tool allows us to analyze the images taken in the near and far field of the fiber in two orthogonal polarizations (using linear polarizer) to calculate the modal composition of output beam. An example of an analysis of the 1m long fiber is shown in Figure 2.8. Finally, a pure Gaussian-like mode at the output is important in many applications, especially ones requiring focusing
of the beam at the output.
Once light is coupled to the fiber, it can either propagate in the core, be absorbed in the cladding or radiate out of the fiber walls. Of the three, we can measure the transmitted power and the radiating power to infer the absorption. Propagation loss measures the reduction in power as light travels through the fiber. To measure the propagation loss of the fiber, we use the cutback measurement. In this technique, the fiber is cut several times where each time a power measurement is done at the output. It can be shown that the loss is then proportional to the differential of the logarithm of power with respect to the fiber length. This technique is used as it eliminates any dependence on the coupling efficiency into the fiber, leaving only the propagation losses. To measure our fiber, we have held a 2m section of the fiber straight and cutback five times to 1m long fiber. Since we are using a tunable laser, we can measure the loss of the fiber along the entire bandwidth of the laser (between 1520-1620nm for Ando laser). The losses measured were from 2-3 dB/m, with a minimum loss of less than 2dB/m at 1560nm. The propagation losses are a significant improvement over previously published work of 5.5 dB/m for a 160pm-core fiber [22].
To measure the power radiating from the fiber, we use an integrating sphere and a detector. The fiber goes through the sphere allowing us to measure any light radiating from the fiber through the cladding inside the sphere. By moving the sphere along the length of the fiber, we can see how this power changes. A match between the change of the radiated power and transmitted power indicates very small absorption loss (as all the
power not transmitted through the fiber is radiating out). This means that the main loss mechanism is scattering rather than absorption due to imperfections in the fiber, such as surface roughness and particles. These imperfections account for the large difference between the theoretical loss, taking into account materials absorption and layers confinement, and practical loss, two orders of magnitude greater.
Finally, we have used the fiber to transmit high-power laser pulses. For these measurements, a laser source delivering 1-ps, 50pj pulses at 100kHz centered at 1.552ptm (USP, Raydiance Inc.) was used. To allow gradual increase in the input power, a half-wave plate and polarizing beam-splitter were used. Though any misalignment allowing the beam to reach the cladding might cause failure (as the materials have much lower breakdown threshold than the fiber), no protection was used at the input facet such as pinhole. Instead, the alignment was done with low power and the power was increased only after alignment was achieved. This technique requires high quality cut of the fiber to minimize any chance of interaction between beam and material and high-quality alignment. The output of the fiber was measured using an optical spectrum analyzer, an autocorrelator and power meter. Failure occurred at the end-facet at 12.7pj, corresponding to a peak power of 11.4 MW and an average power of 1.14W. Since the HE,, mode of a 60tm core fiber has a mode field diameter of 35ptm, this power corresponds to a power density of 1.2 TW/cm2 in the fiber core. The input and output
Power (AU)
1.0
0
0
- USP laser
-o' Fiber output (1uj) -- Fiber output (7uj)
Time (ps)
-15 -10 -5 5 10 I5
Figure 2.9: Temporal trace of the fiber output and input pulse as a function of input power
pulse can be seen in Figure 2.9. As can be seen, there is a slight broadening of the pulse, a result of dispersion measured to be 9.6 ps-nm/km (OVA-Luna). These results are higher than previously measured results of 2.4MW for air-silica PCF fiber around 1.5pm, measured at atmosphere, using 11 0-fs pulses and a 12.7pm core fiber [18].
2.4 Conclusions
One dimensional photonic band gap fibers have been shown to be a versatile platform, useful in many applications. Their hollow core allows transmission of light with very little effect of materials properties such as absorption, dispersion and nonlinearities,
and the confinement of light due to structure properties allowing a high level of control over fiber properties using simple design tools.
We have reviewed a few simple design rules allowing control over the fiber's properties. Choosing the layers' thickness and materials allows control over the width and position of the band gap which allows confinement of the light to the core. Core size will determine the fiber losses and level of interaction with the cladding materials, but it will also determine such properties as inter-mode coupling and the fiber sensitivity to irregularities such as bending and defects. Using the scalability of the photonic crystal structure, we can easily implement these rules and our limitation in practical application of these rules.
The fabrication of the fiber uses the classic draw technique of silica fibers to make the most of the scalability of the 1D-PBG fiber, allowing fabrication of a scaled up preform and its subsequent draw into the fiber. We have shown how various control parameters during the fabrication process affect the quality of the fiber and allow us to monitor the process along the way to ensure achieving our goal.
Finally we have demonstrated the use of the design criteria, fabrication control and material choice to achieve a fiber that allows propagation of high-power laser pulses. The advantages of the 1D-PBG fiber in such an application, combined with our choice of a new set of low absorption matched materials enabled us to demonstrate the transmission of 11.4MW in the fiber before its failure - a value much higher than the damage threshold of the materials used in making this fiber. This achievement not only highlights
the advantage of this type of fiber in new applications but also emphasize our ability to use our understanding of the different mechanisms behind fiber operation to help fabricate a fiber for a specific application.
3 Controlled Coupling
3.1 Introduction
Though we have shown how we can control the design and fabrication of a fiber to achieve a desired goal, this control extends only to the structure of the fiber and its derived properties. For example, as mentioned above, once the core size is determined, the number of modes supported by the fiber and the distance between them (the wave vector differences) are determined. Though these properties cannot be changed, we can still achieve a higher level of control of the optical properties by directly controlling the modes traveling through the fiber.
Multimode waveguides have been used for many applications since first introduced almost a century ago. A large core, which supports many modes, has many advantages when it comes to applications, such as high power transmission (see previous chapter) and guiding matter (i.e. atoms, molecules) [33, 34], but is more sensitive to inter-mode coupling and fiber defects and deformations (as explained in 2.2.3). The population of eigenstates in such waveguides is affected by coupling due to structural perturbations which results in random output. A controlled coupling and transmission of modes has many advantages. Such control allows use of large core multimode fibers, while still allowing a close knowledge and control over the mode population at the input, through the fiber and at the output of the fiber. Among the advantages is an ability to accurately control the coupling and transmission of a specific population of modes in a fiber in order to produce a long (macroscopic) waveguide along which there is a well-known field distribution. An example of one such possible distribution is shown in Figure 3.1. In hollow core fibers, this can be beneficial to many applications that study or use light-matter interactions. Moreover, there are many applications that necessitate the use of a specific mode: tight focusing, requiring azimuthally or radially polarized beams, blue or red detuned atom guiding, or even information transmission.
Figure 3.1: Calculated intensity distribution of a coherent superposition of four low energy eigenstates of
the fiber demonstrating the ability to generate three dimensional field patterns inside the hollow core. The red and blue regions correspond to surfaces in which the intensity drops to 1/4 and 1/20 of its maximal value, correspondingly [35].
Many techniques that allow some controlled excitation of waveguides have been studied: from simple mode filtering, applied as early as the 1970s for hollow metallic waveguides [36, 37], to more sophisticated techniques using spatial light modulators or polarization masks, applied for hollow photonic band gap fibers and multimode silica fibers [38,40]. These techniques can be passive or active. Passive techniques aim at a specific mode or mode population and design an optical component or setup to try and achieve said mode. An example for a passive technique is controlled coupling using a polarization mask [40]. Active techniques are based on optical means that can be easily and quickly changed to allow flexibility in coupling to different modes as required. For example, an active coupling can be achieved by using a spatial light modulator [38, 39]. Previously studied techniques for preferential coupling vary in method and means; some, such as fiber bends or fiber gratings, use fiber deformation to achieve preferential inter-coupling within the fiber [41, 42]. Some alter the input beam to achieve match to the desired mode in amplitude, polarization and phase.
In the following chapter, we will cover two techniques for controlling the population of modes in a waveguide. Though we demonstrate both techniques using a hollow core photonic band gap fiber, many of the principals of these techniques are in no way limited to this type of waveguide. Both techniques are based on extensive knowledge of the fiber modes and their intensity profiles, polarization and optical properties. The
understanding of the eigenstates of the fiber allows us to accurately predict the coupling of the beam to the fiber eigenstates, their propagation through the fiber, and the analysis of the output.
We will first explain the theory behind preferential coupling and propagation pertaining to both projects in section 3.2.
The first technique described in section 3.3 is an active technique. In this technique, a spatial light modulator is used to alter the input beam before it is coupled to the fiber to allow preferential coupling to a variety of eigenstates and to the desired superposition of states. The use of the spatial light modulator allows flexibility in choosing the desired output dynamically. A method developed in our group by Dr. Ofer Shapira allows us to fully analyze the content of the output of the fiber to realize the exact mode population.
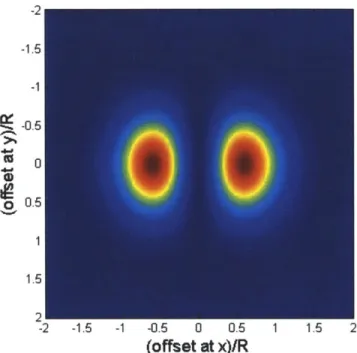
The second technique, described in section 3.4, is a passive technique. A short section of fiber is used to produce a specific desired mode, the azimuthally polarized low loss TEO, mode, by offsetting the fiber with respect to the input beam. We then demonstrate a single-mode propagation of the achieved mode in another long multimode fiber.
3.2 Theory
To fully understand the relationship between the input beam that we couple into the fiber, and the fiber's output, we need to understand two processes: the coupling process in which the input beam couples to the fiber eigenmodes, and the propagation process- in which those eigenmodes propagate through the fiber. To simplify this discussion, we will assume a perfect fiber without any defects or bends where the propagation of the modes is only affected by the modes' radiation losses and velocities.
The efficiency of the coupling between an input beam and the fiber eigenmodes can be measured using the coupling coefficient [43]: qe = - f (E* x H' + H*t x E') -idA, where %, is the coupling coefficient, N is a normalization factor, Et is the transverse
component of the electric field, and Ht is the transverse component of the magnetic field, and A is the infinite cross-section. Since the fields in the fiber are a linear sum of the
eigenmodes of the fiber, we can also represent the coupling coefficient as a linear sum of the coupling to each of the eigenmodes. More specifically, this means that if the electric and magnetic field vectors of the nth waveguide mode are Wp'(r) and qpf(r) respectively, then any field in the fiber can be written as: E(r) =
En
cncp(r) and H(r) =En
cncp (r), where {cn} are the expansion coefficients. We can now write the coupling coefficient as ijc = En c, -A (cp* x H' + qp* x E') -dA) = n c where y is the coupling coefficient between the input beam and the nth mode. The cross product in the integrand means that in order to get the highest coupling efficiency between the input beam and any superposition of eigenmodes, we need the vectorial fields to match in intensity, phase and polarization.After coupling the beam to a desired superposition of eigenmodes, the eigenmodes will propagate through the fiber. Each of the eigenmodes has different radiation loss and different axial wavevectors and therefore will propagate differently through the fiber. If, at the input, we started with a specific population of the modes: {cn}, meaning the electric field will be: E (r) =
En cnqp
0 (r), where here qpO (r) standsfor the electric field of the nth mode at the input of the fiber, then, after propagating a distance 1, the field will have the following form:
E(r) = En cn Vp (r)eikz,nl = En cn7 pn (r)e-(Pn-in1 =n Ycpnq (r)e-inleSnl Here kz,n is the axial wavevector of the nth mode. The axial wavevector has an
imaginary part that is proportional to the radiative loss of the mode, an=2Im kz,n}=26n.The real part of the wavevector is denoted
S.
We can now look again at the mode population at distance 1 and note that though all the modes still exist in the population, their coefficients can now be written as {cne -n1 e - 8}, meaning that the relative weight of the modes in the population has changed.We have assumed a perfect fiber with no perturbations but in practice there is another important effect in mode propagation that needs to be addressed: inter-mode coupling. In a multi-mode fiber any fiber deformation, i.e. defects, bends etc., might cause coupling between the propagating mode and other modes. Since we aim to couple to a specific set of modes, it is important to understand how to avoid or minimize this effect. The exact coupling properties are dependent on the exact nature of the
perturbation and require complicated calculations, but a good approximation for the power coupled from one mode to another can allow many practical solutions [24]. The power coupled from the nth mode to the n'th mode is proportional to A/I,, where A,,,n=,pn-#3n, is the mode separation. The mode separation is, in turn, proportional to the fiber core radius R: A/I R-. These relations mean that the smaller the fiber core, the less sensitive the fiber will be to perturbations and the less likely inter-mode coupling will occur. It is important to note that the smaller the core, the less modes are supported by the fiber; when aiming to couple to higher-order modes, we need to check that they are still supported by the fiber. We can use the same scaling laws to calculate the minimum bend in order to prevent inter-mode coupling due to bends. Defects and fiber imperfections cannot be avoided, but it is straightforward in a practical setting to check for the effect of such imperfections on inter-mode coupling. This can be done by coupling to the fiber with a Gaussian beam, which will in turn couple to the Gaussian-shaped HE1 mode; and by making sure the same mode is achieved at the output, which indicates no inter-mode
coupling has occurred in the fiber.
Understanding the change in the modes population as the light propagates is important both in order to deduce the relationship between the input and output of the fiber and also in order to allow more relaxed conditions on coupling itself. This change means that no matter how well the input beam matches a desired specific superposition of the modes, the output beam will not match the same superposition. On the other hand, we can utilize this change in order to couple with a beam that is not a perfect match to the desired superposition and receive the desired output, nonetheless, by using the fiber as a filter of unwanted modes. This concession only works if the modes we wish to filter have higher losses than those we wish to maintain.
In both projects described in the next sections, a special focus is given to two fiber modes, the TEOi and the HE1. These modes are known for cylindrical symmetric waveguides, such as the one dimensional photonic band gap fiber (1D-PBG fiber). As a side note, we will mention that the fibers we have used in our experiments had a spiral cross-section breaking the cylindrical symmetry. This break of symmetry has some effect on the modes characteristics, which will be discussed in detail in Chapter 4. For the purpose of the controlled coupling techniques described ahead, these changes have a