HAL Id: hal-02299667
https://hal.archives-ouvertes.fr/hal-02299667
Submitted on 27 Sep 2019HAL is a multi-disciplinary open access archive for the deposit and dissemination of sci-entific research documents, whether they are pub-lished or not. The documents may come from teaching and research institutions in France or abroad, or from public or private research centers.
L’archive ouverte pluridisciplinaire HAL, est destinée au dépôt et à la diffusion de documents scientifiques de niveau recherche, publiés ou non, émanant des établissements d’enseignement et de recherche français ou étrangers, des laboratoires publics ou privés.
Distributed under a Creative Commons Attribution - NonCommercial - NoDerivatives| 4.0
Co-ordinated studies in view of the future round of
multilateral trade negotiations in the agriculture and
food sector. Final consolidated report
Chantal Le Mouël
To cite this version:
Chantal Le Mouël. Co-ordinated studies in view of the future round of multilateral trade negotiations in the agriculture and food sector. Final consolidated report. [University works] Inconnu. 2001, 548 p. �hal-02299667�
FAIRs-CT97.348I
f'Co-ordinated
Studiesin View
of theFuture Round
ofMultitateral
Trade
Negotiationsin
theAgriculture
andFood Sectoril
INRA
.
EcoNoMIE
BIBLIOTHEQUE
Rue Adolphe
Bobierre
cs
6110335011 RENNES CEDEX Tét. 02.23.48.54.08
F'INAL CONSOLIDATED REPORT
Chantal
LE MOUEL
(co-ordinator)
INRA-Economie
et SociologieRurales,
RennesSeptember 2001
participants:
INSTrrur
NATIONAL DELA
RECHERCHEAcRoNoMIeuE
(France), ESR, RennesINSTITUT NATIONAL DE
LA
RECHERCHEAGRoNoMIeuE
(France), ESR, Grignon UNTVERSITY oF BONN (Germany), Institute for Agricultural policy(IAp)
UNTVERSITY OF READING (United Kingdom), Centre for Food Economics Research (CeFER)
V/AGENINGEN AGRICULTURAL UNTVERSITy (The Netherlands)
UNIVERSITY OF ROME "La Sapienza" (Italy), Dipartimento di Economia pubblica
INSTITUT NATIONAL DE
LA
RECHERCHEAcRoNoMIeuE
(France), ESR, ToulouseDOCUlllEliTATIOlll ECOI'IOl|il|E RUMLE REt'|t'lE$
FAIR5.CT97.348I
rf
Co-ordinated
Studies
in View
of theFuture Round
ofMultilateral
Trade
Negotiationsin
theAgriculture
and tr'ood SectorrtF'INAL CONSOLIDATED REPORT
Chantal
LE MOUEL
(co-ordinator)
INRA-Economie
et SociologieRurales,
RennesSeptember 2001
participants:
INSTITUT NATIONAL DE LA RECHERCHE AGRONOMIQUE (France), ESR, Rennes
INSTITUT NATIONAL DE LA RECHERCHE AGRONOMIQUE (France), ESR, Grignon
UNTVERSIIY OF BONN (Germany), Institute for Agricultural Policy (IAP)
UNryERSITY OF READING (United Kingdom), Centre for Food Economics Research (CeFER)
WAGENINGEN AGRICULTURAL UNIVERSITY (The Netherlands)
UNTVERSITY oF ROME "La sapienzÀ" (rtaly), Dipartimento di Economia Pubblica
Content
PREFACE
INTRODUCTION 1
1 - MATERIAL AND METHODS... 9
1.1. The database on tariffs, tariff-rate quotas (TRQs) and trade (chapter 2)...9
1.3. The decoupling issue (chapter 4)... t2
1.4. Assessing the world market environment: The
WATSM
model (chapter 5)... 131.5. MECOP:
A
modelof
the
EU's producing sectorof
cereals, oilseeds and protein crops (chapter 6)...1.6. A model of the EU's dairy and beef producing sector (chapter 7) L6
1.7. A spatial equilibrium model of the EU's dairy industry (chapter
8)...
... 181.8. A model of the EU's beef producing sector (chapter 9)... T9
1.9. A software for depicting the regional market of an Appellation of Origin (chapter 10)...20
1.10. Assessment of the impact of food quality and safety standards on EU-US trade in agricultural
and foodproducts (chapter 11) 22
1.11. Non-tariff barriers and market failures: Risk and informational aspects (chapter 12) ...25
2 - THE DATABASE ON TARIFFS, TARIFF-RATE QUOTAS (TRQs) AND TRADE 29
2.1.Inhoduction
2.2.The content of the database on tariffs and trade 30
2.3. Modalities adopted and sources used for constructing the database
3l
2.3.1. Modalities and conventions adopted
3l
2.3.2. Sources used... ..32
29
2.3.2.2. The United States ... 33
2.3.2.3. Canada and other countries.. 2.4.The dataset on tariff-rate quotas 33 2.5.
A
thorough assessmentof
the implementationof
market access disciplineof
the Uruguay 33 Round 3.3.2.1. Empirical implementation of the rates of change in the TRI... 3.3.2.2. Empirical implementation of the rates of change in the MTRI 2.5.1. Technical arrangements madeit
possible to minimise the constraints that resulted from UR market access commitments .... 342.5 .2. Implementation and management of TRQs ... 37
2.6. Conclusion: Lessons for the Millenium Round ...40
3 - MARKET ACCESS INDICATORS... 43
Assessment and comparison of tariff structures chosen by the European Union and the United States under the Uruguay Round Agreement on Agriculture ... 43
3. 1. Inhoduction ... ...43
3.2. Available measures of trade restrictiveness: A review 44 3.2. 1. krcidence measures 44 3 .2.2. Outcome-based measures 46 3.2.2.1. Trade intensity measures ...46
3.2.2.2. Measures based on the equivalence among hade barriers... 47
3.2.3.The TRI and the MTRI... 49
3.2.3.1. The TRI. 3.2.3.2. The MTRI.... 52
3.2.3.3. Rates of change in the TRI and MTRI... 53
3.3. Empirical implementation of the TRI and the MTRI... 55
3.3.1. Empirical implementation of the MTRI in absolute terms... ....55
3.3.2. Empirical implementation of the rates of change in the TRI and the MTRI...57
49 ...57
3.3.3. Data and parameters 59
3.4. Empirical results for the EU and the US
6t
3.4. 1 . Three altemative tariff reduction schemes 61
3.4.2.lmpact of the Uruguay Round and counterfactual scenarios: Analysis
in
terms of TRI andMTRI rates of change... 62
3.4.3. Impact of the Uruguay Round and counterfactual scenarios: Analysis in terms of changes in MTRIlevels... 66
3.5. Conclusion: Discussion and policy recommendations 70 3.5.1. Howreliable are the a-theoretic indicators?. ..70
3.5.2. Policy implications,... APPENDD(. Sensivity analysis 73 77 4 - MEASURES OF INTERNAL SUPPORT 79 4.1. Introduction ...79
4.2. Decoupling agricultural income support: Economic
issues...
...824.2.L.
The
efficiency
argumentfor
decoupling agriculturalincome
support:A
graphical illustration 83 4.2.1.1. The guaranteed market price: Coupling and induced marketdistortions
...854.2.1.2. The production subsidy: Coupled to production only and less market distorting...85
4.2.1.3. The production quota-subsidy: A decoupled instrument? ... 87
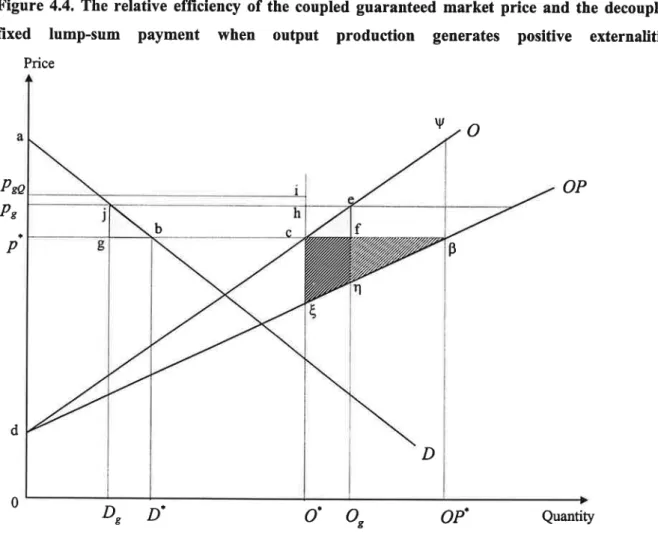
4.2.1.4. The fixed lump-sum payment: effrcient and "decoupled"... 89
4.2.2.In practice, income support policy instruments are never fully decoupled...91
4.2.2.1. The fixed lump-sum payment and the individual decision to stop producing: The "cross-subsidisation" effect 91 4.2.2.2. The fixed lump-sum payment and labour decisions of agriculttral households ...93
4.2.2.3. The fixed lump-sum payment and investment
decisions...
...944.2.2.5. The question of the measurement of the degree of decoupling of income support policy
instruments 95
4.2.3.Decoupling income support policy instruments: The limits of the efficiency argument
in
asecond-best world... ... 96
4.2.3.I. The fixed lump-sum payment and the marginal cost of taxation 96
4.2.3 .2. The fi xed lump-sum payment and extemalities...'. 97
4.2.3.3. Decoupling agricultural income support instruments in a multi-output, multi-instrument
framework.. 99
4.3. Are the green box decoupling criteria for direct payments to producers well-designed: Taking into account adjustments on the land market and/or in the number of farmers... 102
4.3.1. The key role of factor mobility assumptions ... 103
4.3.3.1. The theoretical model 103
4.3.L2. Comparative static analysis ... 107
4.3.1.3.Factor
mobility and
the
greenbox
decouplingcriteria
for
direct
payments toproducers
4.3.2.T1rc key role of adjustments on the land market and in the number of farmers ... 111
4.3.2.1. The theoretical model ... 1 12
4.3.2.2.The impact of income support policy instruments on
trade...
... 1154.4. Promoting multifunctionality while minimising hade distortion effects: The relative merits
of
traditional policy instruments ... 120
4.4.1. Comparison
of
the
effectsof
alternative agricultural income support programsfor
aconstant budget cost/income support...
t22
4.4.2. Classification
of
the alternative income support programs accordingto
their ability toachieve the four policy objectives ,.,....'.,...,.,,.,., |26
4.5. Conclusion and policy recommendations ... r28
APPENDD( 1. Comparative statics of the model of paragraph 4.3.1
...
...'...'...132 APPENDD( 2. Comparative statics of the model of paragraph{.32 ...1335 - ASSESSING THE DEVELOPMENT OF THE WORLD MARKET ENVIRONMENT...137
Simulating the impact of further trade liberalisation on world agricultural markets using the ...I37 5. 1. Introduction ... 137
5.2. The WATSIM Modelling system: The WATSIM Data Base... ...138
5.2.1. The
WATSM
non-Spatial Data Base... 1395.2.1.1. Data sources ...139
5.2.I.2. Data processing...
t40
5.2.2.TheWATSM
Spatial Data Base ... 140140 5.2.2.2. Consistency adjustment ... ...r42 5.2.2.3 . Results of the consistency calculation ... ...t47 5.3. The
WATSM
modelling system: The simulation model 150 5.3. 1. Overall concept... ...1505.3.2. Representation of regional gross trade 153 5.3.2.I. Derivation of model equations ... 155
5.3.2.2. Derivation, estimation or "guestimation" of parameters?... 5.3.2.3. Regional exceptions.. 158 ...159
5.3.3. Representation of policy instruments 160 5.3.3.
l.
Market access .. ...1605.3.3.2. Domestic support... 164
5.3.3.3. Export subsidies.... ...165
5.3.4. Technical realisation... ...165
5.4. Likely Medium-Term Developments on Agriculttnal World Markets: The
WATSM
Reference Run 5.4. 1. Basic assumptions ...t66 5.4.2. Likely developments on agricultural markets ... ...1675.4.2.1. Grains ... 167
5.4.2.3. Meat... 181
5.4.2.4.
Milk
and dairy... 1855.4.3. The WATSIM reference run under an alternative assumption on the degree of decoupling
of
area and headage payments in the 8U... 189
5.5. The impacts of furttrer liberalisation of agricultural markets... 193
5.5.
l.
The'WTO scenario 1935.5.2. Impacts of further liberalisation on agricultural markets ... 194 5.5.3. The
WTO
scenario underthe
assumptionof
partial de-couplingof
area and headagepayments in the EU 195
5.6. Conclusion and policy recommendations ...196
APPENDX
1. Sensivity analysis: Sensitivity of the model outcomes with respect to the valuesof
the elasticities of substitution and of
transformation...
...200APPENDX
2.
Aggregate results of the WATSIM reference run... 2036 - MECOP: A MODEL OF THE EU'S PRODUCING SECTOR OF CEREALS, OILSEEDS AND
PROTEIN CROPS... 214
6.1. Introduction
..2t4
6.2. Theoretical framework
6.2.1. Preliminaries: The duality theory under allocatable quasi-fixed factor 6.2.2.The theoretical structure of the MECOP model
6.2.2.1. The first stage ...
6.2.2.2. The second stage...
6.2.3. Miscellaneous by-products of the MECOP model...
6.3. Estimation framework: The Generalised Maximum Entropy
6.3.1. The Generalised Maximum Entropy approach....
6.3. I . 1. Principles of the Maximum Entropy...
6.3.1.2. The Generalised Maximum Entropy
...222
2t7
22r 221 225 227 229 ...227 228 6.3. 1.3. Discussion... 2316.3.2.Implementation of the Generalised Maximum Entropy for the MECOP model 233
6.3.2.1. The set of estimated equations.... ...233
6.3.2.2. The choice of support values for parameters and disturbances 234 6.4. Estimation results ... ...23s 6.4.1. Application to France ...236
6.5. Policy simulations: The Agenda 2000 CAP reform and
beyond
...2426.5.1. Background and motivation ...242
6.5.2. Definition of simulated
scenarios...
...2456.5.3. The likely impacts of the Agenda 2000 CAP reform: The central scenario...247
6.5.4. Sensivity analysis: The sensivity
of
the Agenda 2000 simulation resultsto
the assumed evolution of market prices and the set-aside rate ... ...2546.6. Conclusion and policy recommendations... 257
APPENDD(. Estimation results for the United Kingdom, Germany, Italy, Spain and Denmark....260
7 - A MODEL OF THE EU's DAIRY AND BEEF PRODUCING
SECTOR....
...2737.2. A tool for simulating dairy policy reform... 275
7.2.1. Philosophy of the model 275 7.2.2. Ovewiew of the model 276 7.2.3. Description of the behavioural
model
...2807.2.3.t. Variable inputs and outputs 280 7.2.3.2. Adjustment of quasi-fixed
factors
...28I
7.2.4.Policies that can be simulated with the model.. ...2817.3. Specification and estimation of the
mode1...
...2827.3.1. Parameterisation of the model... ...283
7.3.1.1.
hofit
function and netputequations....
...2837 .3.1.2.
Milk
supply response... 7 .3.1.3. Quasi-fixed factors ...2837.3.2.Estimation of the equation system by mixed estimation
7.3.3. Prior information
7.3.3.1. Beef supply
7.3.3.3. Rationale for the elasticity decomposition ...
7.3.3.4. Priors for other parameters 7 .3.4. Data: Definitions and sources
7.3.5. Estimation and results
7. 3.6. Specialist dairy farm submodel ...
7 .4.3.3. Simulation results: Agenda 2000... 7.4.4. Simulations: Agenda 2000 plus quota abolition
7.4.4.1. Background..
7 .4.4.2. Quota abolition scenarios
7 .4.4.3. Simulation results: quota abolition ...
7.4.5.lmpact of scenarios on specialist dairy farms... 7.5. Discussion and conclusions
7.5.1. Technical discussion of model simulations
...288 ...289 ...325 286 291 293 302 322 32s 330 .,,,.,,,,293 299 304 7 .4. Policy simulations .... 305 ...30s
7.4.2.Modelling direct
payments
...3077 .4.2.1. The policy issue... ...307
7 .4.2.2. Supply behaviour.. 308
7 .4.2.3 . Policy changes regarding dairy... 310
7.4.2.4. Policy changes regarding beef and
vea1...
...3127.4.3. Simulations: Agenda 2000 ... 319 7.4.3.1. Background 319 7 .4.3 .2. Agenda 2000 scenarios... 321 ...329 ...334 ...33s ...33s
7.5.2.1. Decoupling 336
7.5.2.2. Yield growth 337
7.5.2.3. Quota rents 338
7.5.3. Policy conclusions 338
APPENDD( 1. Background
tables...
...340APPENDD( 2. Simulation results: Agenda 2000... 344
APPENDX 3. Simulation results: Agenda 2000 plus quota abolition
3sl
8 -A
SPATIAL EQUILIBRIUM MODEL OF THE EU's DAIRYINDUSTRY
...3638. 1. Introduction ... ... 363
8.2. The spatial model of the EU dairy industry.. 364
8.3. Policy simulations 367 8.3. I . Definition of simulated scenarios... ...367
8.3. 1. 1. The reference scenario.... 8.3. 1.2. Policy reform scenarios .. 367 ... 368
8.3.2. Simulation
results
...3698.4. Conclusion and policy recommendations... APPENDD( 1. description of the Spatial Equilibrium model with Component A11ocation...379
APPENDD( 2. Assumptions on supply and demand elasticities and on initial quota rents ...382
9
-
ECONOMETRIC MODELS OF BEEF PRODUCING SECTORSIN MAIN
EU MEMBER STATES ... 3849.1. Introduction 384 9.2. National models of beef and veal sectors: Structure and main characteristics...385
9.2.1. Demographic structure: An
illustration...
...3869.2.2.lmpacts of economic and policy variables ... ... 386
9.3. Estimation results ... 389
9.3.1.1. Calf crop models .389
9.3.1.2. Models of female animals older than one yeat... ...390
9.3.1.3. Models of male animals older than one year... 391
9.3.2. Dynamic elasticities ... ... 393
9.3.2.L Elasticities to the number of male
premiums
...3949.3.2.2. Elasticities to the number of suckler cow
premiums...
...3969.3.2.3. Elasticities to the intervention price 397 9.4. Policy simulations 399 9.4.1. The baseline scenario: The impacts of the Agenda 2000 reform 399 9.4.2.The restrictive premium scheme scenario: The impacts of a -20o decrease in the number
of
premiums granted... 4009.5. Conclusion and policy recommendations 402 APPENDD( l.Structure of the national models 403 APPENDD( 2. List of the exogenous variables 405 APPENDD( 3. Estimation results... 406
10 .
A
SOFTWARE FOR DEPICTING THE REGIONAL MARKET OF AN APPELLATION OFORIGIN 422 422 424 425 426 427 428 430 43r
43t
432 10.1. Introduction10.2. Regulation and quality reserve...
10.3. A simulation model
1 0.3. 1 . The reference situation: Free marketing...
10.3.2. Regulation of supply....
10.3.3. The demand side...
10.3.4. Optimal decision on drawing...
10.3.5. The developed software....
10.3.5.1. The law of agronomic performances... 10.3.5.2. The law of grape quality
10.3.5.3. The transition matrix 433 10.3.5.4. The basic structure of the software
10.4. Simulation of a Northern
vineyard...
...43410.4.1. The reference situation ...434
10.4.2. The simulated scenarios 10.4.3. Simulation results.... 436
10.5. Conclusion: CMO-WTO compatibility.. ...437
11
.
ASSESSMENT OF THE IMPACT OF FOOD SAFETY ANDQUALITY
STANDARDS ON EU-US TRADE IN AGRICULTURAL AND FOOD PRODUCTS... 4391 1. 1. Introduction .... 439
I 1.2. Technical barriers to trade
llz.l.
Background 439 lL.2.2. Technical barriers to tade: Definition and classificaton... ..,.,...,,.441:439 11.2.3. Understanding the impact of technical measures on trade 11.2.4. Measuring the impact of technical measures on trade 443 450 II.2.4.1. Frequency/inventory-based
measures
...450I L .2.4.2. Price-comparison measures ... 451
I 1.2.4.3. Quantity-type measures ...4s2 11.2.4.4. Compliance cost-based
measure...
...45211.2.5. Legitimacy of non-tariff
measures...:...
...4541I.2.6. The impact of technical barriers to trade: Empirical evidence... 455
11.3. Frequency of US technical measures on agricultural and food
products
...45911.3.1. The inventory database: A comparison of EU and US regulatory profiles 460 11.3.2.
The
frequencyof
technical measuresby tariff
line
(HS-02)using
the
UNCTAD's Database ,..,...,,... 469I I .4. Estimation of tariff-rate equivalents ... ..474
11.5.1. Theoretical
basis...
...47811.5.4.4. Border
procedures.
...49911.5.2. Survey of EU agricultural and food
exporters....
...482| 1.5 .2.1 . Nature of respondents ... 482
I | .5 .2.2. Main characteristics of respondents ...483
I 1.5.3. Survey results: Problems exporting agricultural and food products to the US...487
1 I .5.3. I . The importance of technical requirements relative to other factors influencing exports to the US ...487
11.5.3.2.
The
importanceof
technical requirementsin
the
US
relative
to
other
export markets ...49r 11.5.3.3. The awareness of exporters about US technical requirements... 49311.5.4. Survey results: costs of compliance with US technical requirements...494
11.5.4.1. Prior approval of production facilities 494 11.5.4.2. Product reformulation and/or change in production, packaging and labelling...497
11.5.4.3. Impact on production costs... 498
11.6. Analysis of US detentions of agricultural and food exports from the EU...504
1 1.7. Conclusions and policy recommendations ...509
12 -THE ECONOMICS OF NON.TARIFF BARRIERS. ...512
12.1. Introduction 512 12.2. Trade liberalisation and market failures ... 12.2.1. Trade liberalisation and imperfect competition 12.2.2. Trade liberalisation and risk... ....515
515 517 12.2.3. The importance of informational aspects 518 12.2.4. An economic assessmenVdefinition of non-tariff barriers: The case of the EU-US hormone-treated beef dispute 520 12.2.5. An emphasis on welfare analysis ,,,...52|
12.3.1. Voluntary versus mandatory certifi cation s25
12.3.2.Is labeling a way to solve market inefficiencies resulting from trade liberalisation?..,...,..525
L2.4. An assessment of the US system of food safety regulation and the possible outcome of V/TO
disputes... 527
12.5. Conclusions and policy recommendations 529
12.5.1. New criteria for defining trade
barriers...
....529L2.5.2. Lessons for the WTO dispute settlement 530
PREFACE
The final consolidated report of the programme "co-ordinated studies in view of the future round
of
multilateral trade negotiations in the agriculture and food sector" is the last deliverable
of
a project which started in March 1998.At
that moment, the common view was that both the commitments agreed uponin
1994, within theUruguay Round Agreement
on
Agriculture(URAA),
andthe next
roundof
multilateral tadenegotiations, scheduled to start by the end of year 1999, would be likely to impose further constraints
on the Common Agricultural Policy (CAP) and require additional adjustments
in
Common Market Organisations (CMOs).This
is in
that context thatthis
programme startedwith
the aimof
co-ordinating a task force working on the preparationof
the coming roundof
multilateral negotiations under the auspices of the World Trade Organisation (WTO).The main purpose
of
the project was to provide a setof
studies,in
connection with policymakers,involving a comprehensive economic analysis
of
the main issuesof
the next roundof
multilateral negotiations, as well as their consequences for the future of the CAP, and quantitative assessmentsof
the likely effects of WTO proposals on the European Union (EU) agriculhre.Such a purpose gave the project a somewhat specific status. On the one hand,
it
was clear since thebeginning that the proposed analyses would be policy-oriented and that the task force involved would work closely with EU decision makers. To this regard, one very positive aspect of the project is that
it
has benefited, during
its
overall lifetime,of
the
sustainedfollowing
and supportfrom the
DG Agriculture. On the other hand, as a FAIR programme, the project should not be limited to market andpolicy expert evaluation but also include genuine research work.
It
was thereforefor all
partners achallenge to develop analyical tools, based on economic theory, which outcomes would be directly useful for EU trade negotiators and decision makers.
The financing by the European Commission has allowed us to design a set of tools and to carry out
work for
makingthem
relevantto
analysethe main
issuesof
multilateral negotiations, theirconsequences in terms
of
CAP reforms and the effects of various policy options for EU agriculture. Provided tools are different in nature. They include databases, synthetic indicators, theoretical models and applied simulation models. The financing by the European Commission also madeit
possible to co-ordinate our effortsin
using these toolsfor
providing policymakerswith
sound economic andpolicy-oriented analyses,
with
a viewto
support trade negotiations and assist planningin
the EU agricultural and food sector.This
consolidated report presents methodologies used, models developed and main findings perresearch task.
Finally, as co-ordinator of the project,
I
want to thank the European Commission for financing thisresearch.
I
hope that the outcome is meeting the expectations and that our results are useful for EUtrade negotiators and policymakers. I also want to express my gratitude to DG Agriculture for the help
and
supportwe
benefitedall
alongthe
project'slife.
I
am
particularly indebtedto
MarinaMastrostefano for her constant following. Her involvement and her active contribution to our meetings
as
well
asto
our work have constituted an invaluable supportfor
the co-ordinatorin
leading this project through to a successful conclusion. Moreover her kindness and her sustained encouragement were a great help for the co-ordinator in doubtful moments.Lastly,
I
would like to thank involved partners. The good finalisationof
this project relies on theirexcellent scientific contributions. I greatly thank all researchers and assistants that have participated to
INTRODUCTION
The background to the FAIRS-CT97-3481 programme
The FAIR5-CT97-3481programme started on the beginning
of
1998.At
that time, the consequences of the basic provisions of the Uruguay Round Agreement on Agriculture(JRAA)
for the EuropeanUnion (tIE) and the Common Agricultural Policy (CAP) were well documented in the literature (e.g.,
Josling and Tangermann, L992; Guyomard and Mahé, 1993; Helmar et
al.,
1994; Guyomard et al.,1996; Swinbank, 1996; Tangermann,1996). And all existing studies agreed that the major consûaint the AAUR would impose on EU agriculture would lie in the export commitments. The commitments
to
reduce domestic supportwould
imposeno
adjustment needson the
CAP
becauseof
theaccommodating heatment
of AMS
(Aggregate Measureof
Support) reductions,in
particular theexclusion
of
1992 CAP reform compensatory payments from AMS computation. In the same way,tariffication
of
border measures and the new access provisionsin
the formof
current access andminimum access tariff quotas would marginally improve the price competitiveness of imports into the
EU over the six-year implementation period.
The common view however was that, although the immediate quantitative effects of the URAA on EU agriculture
would
likely
to
be
modest,its
significance shouldnot be
underestimated.In
fact, "recognisingthat the
long-term objectiveof
substantial progressive reductionsin
support andprotection resulting
in
fundamental reformis
an ongoing process",Article 20
of
the Agreement includes a commitment to engagein
a new round of multilateral agricultural negotiations before theend
of
1999. Thus, the placementof
agriculture on the agendaof
multilateral negotiations and thedefinition
of
a negotiation frameworkin
the formof
three main areas, i.e., internal support, marketaccess and export competition, are two features of major significance of the URAA (Vanzetti, L996\.
Then, at the beginning
of
1998,it
was expected that the next roundof
V/orld Trade Organisation(!VTO) talks (the so-called Millenium Round) would use again the negotiation framework
of
theUruguay Round and that the proponents
of
reform (particularly the United States and the Caimsgroup) would push
for
further commitmentsin
termsof
intemal support reduction, market accessimprovement and export subsidy cut.
In
addition,by
announcing thatall
the support provided tofarmers under the Federal Agriculture Improvement and Reform Act
of
1996 would qualiff for theso-called "green" box, the United States (US) had indicated their willingness to challenge the exemption
of a large share of EU farm support from reduction commitment (the so-called "blue box" issue). On
the other hand, the mandate given
to
the US Trade Representativeby
the Agriculture and Food Consultative Committee suggested that EU intemal regulations relative to competition, norms, qualityFrom the EU perspective,
it
was expected that not only theURAA
commitments would probably require a significant adjustment ofEuropean agriculture around the year 2000, but the next roundof
WTO negotiations would belikely
to
impose further constraints on the CAP, and require larger changesin
Common Market Organisations (European Commission, 1997;FAPRI,
1998; USDA,1998; OECD,1999).
The objectives of the FAIRS-CT9 7-3 48 1 programme
In that context, the aim of the FAIR5-CT97-348I programme was to co-ordinate a task force working on the preparation
of
the Millenium Round. The purpose of the prograrnme was to provide a setof
studies, in connection with policymakers, involving:
- comprehensive economic analyses of the main issues of the next round of multilateral negotiations;
- databases and indicators on trade and tariffs for the EU as well as other major trading countries;
- assessments of the world market environment and prices as well as of the forecasted effects of WTO reform proposals;
-
quantitative assessments of the economic impactof
WTO proposals onEU
agriculture, including simulations on reformsof
Common Market Organisations (CMOs) which could be necessary to comply with these proposals;-
assessmentsof
the effectsof
proposed "regulatory reforms" on theEU
agro-food industry, withspecial attention paid to the trade effects of food standards and food labelling.
More specifically, the following operational objectives have been retained:
1. Assess the ctrrent intemational trade environment, which
will
form the basis of the next roundof
multilateral negotiations.
2. Develop effective measures of trade restrictions, encompassing domestic support as well as tariffs
and non-tariff measures such as food safety and quality standards, and develop effective measures
of
decoupled domestic support.
3. Evaluate the impact of hade reforms on world markets and, in turn, the implications for European
agriculture and the food processing industries.
4. Assess the degree to which food safety and quality standards act as impedance to hade and the
5. Define an appropriate classification
of
Non-Tariff Barriers (NTBs) which assesses the degree to which such measures impede trade and/or actually address market failures, which can be applied toassess the impact of regulatory reforms.
6. Overall, to provide a comprehensive analysis of policy reforms and trade
in
agriculture and foodproducts
within
the European Unionto
support future hade negotiations and aid planningin
theagricultural and food sectors.
Presentation of tasles and subtasks
In order to achieve the above-mentioned objectives, the research has been organised into three tasks,
further divided
into
subtasksto
facilitate effective management. For each taskor
subtask,a
co-ordinator has been appointed who was responsible
for
the methodology, co-ordination and finalanalysis (see Table 1.1).
Table 1.1. Tasks, subtasks and co-ordinators
r
Taskl:
Analysis of the international trade environment for agricultural and food products - Subtask l. I : Development of a database on tade (co-ordinator: partner 2, INRA-ESR Grignon)-Subtaskl.2: Constructing indicators of hade restriction, measures of protection and support, and assessing the consequences of choosing a particular indicator (co-ordinator: Partner 1, INRA-ESR Rennes)
- Subtask 1.3: Assessing the development of the world market environment and world market prices using a revised and updated version of the TRADE model (co-ordinator: partner 3, University of Bonn)
o
Task 2: Quantitative assessments of the economic impact of policy reforms on agriculture and the food sector inthe European Union
- Subtask 2.1: Arable crops (co-ordinator: partner I,II\IRA-ESR Rennes) - Subtask 2.2: Dany (co-ordinator: partner 5, University of Wageningen)
- Subtask 2.3: Beef (co-ordinator: partner l,INRA-ESR Rennes) - Subtask 2.4: W ine (co-ordinator: partner2, INRA-ESR Grignon)
o
Task3:
Effectof
proposed agreementsin
the areaof
regulatory reform on theEU
agro-food industry(co-ordinator: partner 4, University of Reading)
- Stage
l:
Survey of regulatory requirements- Stage 2: Interviews - Stage 3: Postal survey
Additional hackground elements durtng the coarse of the FAIRS-CT97-3481 programme
Since the beginning
of
1998, two main features have marked the background to theFAIR5-CT97-3481 programme. First of all, in March 1999, the EU adopted a CAP reform package (Agenda 2000).
This reform basically extents
the
1992 reform and inhoduces more decouplingin
the systemof
compensatory payments
to
COP (cereals, oilseeds and protein crops) producers. The Agenda 2000reform was largely motivated by EU export commitments under the AAUR and the expectation that these commitments
would
be
strengthenedin
the Millenium
Round (Desquilbetet al.,
1999).However, smoothing the EU East enlargement process and easing CAP budget pressures were also
important concerns supporting the Agenda 2000 reform.
Secondly, in December 1999, the Seattle ministerial conference marked the opening of the Millenium
Round. The first phase
of
multilateral negotiations (which endedin
March 2001) has consistedof
countries submitting proposals containing their starting position for the negotiations. Hence, since the
early 2000, 125 WTO member govemments have submitted 45 proposals from which
it
is possible todeduce the issues that are likely to be the major focus of the second phase of negotiations.
The synthesis
of
the overall received proposals providedby
theWTO
Secretariat (W'TO, 2001)globally confirms the main issues that were expected at the beginning
of
the FAIR5-CT97'3481 programme. On the market access side, furthertariff
reductions should be negotiated, but how thereductions
will
be handledis still
undecided and appears as a major negotiating area.It
is
widelyrecognised that the Uruguay Round (UR) calculated equivalent tariffs were very often too high to allow real opportunity for imports. Hence, the discussion is likely to focus on various ways to define and apply reduction rates,
for
market protectionto
be effectively reduced.I
Regarding tariff-ratequotas (TRQO there are several proposals for either replacing them with low tariffs or increasing their
size, but at the moment the discussion almost turns on quota administration. Many countries advocate
for increased scrutiny of methods used for giving exporters access to quotas. They add that
it
should be clarified which methods are legal or illegal under WTO rules. On the export competition side, asexpected further reductions
in
export subsidies should be negotiated. Currently, some countries propose thetotal
eliminationof
export subsidieswhile
others are preparedto
negotiate further progressive reductions. Finally, on the domestic support side, the received proposals dealwith
the three "boxes". As expected further reduction of "amber box" measures should be negotiated. As in thecase
of
tariffs, how this
additional reductionwill
be
applied seemsto be a
major concern indiscussions. To this regard, some countries advocate that ceilings should be set for specific products rather than having overall aggregated ceilings. Proposals dealing
with
the "green box" areof
threet
Th. US for example proposes that the negotiations to reduce tariffs starts with applied tariffs insteadof
types. Unsurprisingly, some countries push
for
increased scrutinyof
measures currently included,arguing that some of them, in certain circumstances, could have an influence on production and prices.
Others think that the "green box" should not be changed because
it
is
already satisfactory. The lastones argue
for
a broadeningof
the "green box"to
cover additional typesof
measures. Finally, asexpected, some countries want the "blue box" to be scrapped because
it
involves payments that areonly
partly
decoupledfrom
production. Obviously, someother
countries oppose scrappingit
completely and maintain that
the
"bluebox"
is
an importanttool for
supporting and reforming agriculture, and for achieving certain "non-trade" objectives.The synthesis of proposals by the WTO Secretariat points out a certain number of other issues. These
were also expected issues at the beginning of the FAIR5-CT97-348I programme. However, we paid lower attention to them when developing this programme. This is the case of, mainly, the extension
of
the export subsidy discipline to all forms of subsidies (including the effect of state trading enterprises,food aid and export credits) as well as "non-trade" concerns and multifunctionality.
All
these additional background elements, which punctuated the programme's life, did not make us to depart from the original plan. However, they contributed, in the finalisation stage, to bend the work undertakenfor
integrating theminto
our
analyses. Thus, asfar
asthe
Agenda 2000 reform is concerned, we decided when defining the reference runsof
all
developed models, that they should include this CAP change.It
results that, within both subtask 1.3 and task 2, the analyses carried outwith, respectively, the world hade (the so-called WATSIM) model and the EU sectoral models for
arable crops, dairy and beef start
with
an examinationof
the impactsof
the Agenda 2000 reformpackage in each ofthese EU sectors.
Secondly, the proposals submitted by countries to the WTO oriented our work in mainly two areas. On the one hand, they helped us to speciff the policy scenarios to be simulated with the various models.
Hence,
within
subtask 1.3,we
retained, asa
stylised liberalisation scenario,a
policy
scenarioreplicating the main provisions of the URAA, which in view of the submitted proposals appears as a
possible outcome
of
the Millenium Round. Furthermore, as submitted proposals confirm that thedecoupling issue
will
be a major focus of the Millenium Round, this issue being of key importance forthe future of the CAP, we decided
to
integrate the decoupling dimensionin
mostof
our simulated scenarios. Therefore,still within
task
1.3,all
simulated scenariosthat
were originally designed assuming coupled CAP direct payments have been supplemented by alternative scenarios assuming agreater degree of decoupling of these payments. In the same vein, within task 2, some policy scenarios have been defined in order to shed some light on the degree of decoupling of the Agenda 2000 CAP direct payment systems. On the other hand, following the growing debate around multifunctionality in
'WTO submitted proposals, we oriented our last work undertaken on decoupling
within
subtask 1.2towards this issue.
Outline of the report
In chapter
l,
methodologies used for the different subtasks are described. Chapter 2 refers to subtaskl.l
and deals with the database on tariffs and frade. The modalities adopted to construct this databaseas well as its content are first described. Then, a thorough assessment
of
the implementation of theUruguay Round market access discipline is provided. Chapter 3 refers to subtask 1.2 and focuses on
market protection indicators. Using the Trade Restrictiveness Index (TRI) and the Mercantilist Trade
Restrictiveness Index
(MTRI), a
comparisonof
EU
and UStariff
structures before and after the URAA implementation is proposed. This allows to assess and compare the improvementin
market access that was permittedin
both countriesby
the Uruguay Round commitmentson
tariffs. In addition, the effects of the actual URAA commitments are compared to altemative schemes oftariff
reductions such as the "Swiss formula" and the uniformtariff
reduction. This makesit
possible toassess and compare the impact of the uneven allocation of tariff cuts across commodities implemented
by the EU and the US under the URAA. Chapter 4 also refers to subtask 1.2 and is concerned with the
decoupling issue. The first part of the analysis gives an overview of the main advantages and limits
of
decoupling. The second part deals with the "green box" decoupling criteria as defined in Annex 2
of
the URAA. Two theoretical models are developed
in
order to compare the degreeof
decouplingof
various internal income support instruments, and
in
so doing to examine whether the corresponding"green box" decoupling criteria are well-designed. Using an extended version
of
oneof
theabove-mentioned theoretical models, the last part of the analysis addresses the question of the relative merits
of naditional income support instruments as regards to the promotion of multifunctionality. Chapter 5
refers to subtask 1.3 and reports the analyses carried out with the
WATSM
(World Agricultural TradeSlMulation) model. Firstly, a detailed description of the model is provided. Secondly, the reference
run of the model is presented and analysed, emphasising the tikely developments of the world market
environment,
as the
backgroundto
the
Millenium
Round.Thirdly,
the
resultsof a
stylisedliberalisation scenario, as a fictitious outcome of the Millenium Round, are described and discussed.
Chapters
2
and 5 contribute to the first objectiveof
the programme (assess the current internationalhade environment which
will
form the basis of the next round of multilateral negotiations). Chapters 3and
4
are devotedto
the second objectiveof
the programme (develop effective indicatorsof
traderestrictions and develop effective measures of decoupled domestic support). The third objective of the
programme (evaluate
the
impactof
trade reformson world
markets andtheir
implications forEuropean agriculture and the food processing industries) is dealt with in the last part of chapter 5 and
Chapter 6 refers to subtask
2.I
and, reports the analysis carried outwith
the EU sectoral model forarable crops. Chapters 7 and 8 both refer to subtask 2.2. Chapter 7 is concerned with the model of the
EU's dairy and beef producing sector and related policy simulations. While chapter 8 concenfiates on
the model of the EU's milk processing sector and related performed simulations. Chapter 9 refers to
subtask
2.3
and focuses on the analysis carried outwith
theEU
sectoral modelfor
beef. Finally, chapter 10 refers to subtask 2.4 and addresses the question of the welfare effects of an Appellationof
Origin using a software depicting a regional market regulated through an Appellation of Origin. hr all these chapters, the model developed
is
presentedfirst.
Then, the referencerun
of
the model is described and the obtained results are discussed. Finally, alternative simulations performed with themodel are proposed and results are analysed. In chapters 6 to 9, altemative simulations corresponds to
policy
change scenarios, whilein
chapter 10 they involve changesin
some characteristicsof
theregional market considered.
Chapters
1l
and 12 both refer to task 3. The assessmentof
the impactof
technical measures (orstandards) on EU agricultural and food exports to the United-States is the subject of chapter 11. The chapter starts with an analysis and a review of literature centred on the definition and the classification of technical measures, the impact of such measures on hade, the available methods for quantifring this impact and the existing studies devoted to estimate this impact in the context of trade in agricultural
and food products. Then, the impact of US technical measures on EU agricultural and food exports to the US
is
assessed combining various methods. Chapter 12 focuses on the economics of non-tariffbarriers. It proposes several analytical frameworks allowing to analyse the welfare effects of domestic
food quality and safety regulations and to examine their ability to address market failures. A particular
attention is paid to market failures resulting from risk and imperfect information.
Chapter 11 contributes
to
the fourth objectiveof
the programme (assess the degree to which food safety and quality standards hinder trade, and the implications of regulatory reform on trade flows). Chapter 12 relates to the fifth objective of the programme (define an appropriate classification ofnon-tariff barriers that assesses the degree to which such measures impede trade and/or actually address
market failures).
The overall report contibute to the sixth objective
of
the programme (to provide a comprehensive analysis of domestic policies and hade reforms in agriculture and food products in the EU, with a view1 -
MATERIAL
A}ID METHODSAs indicated in the infroduction, the research was divided into three tasks, further divided into eleven subtasks (or stages, as far as task 3 is concerned). In this report, results ofthese eleven subtasks are
reported in chapters 2 to 12. However for purpose of rationalising the presentation, one chapter does
not necessarily correspond to one subtask, even if this is most often the case. In fact, when one subtask
conbibutes to several objectives or, at reverse, when several subtasks contribute to the same objective, results are presented according to the objectives rather than according to the subtask they refer to. As there is an obvious relationship between material and methods used and pursued objectives, applied
methodologies for this project are described following the framework of chapters 2 to 12.
It
is
important to emphasise thatin
next sections, material and methods used are described without going into too much details since further descriptions are provided in each of chapters2to
12.1.1. The database on tariffs,
tariff-rate
quotas (TRQs) and trade (chapter 2)Subtask 1.1 consists
in
the developmentof
a database on tariffs and trade. The database has beenconsfucted
with
the principleof
matchingall
the relevant informationto
each counûry's officialschedule on bound tariffs, as submitted under the URAA.
As a result, the developed database is organised on the basis of the 8-digit Harmonised System (HS) classification, for chapters 01, 02, 03 to 24 (that is, all food products with the exception
of
fisheriesproducts), and for selected items
of
chapters29,31,35,38,
40,41,50,51
and52 (that is, non-food agricultural products, such as skins for leather, etc). This introduced a lot of difficulty for gathering therelevant information, since the list of commodities include some 2800 items.
The database has been constructed for a set of countries, namely Australia, Brazil, Canada, the EU,
Japan, Korea, Norway and the US. Datasets have been ôompleted in a satisfactory way for Canada, the
EU
and
the
US.
For
other
countries, datasets remainedflawed
becauseof
problemsin
the correspondence between the various sourcesof
information.It
was decided then, togetherwith
theCommissionrs representatives,
to
focus on the Canada,the
EU
and the US, andto
provide lesssophisticated data for other counties.
Hence, for Canada, the EU and the US, the constructed datasets include, in addition to the schedules on base (1995) and bound
tariffs
(2000), import values, import quantities,unit
valuesof
imports (under and outof
the Most Favoured Nation status) and applied tariffs,for
each year since 1995.tariff-rate quotas (TRQs) are an important issue in the WTO negotiations, TRQ information have been added to countries' datasets.
For the EU, data sources are mainly COMEXT for import values and quantities, and both the TARIC
and the UNCTAD's TRAINS databases for applied tariffs. Furthermore, obtained applied tariffs were checked against the applied tariffs published in the Official Joumal of the European Communities. For the US, hade and
tariff
data come mainly from the USITC (US International Trade Commission)database, while for Canada most of the data are extracted from the Statistics Canada database. Finally, for all three countries, the main sources for information on TRQS are the
IIRAA
schedules as well asnotifications that were obtained from the WTO Secretariat.
1.2. Market access indicators (chapter 3)
The part of subtask 1.2 devoted to market access is aimed at constructing indicators of frade restriction
and, on the basis of these indicators, assessing and comparing the improvement in market access that
was permitted in the UE and other countries by the IJRAA.
This part
of
subtask 1.2 has been ca:ried out by first conducting a thorough reviewof
literature onavailable methods to measure market protection. Relying on this review, the approach proposed by
Anderson and Neary, which develops theoretically consistent measures in terms of a given criterion
of
equivalence among trade barriers, has been retained. More specifically,
two
indicators have beenretained : i) the TRI (Trade Restrictiveness Index), which corresponds to the uniform
tariff
equivalentin
termsof
welfare
(Andersonand Neary, 1994) and ii)
the MTRI
(Mercantilistic Trade Restrictiveness Index), representing the uniformtariff
equivalent in termsof
imports (Anderson andNeary, 1999), and which might be more relevant regarding trade negotiations.
The second step corresponds to the empirical implementation of the TRI and the
MTRI
in
order toassess and compare the change
in
market accessin
the EU and other countries dueto
the URAA.Because the empirical estimation of indicators such as the TRI and the MTRI is very demanding in
terms of data and parameter requirement, it was decided to focus on the EU and the US.
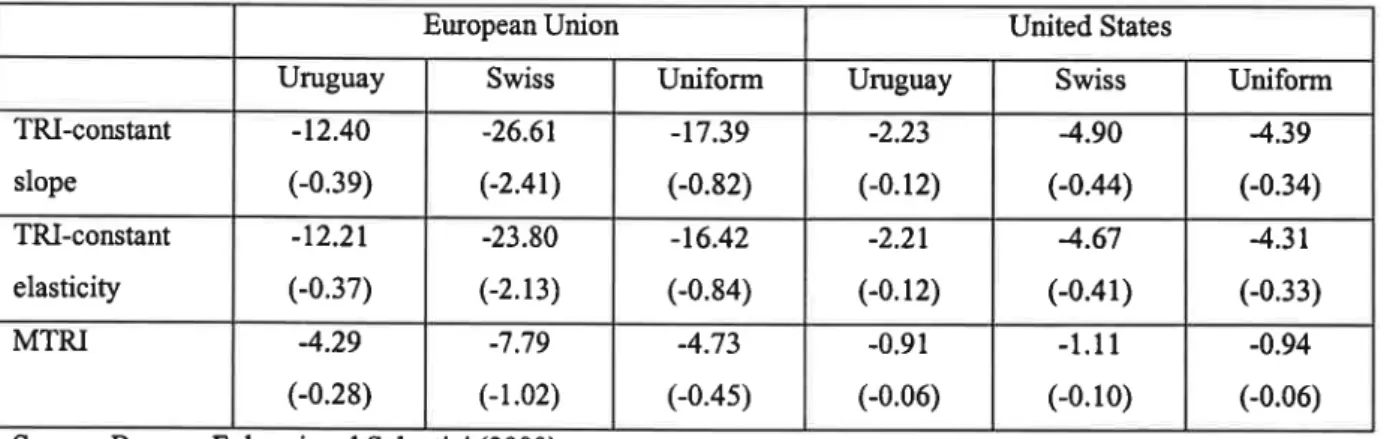
The analysis involves three stages. Firstly, the rates
of
changeof
theUE
and USTRI
and MTRIbetween 1995 and 2000 are computed using the base and bound tariffs of both countries as submitted
under the LTRAA.
This first
stage allowsto
assess andto
compare how much liberalisation wasachieved in both countries by the end of the implementation period of the URAA, compared to the initial situation. Secondly, the rates of change of the EU and US TRI and MTRI between 1995 and
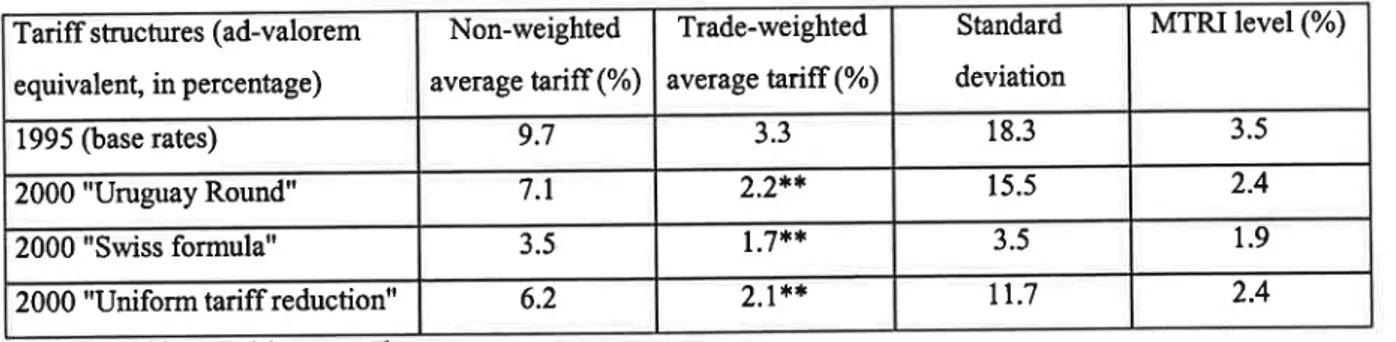
2000 are computed using two other schemes of tariff reduction: the "Swiss formula" and the uniform
the impact of tariff reduction commitments that would have focused more on reducing tariff dispersion than the actual LIRAA tariff cuts. For the uniform tariff reduction, the resulting changes in the TRI and
MTRI measure the impact of tariff reduction commitments that would have focused more on reducing
tariff average than the actual URAA commitments. Hence, this second stage allows to assess and to
compare the impact of the uneven allocation of tariff cuts across commodities implemented by the EU
and the US under the URAA. Thirdly, the levels of the EU and US MTRI are computed for the years 1995 and 2000, using the same three schemes of tariff reduction than within the second stage. This third stage adds information on the EU and US tariff structures at the beginning and at the end of the
URAA implementation period.
Prices, base and bound tariffs and import quantities required for computing the EU and US TRI and
MTRI were extracted from the database on tariffs and trade developed within subtask 1.1. Regarding
tariffs,
for
some commodities the EU andUS
schedules include a combinationof
ad-valorem andspecific
tariffs,
with
sometimes thresholdson
oneor
bothtariff
components. Therefore, specificcomponents were converted into ad-valorem equivalents by using the average 1995-1998 unit value
of
imports (or exports when imports were not available, or a unit value of the most similar commodity as a proxy when there was no trade in any of the four years). When tariff lines mentioned a threshold, the highest possible tariffs were considered.
Data on
total
expenditures were taken from the GTAP (Global Trade Project Analysis) database(version
4,Mc
Dougall et al., 1998).EU and US import elasticities were estimated econometrically. The estimation
of
these parameters raises a lot of problems, so that simpliffing assumptions had to be adopted. First of all required datafor a sufficiently long period were available only at the level of the so-called SITC classification (from the OECD's
NEXT
database), whichis
more aggregated than the 8-digit HS level. Hence, import elasticities were estimated for the commodity aggregates of the SITC classification. Consequently the single elasticity estimate of each aggregate was atfibuted to all 8-digit level commodities composing the conesponding aggregate. Secondly, due to the very large number of considered commodities, thespecification
of
import demand functions aswell
as the estimation procedure had to be simplified. Thus, import demand functions were specified in double log form, with the domestic own price (unit value) of imports deflated by the domestic consumer price index and the domestic real income as theonly explanatory variables. In other words, cross price effects were not taken into account, which is
clearly a limitation
of
the study. Finally, import demand functions were estimated over the period1,973-1996 using the OLS method.
Due to these adopted simplifuing assumptions, the estimated elasticities for any particular commodity can obviously
only be
considered asvery
crude estimates. Hencea
sensivity analysis has beenconducted
in
order to check how responsive are the TRI andMTRI
estimates to the magnitudesof
import demand elasticities.
1.3. The decoupling issue (chapter 4)
The part
of
subtask 1.2 devotedto
intemal supportis
aimed at contributingto
the debate on thedecoupling of intemal support instruments and the related WTO "green box" definition.
The analysis starts with a thorough review of literature on decoupling. Based on the general theory
of
welfare economics, the theoretical foundations of the principle of decoupling are reviewed. Then, themain limits of this principle when applied to domestic agricultural sectors and policies are discussed.
These limits mainly relate to practical concems and efficiency concerns. On the practical side, the
different mechanisms through which internal support policy instruments affect production and trade
are reviewed. From the economic efficiency point of view, the question is raised of the efficiency
of
highly decoupled policy instruments when concerned domestic economies are far removed from thetheoretical first-best economies and when objectives assigned to agricultural policies are not confined
to
supporting agricultural incomes.This last point
directly refers
to
the
questionof
themultifunctionality of agriculture.
The second step of the analysis addresses the issue of the measurement of the degree of decoupling
of
internal support policy instruments andof
the consistency of the "green box" decoupling criteria asdefined in Annex 2 of the URAA. The analysis is focused on income support policy instruments and
on coffesponding "green box" decoupling criteria (i.e., point 6 of Annex 2). This part of the analysis is
carried out by developing two different theoretical frameworks allowing to determine the effects on
domestic production and trade of various income support policy instruments.
The first model is directed at emphasising the key role of production technologies and factor mobility
assumptions as regards
to
the effectson
domestic production (i.e., the degreeof
decoupling)of
alternative income supportpolicy
instuments. The proposed model, inspired from Hertel (1989), considers two mono-product agriculttnal sectors, each using an aggregate variable input whose price isexogenous, a specific factor and a factor whose price is endogenous. Both sectors are competing for
this last
factor
which
is
alternatively consideredas
homogeneousand
perfectlymobile
orheterogeneous and so imperfectly mobile between sectors. Comparative static results allow to show
how the effects of policy instruments on domestic production are sensitive to adopted assumptions on
production technologies and factor mobility. They are also used to check whether specific decoupling criteria of point 6 of Annex 2 of the
t
RAA are well-designed.The second model has as its aim to examine the effects of various income support policy instruments
on
domestic production and trade when both the nurnberof
farmers and the priceof
land areendogenous. The proposed model, inspired from both Hughes (1980) and Leathers (1992), considers
one mono-product agricultural sector and consists
in
three equilibrium equations: the equilibriumcondition
in
the output market, the equilibrium conditionin
the land market and the entry/exit condition. Comparative static results allow to compare the degree of decoupling of altemative policyinstruments.
Finally, the third step of the analysis extents the second step by taking into account the multifunctional dimension of agriculture. More specifically, the second model is extended for allowing to examine the
effects
of
income support policy instruments not only on domestic production and trade (i.e., their distortion effects) but also on indicators (such as farmers'profit,
the numberof
farmers or yields) relating to various objectives that may be assigned to agricultural policies. In that case, comparativestatic results are derived
on a
constant cosVsupport basis, which allowsit
to
classiff
instrumentsaccording to their relative
ability
to achieve each policy objective while minimising induced tradedistortion effects.
1.4. Assessing the
world
market environment: The\ilATSIM
model (chapter 5)Subtask 1.3 is aimed at assessing the international frade environment, which
will
form the basis of theMillenium Round, and the impacts of trade reforms on world agricultural markets and trade.
This subtask has been carried out using a revised version of the
WATSM
(World Agricultural TradeSlMulation) model. WATSIM is a partial equilibrium, multi-region and multi-commodity simulation model
of
theworld
agricultural markets and trade. The current version covers 10 countries andregional aggregates accounting for the whole world. For each region, 29 commodities are included,
covering 4 cereals, starchy products, sugar, pulses, 4 oilseeds, 4 vegetable oils,
4 oil
cakes, 4 meats,eggs, milk and 3 dairy products. The model is a comparative static framework. Starting from the 1997 base year situation, it is solved for a given set of target years, with no information given on the path
of
adjustment between base and target years. Most parameters used
to
describe supply and demandbehaviours are not estimated but borrowed from other models or literature.
All
parameters are subjectto careful calibration to meet microeconomic theory.
The initial version of the model has been revised with respect to two main areas. On the one hand its original net trade representation has been changed to now consider endogenously gross imports and
gross exports on a same market. On the other hand, and based on the gross hade approach, the model's representation of tariff barriers and export subsidies has been improved. In addition, tariff-rate quotas
The implementation of the gross trade approach within the WATSIM model has been conducted in
two stages. Firstly, the former
WATSM
database has been updated and adapted to the new gross tradestructure
of
the model. The new WATSIM database consists nowin
two subsets: the former non-spatial database and the spatial database. The non-spatial database brings together data from varioussources on production, demand, frade and prices
of
agricultural commodities, macroeconomic and sectoral data as well as policy data.It
includes long time series, covering the period 1961-1997 (withsome series extending up
to
1999), available at the single country levelfor
some 110 agricultural commodities. Programming routines have been developed, that allow to easily and quickly check for data consistency as well as aggregate data according to the model's regional and commodity structure.Available time series are extracted mainly from the FAOSTAT (FAO of the United Nations) and PSD
(Production, Supply and Distribution, USDA) databases, the World Development Indicators (World Bank's database), the World Population Prospects (United Nations) and the Producer and Consumer Support Estimates (OECD).
The spatial database has been developed
by
adding bilateral trade flows and prices between themodel's regions
to
the non-spatial database. The spatial database includes time series covering theperiod 1988-1997, available
at
the
model's regional and commodity aggregate levels. Required bilateral trade flows are extracted mainly from the COMTRADE database (United Nations StatisticsDivision).
A
major taskin
the construction of the spatial database was to ensure consistency within this database and comparedwith
the non-spatial database. The experience shows that the "double reporting" in bilateral trade flows statistics (i.e., importer quotation and exporter quotation) does notnecessarily yields
in
mutual confirmation.In
addition,in
our specific case, the added gross importsand exports data (issued from the COMTRADE database) did not necessarily match the resulting net trade data
of
the non-spatial database (issued from mainly the FAOSTAT and PSD databases).Therefore,
in
orderto
ensure data consistency, the V/ATSIM spatial database has been constructed using an entropy-based approach, namely the cross-entropy approach (Golan et al., 1996).The second stage consisted in the re-designing of the WATSIM model in order to incorporate gross trade representation. Based
on the
Armington assumption (Armington, 1969),import
demandfunctions and export supply functions have been specified
for
each geographical zone and each commodity.Such
functions
closely
rely on
elasticitiesof,
respectively,substitution
andhansformation.
Due
to
data restrictions and resources limitations, these parameters have been"guesstimated". So, sensivity analyses aimed at investigating the impact of the adopted levels of these elasticities on the model outcome were carried out.
Since the new version of the WATSIM model represents explicitly gross imports and gross exports,
it
became possible to improve the modelling of trade policy instruments such as importtariff
barriers,TRQs and export subsidies.
In
very
general terms,for
each country and commodity, domestic"incentive prices" and import prices are linked to the corresponding world price through linear price
transmission functions. Specific and ad-valorem tariffs are represented by simple linear elements in transmission functions from
world
to
domestic import prices. Flexible levies are also explicitly modelled. They lead to non-differentiable price transmission functions. Thus, the exact relationship issmoothly approximated in order to allow for solubility. Just like import tariffs, export subsidies are
specified as an element
of
price hansmission functionson the
export side. They can either berepresented by a linear element or reflect a minimum domestic export price. In this last case, flexible export subsidies are modelled in a way similar to flexible levies on the import side. In addition, limits on subsidised exports are explicitly taken into account. For that purpose, two endogenous adjustment
options are introduced in the model solution: in the case of a minimum export price, the model forces
administrated stock purchases to adjust for subsidised exports do not exceed the corresponding limit;
in
the caseof
a constant export subsidy, the model forces the per-unit export subsidy to adjust for subsidised exports meet the bound. Lastly, TRQs are represented through two-tieredtariff
lines:preferential tariffs for within quota imports and MFN (Most Favoured Nation) tariffs for over quota
imports.
The
effectivetariff
(i.e., real protection)is
then determined andogenously.It
is
at
thepreferential
tariff
level as long as the quotais
unfilled, at theMFN
tariff
level when over quotaimports occur and between both tariffs when the quota is just binding. This effective tariff function is
non-differentiable and is approximated through smooth sigmoid functions.
1.5.
MECOP:
A
modelof
the EU's
producing sectorof
cereals, oilseedsand protein
crops (chapter 6)The main objective of subtask 2.1 is to develop a sectoral model of arable crops for the EU in order to
provide quantitative assessments
of
the
impactsof
reform
proposalsof
the
Common Market Organisation (CMO) for arable crops.Subtask 2.1 has been carried out
by
developing a modelof
the EU's producing sectorof
cereals,oilseeds and protein crops (the so-called MECOP model) and then using this model
for
simulating alternative policy scenarios.The MECOP (Maximum Enhopy
for
Cereals, Oilseeds and Protein crops) modelis
cented on EU supply of cereals, oilseeds and protein crops (COP).A
special feature of the model is that it considersexplicitly the main policy instruments currently
in
forcein
theCMO
for
arable crops (i.e., pricesupport, area payment system, set-aside requirement).