7f
WORKING
PAPER
ALFRED
P.SLOAN SCHOOL
OF
MANAGEMENT
DYNAMICS OF PRICE ELASTICITY
AND THE PRODUCT LIFE CYCLE - AN EMPIRICAL STUDY*
Hermann Simon** WP 1035-78 November 1978
MASSACHUSETTS
INSTITUTE
OF
TECHNOLOGY
50MEMORIAL
DRIVE
CAMBRIDGE,
MASSACHUSETTS
02139DYNAMICS OF PRICE ELASTICITY
AND THE PRODUCT LIFE CYCLE - AN EMPIRICAL STUDY*
Hermann Simon**
WP 1035-78 November 1978
The author gratefully acknowledges the helpful comments of
Horst Albach, Helmut Bruse (University of Bonn), Alain Bultez
(EIASM Brussels), and Alvin J. Silk (M.I.T.).
** Assistant Professor of Management Science
University of Bonn, and
Visiting Fellow, Sloan School of Management,
ABSTRACT
The author presents a product life cycle model which incorporates
carryover-effects and obsolescence and allows for time-varying price
responses. An empirical study of 35 products reveals typical changes
in price elasticity over the product life cycle and casts doubt upon
the hypotheses prevailing in the marketing literature. Some important
implications for strategic pricing and anti-trust issues are being
discussed.
- 1
INTRODUCTION
In the marketing literature it has frequently been alleged that marketing
strategy should vary over the product life cycle (Kotler 1971, Lambin 1970,
Levitt 1965, Wasson 1974, sec also Dhalla and Yuspeh 1976). Such allegations
presuppose a certain knowledge on the efficiency of various marketing instruments
at different stages of the life cycle. In fact, very little is known about this
issue. In support of the allegations, reference is usually made to Mickwitz
(Kotler 1971, p.62; Lambin 1970, p. 15; Parsons 1975) who - back in 1959 -
pre-sented some theoretical considerations on the changes in marketing elasticities
over the life cycle, but did not give any empirical evidence of his hypotheses.
Too often no clear distinction between the life cycle of a particular product
and the life cycle of a whole product class has been made, two exceptions being
the studies of Polli and Cook (1969) and Dhalla and Yuspeh (1976). The present
study is clearly confined to single products, no conclusions on whole product
classes will be drawn. Throughout the paper, the term product life cycle (PLC)
denotes the time series q. ,,...,q. T of quantities sold of a particular
pro-duct or brand i. The PLC-concept is not understood as an ideal-type model.
We focus on price and on the changes in price elasticity over time. According
to Mickwitz (1959) and his followers price elasticity increases over the first
three stages of the PLC (introduction, growth, maturity) and decreases during
the stage of decline.
The first part of this hypothesis seems to be supported by some findings of
diffusion research according to which early adopters of new products typically
have higher incomes and pay less attention to price than later adopters do
(Robertson 1967, Rogers 1968). The hypothesis is also confirmed by a General
Motors study on the price elasticity of automobile demand for the years 1919
- 38 to which Dean (1950, p. 227) refers. One should note, however, that both
2 ~
do not read,,,
allow conclusions
for single products or brands.
AS for single products
, a great many empi>ica, tests of
dynamic sales respons,
functus
have been conducted,almost al, of which are, however,
related to
-"*..**
Clarke(,„,
reviewed about 70 of these stuoies,
further review,
can be found in Parsons and Schultz
(1976) and Dh.ll.
(1978).
Relatively few studies include nrirc
**=„,,
,
'ciuoe price as an explanatory
variable (Telser 1962
Umbin
,970,Houston .„d Weiss ,974, Wildt
,974, Lambin.Naert.and Bultez ,97,
-riarty
,975, Lambin ,97S, Pr.sad,d
Ping ,g76,
A„
of these studjes^
—invariant
priceresponse or price elasticity
coefficients .nd, therefore
do not per.it .ny conclusive inference on
the cb.nges in price response or
Pnce
elasticity overthe PLC. The o„,y models which
Include time-varying
sales responses are
,imited to advertising
issues (8eckwith ,9,:,
Par sons ,975
Wildt ,976, Winer
,976, Erickson ,977).
««*
(,977a,b, has presenteda model in which price
elasticity varies with
i
aspect
to the advertisingexpenditure, but
nevertheless is const.nt with
respect to tin*. A decre.se in the magnitude
of price elasticity over
«-
isProduced in the well-known competitive
simulation mode, of Kotler (,965, This
-de,,
however, can bard,y be testedem
pirica„y
and yie,ds - dueto the fact
that price elasticity approaches
the zero levellevei -
stratemV
»
„ •strategic recommendations which cannot be considered asas reasmvhia.reasonable;
«.
•this is shown in Simon (1978).
This short survey,
thus, leads to theuie conclusion
Mat
„„ • •conclusion that no convincing empirical
or theoretical evidence nfevidence of the changesth a ~i»..
in price elasticity
over the PLC and
of the marketing
efficiency of price at different stages of the PLC
THE DATA
Data on prices and quantities sold of 43 products (brands) on 7 different
markets were available for this study. All data are of most recent origin
(all after 1970) and refer to the West German market. They were supplied by
large German corporations on a confidential basis so that the product
identi-ties cannot be revealed. The most important data characteristics are given
in table 1.
INSERT TABLE 1 HERE
All products represent frequently purchased branded items. On each market,
products at different stages of their individual PLC's are represented. All
markets had been established before the period under investigation so that our
analysis applies and is limited to products which are introduced onto markets
with existing substitutes, it does not apply to generically new products. We
are not aware of any single study which includes a greater number of products.
The data show enough variation to admit an examination of the dynamic
relation-ships between prices and sales. The managers concerned with the products
con-sider price (besides quality which remained unchanged over the period under
investigation) as the most important marketing variable.
Even in the case of the detergents, the absence of non-price data
doesn't seem to be too serious a problem. This is in particular true for
advertising data due to two reasons. On the one hand, advertising is
much less important in Germany than in the U.S.; this is mainly due to
strict limitations of TV-advertising (only 20 min. per weekday, no adv. on
Sundays and holidays; in 1977 the advertising budget of Procter & Gamble (USA)
- 4
On the other hand, the managers hold that advertising spending for detergents
is rather evenly distributed over the year and hasn't changed much over the
period under investigation, so that the impact of advertising is likely to be
adequately reflected in the constant term of the sales function.
MODEL SPECIFICATION
The empirically tested dynamic sales response models usually have the form
1i,t
= a
l
+a
2
Vt-1
+f(p
i,t' Pi,t} (1 >where q. . product i's sales in period t (either units or market share)
p.; t product i's price in period t
p. t some weighted average price of products competing with
1,1.
product i in period t
f(») price response function
a-. , ao parameters
The sales and price variables are either in natural or in logarithmic
dimension. Typically all functional relationships in (1) are assumed to be
time-invariant. Hence, for constant prices and |a
2! < 1, function (1) can only
describe the approach of q. . towards an equilibrium level of sales. The
1 1*
dynamics of (1) do not allow for a representation of a life cycle curve with
an ascending and a descending branch if prices remain unchanged. Moreover, the
time-invariant price response presupposed in this function must be considered
as a very restrictive assumption.
Within the last few years a number of advertising models which allow for
time-varying coefficients f both advertising and the lagged sales variable, the
so called "carry-over effect", have been proposed (Beckwith 1972, Parsons 1975,
effect are not unequivocal- Parsons (1975), for instance, presupposed
an increase in the carry-over effect over time and Wildt (1976) investigated
industry sales and not product sales. The results of Beckwith (1972) and
Winer (1976) both
ofwhom
studied the Lydia Pinkham data indicate a downwardtendency of the carry-over effect. Product life cycle theory indeed suggests
that the abilitiy of a product to retain its customers from period to period
should decrease in the course of time due to the introduction of new
competit-ive products which, in a dynamic market, are likely to be superior either
tech-nologically or "psychologically" (fashion, taste etc.). The erosion or
"obsolescence" of the old products and the diffusion of the new products,
how-ever, occur gradually and not immediately. It seems reasonable to assume an
exponential pattern of the decrease in the carry-over in order to account for
this phenomenon.
Thus, we obtain for the non-price terms in (1), for which we write A. .
i ,t Al: A 1§t - a 1 + a 2 .q. jt_1 .
(l^^i
( 2) where < a3 < 1 can be interpreted as'rate of obsolescence' and t. denotes the
period of introduction of product i. For t=t. we have A. .=8,, hence a,
repre-sents product i's initial demand potential.
The results of Winer (1976) indicate that not only the carry-over effect but
also the initial demand potential may be subject to the obsolescence
phenome-non. Assuming the same rate a
3 we obtain as an alternative model to (2)
A2: A.
)t
=
(a^a^.^)
(l-a/^l
(3)
It should be noted that Al and A2 include the function with constant parameters
as a special case where ao=0.
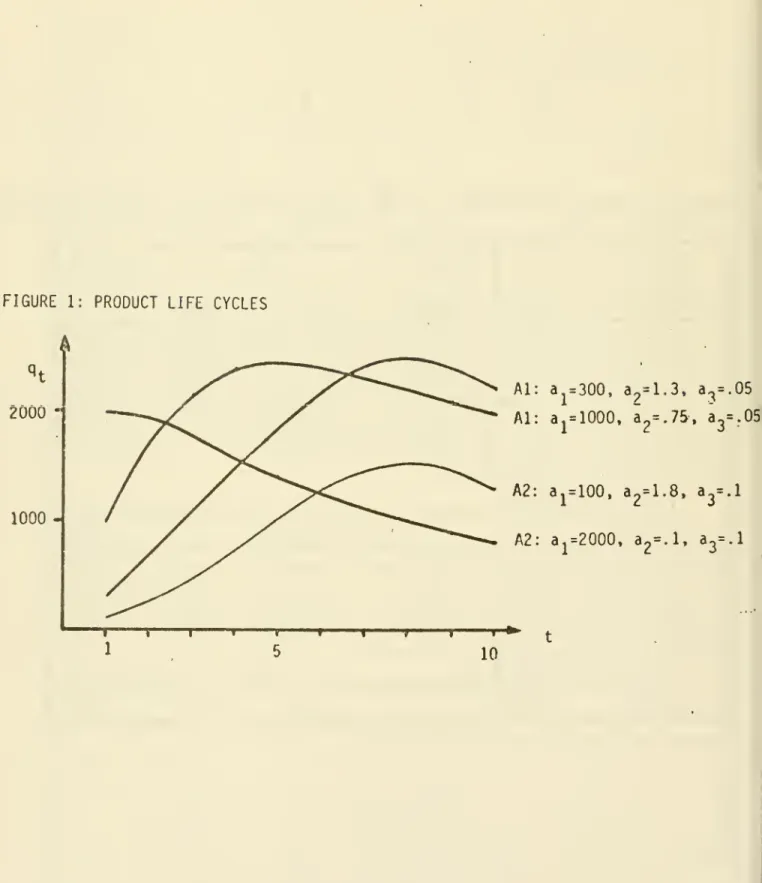
A great variety of possible life cycle curves can be represented by means of
PLC's tend to have very different shapes (Cox 1967, Polli and Cook 1969, Wasson
1974, Dhalla and Yuspeh 1976). Figure 1 gives an illustration of this
flexi-bility [f(.)-<>].
INSERT FIGURE 1 HERE
Some of the products under investigation show seasonal sales patterns which are
due to season-related diseases in the case of the drugs and to certain habits
of German housewives in the case of the detergents (draperies etc. are typically
laundered in spring and fall). Both managerial experience and visual inspection
of the sales curves indicated that only two types of seasonal patterns existed
so that one dummy variable D. = {0,1} is sufficient to account for the
seasonalities. Adding the seasonal term to Al and A2 respectively we obtain.
A3: A. jt = a x + d.D t+a2
q^^l-ag)*"*!
(4) A4: A i)t = ( 3l + d-Dt+ a2q1>t>1) (l-a 3) t"t i (5)In a few cases, a further version A5 which is equal to Al with a-, =0 has been
tested.
It seems reasonable to assume that product i's sales depend both on the absolute
level of its price p. . and on the differential between p.
t and the prices of
competing products.
In the absence of evidence to the contrary, we hypothesize and test a linear
relationship between q. . and the absolute price p. ..
B i,t
= b
-Pi,t <6)
As to the sales effect of the price differential we adopt a hypothesis which
was first proposed by Gutenberg (1955, 1976) and has found wide acceptance in
the European marketing literature. According to this hypothesis a relatively
small price differential is assumed to have an underproportional sales effect,
over-7
-proportional sales response. This hypothesis- is based on the experience that
only very few customers are likely to switch from their accustomed brand to
another brand if the price differential changes by e.g. 1% or 2% only, whereas
the number of brand switchers typically grows overproportionally when the
price differential increases for instance to 20% or 30%.
A nonlinear relationship of this type can be represented by a sinh-function
(sinus hyperbolicus, Albach 1973). We consider two versions of sales response
to price differentials, the first being
CI: C.
)t = cj-sinh (
^
Api>t) (7)where Ap. = (pn
-t-p.- +)/P,- t is the price differential,
Y m. .p. . is the market share (m. .)
i»t " ._, ,, n weighted average price of
3?i J ' products competing with i,
c, ,C2 are parameters.
In the version CI the price response is time-invariant. The second version
to be tested is based on the assumption that the sales response on a price
differential is proportional to the total market demand hitherto effective.
C2: C. t = c x sinh (c 2 APi>t)
q^
(8) where n q. , =I q. . , is the total market demand in t-1
.
The version C2 meets in particular the requirement of Parsons and Schultz
(1976, p.158) that a time-varying response should rather be explained by
marketing variables than merely by time.
The terms A, . , B. . , and C.
t can be linked either additively or
it implies that the price response, i.e. the derivative 8q. +/9p
1
-t, develops
proportionally with the non-price term A. . so that the price response would
be affected by the obsolescence effect in the same way as the carry-over
effect. This would, in fact, amount to a predetermination of the question
to be investigated. Therefore, the assumption of independence between the
non-price influences and the price influences is made so that a linear
function is obtained.
<i,t
=A
i,t+B
i,t+C
i,t+u
i,t <9>where A. . is either Al
,
,A5; C. . is either CI or C2; and u.
t is the
error term.
In anticipation of the detailed regression results we note here that
the influence of the absolute price, b-p. . , did not prove significant for
any of the products. This result coincides very well with the managerial
opinion that primary demand for the products under investigation has not been
affected by changes in the absolute price levels (since 1970). This applies
both to the detergents and to the pharmaceuticals.
Due to this outcome, we can confine subsequent attention to A. . and
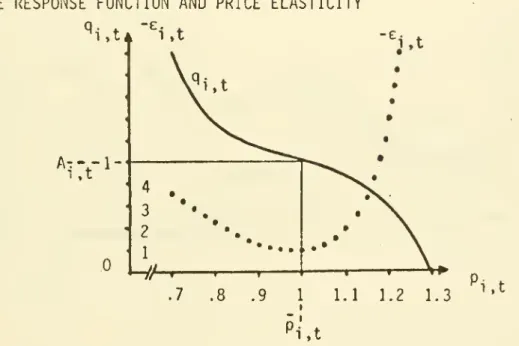
C. .. The solid line in figure 2 gives a graphical illustration of the price
response function (with A, .=1, B. .=0, c,=.l, c
2=10, p. .=1)
INSERT FIGURE 2 HERE
The price elasticity denotes the percentage change in sales induced by an
incremental (or 1%-) change in price and is mathematically defined as
e i,t = 9
Vt
/3p i,t ' p i,t/qi,t <10)9 -CI P i,t e i t = ~c l c 2 cosh(c 2 Api t^ '~ (1] ) C2: q i,t pi,t e i>t = -Cl c2 cosh(c2 Api>t
)^^l
(12) 'i,t Ki,tThe equations (10) - (12) show that the dimensions of prices and quantitities
are eliminated when e^
t is computed. Hence, price elasticity is a
dimension-less measure of price response and can readily be compared for different products.
The proposed price response function and its price elasticity have the
follow-ing properties:
(1) The function gives economically reasonable values within a certain
inter-val only. It doesn't make any sense to compute the expected sales effect of
an arbitrarily large price differential (e.g. 1000SQ by means of this function.
According to Kotler (1971) this property applies to most marketing response
functions.
(2) The magnitude of price elasticity increases for increasing positive and
negative deviations of p. . from p. . ; this is a necessary consequence of
our basic assumption that sales response increases overproportionally with Ap.
t
I*w•
The price elasticity values are given by the dotted line in figure 2.
(3) The function allows for any development of price elasticity over time;
£; t may decrease, increase , remain constant, or develop irregularly over
time. Some examples which give evidence of this flexibility are depicted in
figure 3 (the parameter values can be found in table 2).
INSERT FIGURE 3 HERE
(4) Since the absolute price level has turned out to have no significant
influence on sales, the direct price elasticity e. . , the cross-price
l tt
C -
10
elasticities have the same magnitude. Therefore, we need not distinguish
between direct and cross elasticities (though they have different signs)
and can confine ourselves to the discussion of their common magnitude.
REGRESSION RESULTS
Since market shares do not necessarily show a PLC-pattern (e.g. if market
sales and product sales develop proportionally-^ m. .=const.) sales units were
considered as the more appropriate dependent variable for our purpose.
The different versions of (9) are nonlinear with respect to the obsolescence
parameter a
3 and the price parameter c2< Therefore, the nonlinear least squares
estimation technique of the TSP-program (a Gauss-Newton algorithm) was applied.
The results of these estimations, however, proved highly unsatisfactory due to
the following reasons (ranked according to their importance):
- though convergence was achieved
in most cases the coefficients were almost
invariably insignificant.
- the rate of
obsolescence a
3 often had a negative sign which is economically
unreasonable since it implies an unlimited growth of the carry-over effect.
- in about
20% of the cases no convergence was achieved.
These results suggested to attempt a different approach in which a
3 and c2
were prefixed so that the sales function became linear in the remaining
para-meters and ordinary least squares (OLSQ) estimation procedures could be applied.
The search for the obsolescence parameter a
3 was limited to the interval (0, .1)
since a
3 can reasonably be assumed not to exceed .1 for the given data
inter-vals (quarters and bimonths).
A similarly apparent interval for reasonable values of c
2
is not available. For
a given Ap.
^,
this parameter determines the magnitude of the11
thereby, the degree of nonlinearity of price response. One can easily realize
this relationship in figure 2 by considering Ap^
t as given and c2 as variable.
For |c
2 Api t| <1, sinh is almost linear; for |c
2 Api t
| > 1, sinh becomes
increasingly nonlinear. Thus, by prefixing different values of c
2 we can
account for different degrees of nonlinearity in the sales response to price
differentials.
In the estimations we usually prefixed three values in the following way
(x- denotes the maximal magnitude of Ap. . over all periods)
12
-estimate fell into the inconclusive range or indicated autocorrelation. This
enforced criterion has been suggested (Schneeweiss 1974, p.244) since DW is
of limited reliability when one of the regressors is the lagged dependent
variable (Durbin 1970). Durbin's H which would be appropriate in this case
is not provided in the TSP-program of MIT-Harvard by means of which the
estimations were made.
Column (10) gives the introduction periods l.t a negative number indicates
that the product has been introduced before the period under investigation.
In the cases marked by an asterisk the true introduction periods were not
available, and t. was set equal to 1. The numbers in parentheses are the
t-statistics and a, b, c, and d denote significance at 1%, 5%, 10%, and 25%
respectively (one tailed test).
(End of footnote table 2).
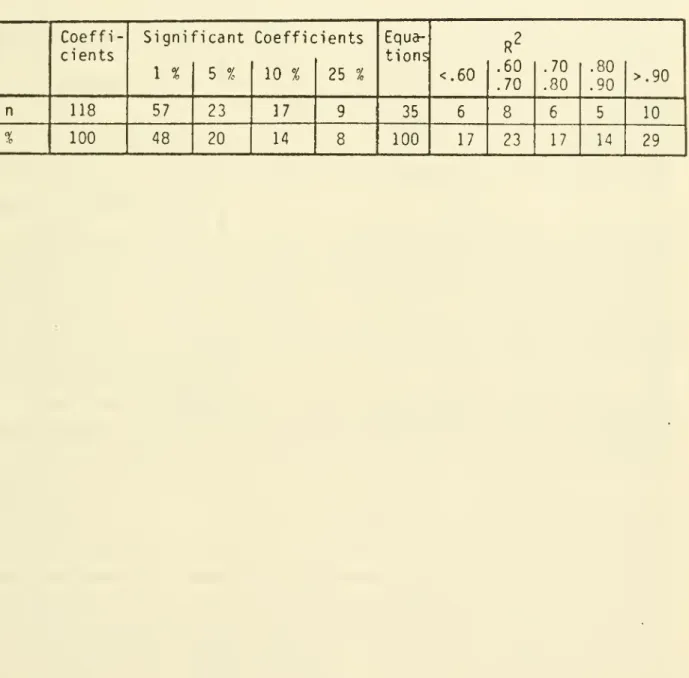
Reasonable results have been obtained for 35 out of the 43 products. A summary
of the statistical criteria of the regressions is given in table 3.
INSERT TABLE 3 HERE
Thus, 82% of the coefficients were significant at 90% or more and 83% of
2
the coefficients of determination R exceeded 0.60. These results give strong
empirical support to the hypotheses underlying our model. Both the PLC-dynamics
and the competitive price effects appear to be adequately represented.
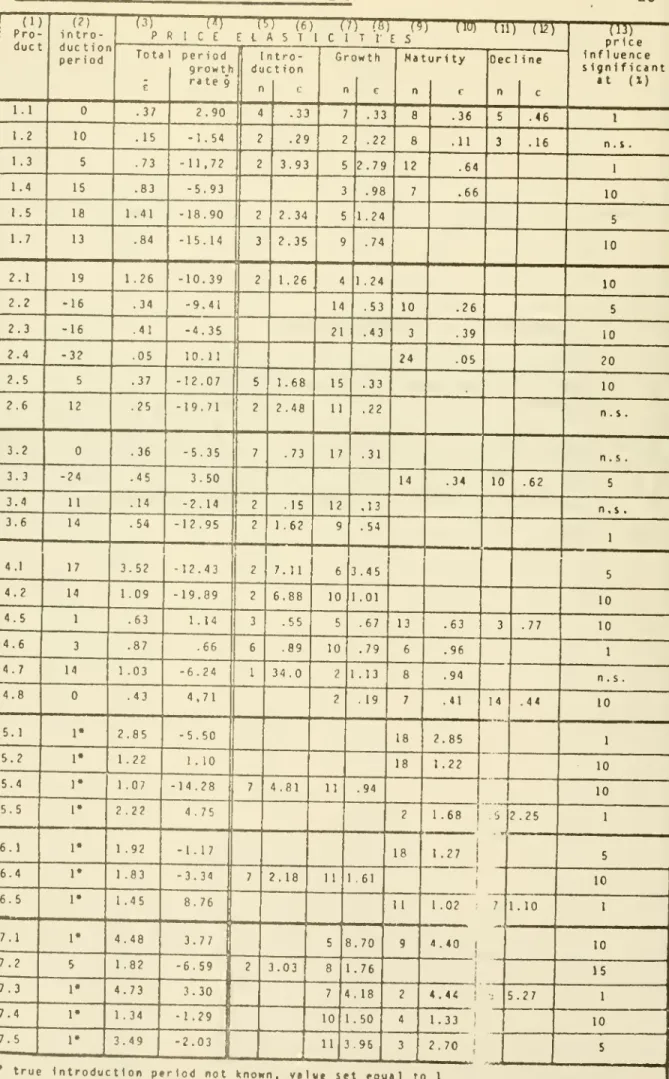
PRICE ELASTICITIES
From the regression equations, we computed price elasticities for all products
and all periods. For this purpose the actual values of prices and quantities
- 13
In order to obtain condensed and comparable measures of the magnitude and the
development of each product's price elasticity the median i and the average
growth rate g of each time series e. . , t = t.
,
,T were calculated. In
this case, the median is the appropriate measure of the average magnitude of
price elasticity since it excludes the influence of outlyers which were not
infrequent. The average growth rate g is obtained as the geometric mean of
the time series of elasticity growth rates. Note that the arithmetic mean
would be inappropriate when applied to growth rates. The values of e and g
are given in columns (3) and (4) of table 4.
INSERT TABLE 4 SOMEWHERE HERE
One readily recognizes from column (3) in table 4 that the elasticity medians
of the two product groups are considerably different. Almost all of the price
elasticities of the pharmaceutical products (markets 1 - 4) are smaller than
(or close to) 1, whereas the values for the detergents without exception are
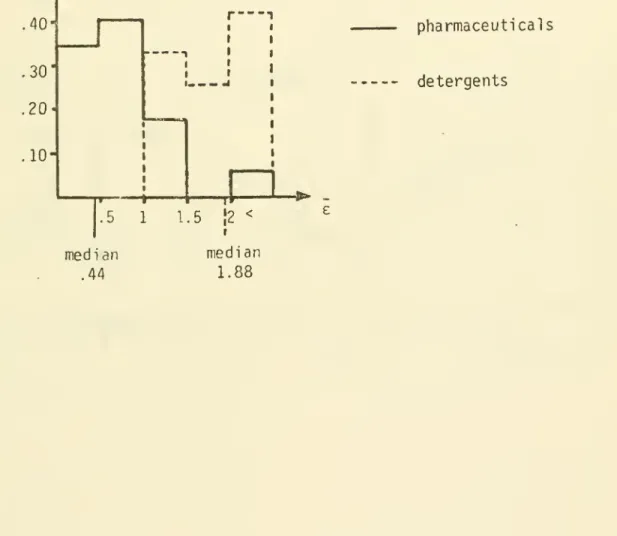
greater than 1. This important finding is further clarified in figure 4
where the distributions of the elasticity medians are depicted, separately
for the two product groups. Only cases with significant price influence are
included in figure 4.
INSERT FIGURE 4 HERE
The graphical illustration gives even stronger evidence of the differences
in price response between the two product groups, the medians of the two
distributions (.44 and 1.88) being significantly different at the 1%-level.
Both these differences and the absolute magnitudes of price elasticities
coincide very well with the managerial experience. The results are also in
good accordance with the findings of other researchers (Telser 1962,
- 14
-The average growth rates g in column (4) of table 4 indicate that the price
elasticities have frequently undergone considerable changes over time of both
positive and negative sign. In order to investigate this issue more deeply
and to find out whether the changes in price elasticity show characteristic
linkages with certain PLC-stages, we make two types of comparisons.
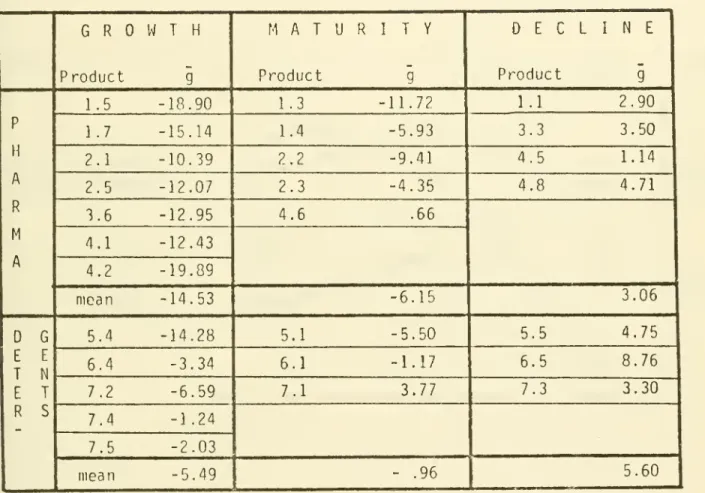
We first compare the elasticity growth rates of those products which were
at
the same PLC-stage (introduction, growth, maturity, or decline) during the
last quarter or bimonth under investigation.
In addition to this cross-section comparison we study the
magnitudes of price
elasticity of one and the same product at different stages of this product's
PLC- Tnis longitudinal comparison is necessarily limited
to products whose
sales curve includes at least two PLC-stages; 30 products belong to this group.
Both the cross-section and the longitudinal comparisons require a preceding
classification of the actual sales curves into PLC-stages. It is certainly
desirable to use objective criteria for this classification. Respective attempts,
in which growth rates, moving averages of
2, 3, and 4 growth rates, changes in
signs of growth rates, or the stage identification criteria proposed by Pol1
i
and Cook (1969) were used, did, however, not prove useful. Polli and Cook state
themselves that their criteria "are by no means flawless" and their application
would, in fact, have led to stage sequences like e.g.
maturity-growth-decline-maturity. The growth patterns in our sample (and
probably empirical growth
patterns in general) are somewhat different from the regular PLC-schemes usually
found in marketing textbooks.
Positive and negative growth rates or averages of
growth rates actually occurred at all stages, and the
magnitudes of growth rates
showed enormous irregular variations (see also Dhalla and Yuspeh
1976).
Therefore, a standardized classification scheme was not
considered as appropriate
and we decided to effect the necessary classification on the basis of a visual
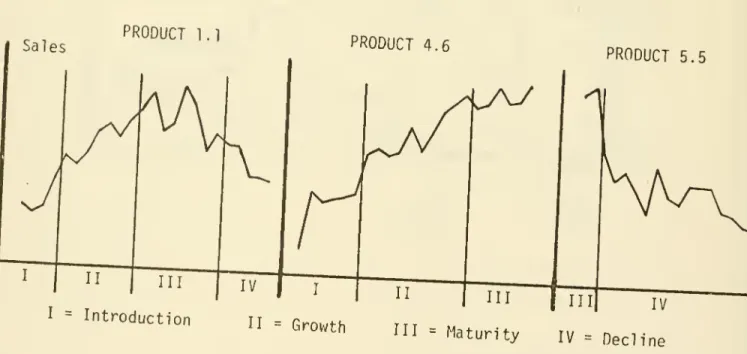
inspection of the sales curves. The
15
products under investigation in figure 5.
JNSERT
FIGURE 5 HEREThough this method may seem somewhat arbitrary we consider it as justified and
appropriate in this case. On the one hand, the resulting classification is not
likely to differ significantly from person to person, as discussions of the
author with both managers and scientists have shown. Even if there are slight
deviations in the classification they are not likely to affect the results. It
should also be noted that this way of classification fully corresponds to the
way in which the manager has to determine at which stage of its PLC a product
actually is.
To a certain degree, the appropriateness of our classification is confirmed by
a comparison of the relative average duration of each stage with the frequency
distribution of stages obtained by Pol1 i and Cook (1969) for brands. This
com-parison reveals a considerable conformity.
16
-- with only two exceptions (5.1 and 7.3) the following relation proves true
^Growth '"
Maturity
<s ^DeclineThus, we can conclude from the comparison of the price elasticities of various
products being actually at different stages of their life cycles:
(1) Changes in price elasticity over the PLC seem to have a rather uniform
pattern.
(2) Price elasticity of growth products decreases over time.
(3) Price elasticity of decline products increases over time.
(4) The rates of change in price elasticity are not uniform in sign for
products being at the maturity stage. These rates, however, seem to be
smaller in magnitude than both the rates of growth products and decline
products.
In columns (5) - (12) of table 4 the numbers of quarters or bimonths and
the elasticity medians of the different PLC-stages are given for each product.
If we compare for each product the medians of adjacent stages (thus, only
products with at least two stages are included), the following relationships
are revealed:
(1) In 18 out of 19 cases (95%) the relation e
Introduction > eGrowth is confirmed.
(2) In 10 out of 14 cases (71%) the relation e
Growth > eMa t Uritv is confl
'
rmed
-(3) In 8 out of 8 cases (100%) the relation e
Matun
-ty <
decline
is conf"
irmed
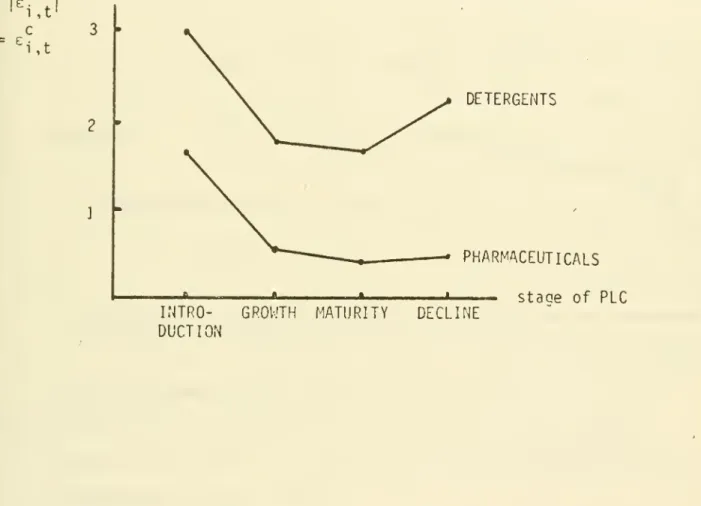
-The plot of the medians of the various stages further elucidates these findings.
INSERT FIGURE 6 HERE
We can summarize our findings as follows:
An empirical investigation of 35 products gives strong support to the
hypo-thesis that price elasticity shows typical changes over the product life
17
-seems to prevail. At the maturity stage, price elasticity typically reaches a
minimum which is again followed by an increase during the decline stage.
These empirical findings are in contradiction to the hypotheses prevailing
in the literature (see introductory section). This contradiction may partially
be explained by the fact that usually no clear distinction between the
absolute sales effect of a price change, which is given by the derivative
3q
i t/3P.j t> and the relative sales effect, which is equal to the elasticity e
i,t
= 9q
i,t/9pi,t' pi,t/qi,t has been made
-How can the uniformity of the empirical outcomes be explained in view of
the fact that the underlying price response function explicitly allows for
different development patterns and does not constrain the results to be as
reported. The main reason for the far-reaching uniformity of the elasticity
developments has to be seen in the changes in q. . (appearing in the
denominator of the elasticity term) which typically turned o u t to be considerably
greater than the changes in the derivative and in p. . .both appearing in the numerator
1 ,u
of the elasticity term. Thus, in a certain sense the development of the sales
q. t tends to determine the changes in e. . . Though the derivative 3q. +./8p.
+
typically also increases over the ascending branch of the PLC this increase
is almost never so great as to neutralize the reciprocal effect of the growth
in sales.
IMPLICATIONS
Since it has been our main objective to measure price elasticity and its changes
the managerial and anti-trust implications of our findings shall be outlined in
short only. The results seem in particular important for the optimization of the
pricing strategy over the life cycle. The optimal pricing strategy is obtained
18
-product index i is subsequently omitted)
max , =
I {p t+T qt+T- Ct+T(qt+T)} (l+ i)"
T
(13) T=U
where C(q) is the cost function and i is the discount rate.
The maximization of (13) requires a hypothesis on the presumable reaction of
competitors to the firm's price setting. This complex issue cannot be
dis-cussed in great detail here. It seems, indeed, of minor importance in this
case since we are interested less in the absolute levels of optimal prices
than in their developments over time. Whereas the former are certainly
governed by the competitive reaction pattern the latter are more likely to
depend on the changes in price elasticity and cross-price elasticity over
time.
Therefore, we consider the assumption that the prices of competing products
are treated as givens and not as functions of p
t as not too restrictive
for our purpose, which as aforementioned is to gain insights into the
development of optimal prices.
Under this assumption the differentiation of (13) with respect to pt leads
to the first order condition
a_ 3q. T-t 8q.
%
"it
+<>V
c ;>W
t *Mphx
-C i+I)apf
1
d
+ ')"T = ° (14)where C' denotes marginal cost.
Due to the formulation of A. . in (3) and (4) we obtain the long-run effect
of a price change in t as the product of the short-run price response, i.e.
the derivative 9q
t/8pt and the cumulative carry-over effect.
!!!*+!. !ft a X (l
r
t+T(T-l)/2 (15) ap t 3pt a 2 [l a3>19
Inserting (15) into (14), multiplying by Pt/q
t» and solving for the optimal
price pj gives
"*t
TTT
<=i "T^T
X
"WW
"S (l-.3)rtH
<rt
>/2(Itlf*
(,6)
t t T-l
Since e. still depends on p
t (16) doesn't allow for a straightforward
com-putation of pi. The equation clarifies, however, the following relations:
(1) The optimal dynamic price pi is a compound of the optimal static price,
which is given by the first term in (16) - this is the well-known
Amoroso-Robinson-Relation - and the present value of the future marginal revenues
caused by a price change in t.
(2) If a
2 > 0, < a3 < 1 , and p.+ > C.+ , this present value is positive
and pi is in all periods x < T less than the optimal static price (note that
this statement doesn't depend on the assumption on competitive reaction).
(3) If the price elasticity behaves according to our empirical findings
(depicted in figure 6) then the optimal mark-up factor £4-/(1 +
O
isrelative-ly smaller at the introduction and growth stage and relatively greater at the
maturity stage, it again decreases during the decline stage.
(4) Both the long-run price effect and the development of price elasticity
give support to a strategy of the penetration type. One should keep in mind,
however, that these statements (and our analysis as a whole) apply to
pro-ducts which enter onto a market with existing substitutes and have to be
viewed under the limitations of the assumed competitive reaction pattern. The
assumption of a different pattern may considerable damp (though not eliminate)
the outlined trend in optimal prices.
New products which establish a new market or product class and, thus, have
20
-situation and, consequently, different strategic recommendations apply (see
Simon 1976).
It should also be mentioned that changes in cost have, of course, the same
importance for the pricing strategy as the price response factors. If, for
instance, marginal cost decreases according to the experience curve concept
(Henderson 1972) the optimal prices need not increase over time since the
increase in the mark-up factor can be compensated (or even overcompensated)
by the decrease in marginal cost.
The optimal pricing strategy for a particular product at a particular time
depends on the relative magnitudes of the demand and cost factors. Therefore,
no general recommendation as to which type of strategy is optimal can be
given, this decision has to be made in each individual case.
The numerical optimization of the pricing strategy is best achieved by means
of a branch-and-bound algorithm which optimizes over a finite number of price
alternatives within a prefixed price range. In figure 7 the optimal pricing
strategy for product 4.2 of our sample is depicted. The actual price of this
product remained constant at .71 whereas the price differential Ap. , being
negative for all t,changed from - 48% at t=l to - 26% at t=10. The firm
under consideration usually prices its products above the average prices of
competing products. The competitors presumably expect this behavior and are
unlikely to react if prices are up to this expectation.
Therefore, the optimization was run over the interval (.48, .80). The marginal
cost was assumed to be constant (CI = .20) and an annual discount rate of
10 was applied, this rate is actually used in investment decisions by the
producer of the product. The optimization was carried out for a planning
horizon of 10 quarters or 2 1/2 years.
- 21
The resulting optimal strategy confirms the conclusion drawn from equation (16)
The initially prices are considerably lower than the prices in later periods
(penetration strategy). The fact that the initial prices are also less than
the actual prices may be an indication that practitioners don't pay sufficient
attention to the long-run effects of pricing. The present value of profits of
the optimal strategy exceeds the respective value of the actual strategy by
33.7%.
The limitations of such an optimization have, of course, to be observed. Our
model doesn't incorporate any negative goodwill or sales responses which may
result from the price increases, the necessity to raise prices several times
may well prevent managers from setting a low introduction price. Such
con-siderations can, however, hardly be represented in a quantitative model
and should have their proper place at the stage of managerial evaluation of
the optimization results.
Further implications of our analysis refer to anti-trust issues. The question
whether price competition is workable or not and whether dominant products
are subject to substantial competition or not played an important role in a
number of recent anti-trust cases (both in Germany and in the European
Community).
The discussions on these points have regularly been characterized by a lack
of objective information. The methods described in this article represent an
appropriate tool for the measurement of competitive intensity and
interde-pendences
under dynamic conditions. Albach (1977) used similar tools todetermine the relevant market for pharmaceutical products and to measure the
effectiveness of competition. He also extended the concept of the dynamic
cross-price elasticity by estimating partial cross-price elasticities between
single products or product groups. In this way an objective assessment of
22
-SUMMARY
A dynamic sales model which incorporates the product life cycle concept and
time-varying price responses has been presented. The model is of a very
general nature and includes both time-invariant and time-varying carry-over
effects as well as quasi-linear and nonlinear patterns of sales response to
price differentials.
An empirical study of 35 products reveals typical changes in price elasticity
over the life cycle and gives support to the conclusion that the magnitude
of price elasticity decreases over the introduction and growth stage, reaches
its minimum at the maturity stage, and again increases during the decline
stage.
Though the analysis is subject to limitations (e.g. relatively short periods
under investigation, many products included only 2 or 3 PLC-stages) the results
cast heavy doubts upon the hypotheses prevailing in the marketing literature.
They also call for further research for different product classes.
The findings seem to indicate the optimality of a penetration type strategy
for products which are introduced onto markets with existing substitutes.
23
-TABLE
1:DATA
CHARACTERISTICS
Pro-duct
25
TABLE t:
PRICE
E L A S T- 27
- 28
-FIGURE 1: PRODUCT LIFE CYCLES
A
ZOOO -1000 -Al: a =300, a ?=1.3, a? =.05 Al: a.=1000, a 2 =.75, a 3 =.05 A2:a^lOO,
a 2=1.8, a 3 =.l A2: aj=2000, a 2=.l, a 3=.l i k i i i » i 'f i i»
£ 1 5 1029
-FIGURE 2: PRICE RESPONSE FUNCTION AND PRICE ELASTICITY
30
FIGURE 3: EXAMPLES OF PRICE ELASTICITY DEVELOPMENTS
31
FIGURE 4: DISTRIBUTIONS OF THE MEDIANS OF PRICE ELASTICITY
i
40-32
FIGURE 5: EXAMPLES OF CLASSIFICATIONS
INTO LIFE CYCLE STAGES
PRODUCT 1.1 PRODUCT 4.6 PRODUCT 5.5 Introduction
„
. Growth,„
= IV ty IV == Decline- 33
-FIGURE 6: AVERAGE PRICE ELASTICITIES AT DIFFERENT STAGES OF THE PLC
= e
l.t1
c
i,t
DETERGENTS
INTRO- GROWTH MATURITY
DUCTION
DECLINE
PHARMACEUTICALS
34
FIGURE 7: OPTIMAL AND ACTUAL PRICING STRATEGY OF PRODUCT 4.2
pi)t.80 .70 -.60 .50 optimal actual pricing strategy competitive price i » i * i i i i i i 1 5 10 t (quarters)
35
-REFERENCES
Albach, Horst (1973), "Das Gutenberg-Oligopol", in Zur Theorie des Absatzes,
H. Koch, ed., Wiesbaden: Gabler.
(1977), "Centralized versus Decentralized Pric* Comparisons as
a Problem in Market Organization: The Case of the Pharmaceutical Market
in Germany" in Proceedings of the Fourth Conference on Industrial
Organization, Berlin: International Institute of Management.
Beckwith, Neil E. (1972), "Regression Estimation of the Time-Varying
Effective-ness of Advertising," Working Paper, Columbia University
Clarke, Darral G. (1976), "Econometric Measurement of the Duration of
Advert-ising Effect on Sales", Journal of Marketing Research, 13(November)
,
345-363.
Cox, William E. (1967), "Product Life Cycles as Marketing Models", Journal
of Business, 40 (October), 375-381.
Dean, Joel (1950), Managerial Economics , Englewood Cliffs: Prentice Hall.
Dhalla, Nariman K. (1978), "Assessing the Long-Term Value of Advertising",
Harvard Business Review, 56 (January-February), 87 - 95.
and Yuspeh, Sonia (1976), "Forget the Product Life Cycle Concept",
Harvard Business Review, 56(January-February) , 102 - 112.
Durbin, John (1970), "Testing for Serial Correlation in Least-Squares
Regression when Some of the Regressors are Lagged Dependent Variables",
Econometrica, 38 (May), 410-421.
Erickson, Gary M. (1977) , "The Time-Varying Effectiveness of Advertising", in
Educators' Proceedings, Chicago: American Marketing Association.
Gutenberg, Erich (1955), Grundlagen der Betriebswirtschaftslehre, Band II, Per
Absatz, Berlin-Heidelberg-New York: Springer.
(1976), Grundlagen der Betriebswirtschaftslehre, Band II, Der
Absatz, 15th edition, Berlin-Heidelberg-New York: Springer.
Boston Consulting Group.
Houston, Franklin S. and Weiss, Doyle L. (1974), "An Analysis of Competitive
Marketing Behavior", Journal of Marketing Research, 11 (May), 151-155.
Kotler, Philip (1965), "Competitive Marketing Strategies for New Product
Marketing over the Life Cycled Management Science, 12 (December), B-104-109
(1971), Marketing Decision Making: A Model Building Approach,
New York: Holt, ftinehart and Winston.
Lambin, Jean J. (1970), Modeles et Programmes de Marketing, Paris: Presses
Universita ires de France.
(1976), Advertising, Competition and Market Conduct in Oligopol
y
over Time, Amsterdam: North Holland-Elsevier.
» Naert, Philippe and Bultez, Alain (1975), "Optimal Marketing Behavioi
in Oligopoly", European Economic Review, 6 (Number 1 ), 105-128.
Levitt, Theodore (1965), "Exploit the Product Life Cycle", Harvard Business
Review, 43 (November-December), 81-94.
Mickwitz, Goesta (1959), Marketing and Competition
, Helsingfors:
Central-trykeriet.
Moriarty, Mark (1975), "Cross-Sectional, Time Series Issues in the Analysis
of Marketing Decision Variables", Journal of Marketing Research, 12
(May), 142-150.
Palda, Kristian S. (1964),The Measurement of Cumulative Advertising Effects,
Englewood Cliffs: Prentice Hall.
Parsons, Leonard J. (1975), "The Product Life Cycle and Time-Varying Advertising
Elasticities", Journal of Marketing Research, 12 (August), 476-480.
• Schultz, Randall L. (1976), Marketing Models and Econometric
Research, New York: American Elsevier.
Polli, Rolando and Cook, Victor (1969), "Validity of the Product Life Cycle",
The Journal of Business, 42(0ctober), 385 - 400.
Prasad, K. Kanti and Ring, Winston L. (1976), "Measuring Sales Effects of Some
- 37
-Research, 13 (November), 391-396.
Robertson, Thomas S. (1967), "The Process of Innovation and the Diffusion of
Innovation", Journal of Marketing, 31 (January), 14-19.
Rogers, Everett M. (1968), Diffusion of Innovations, 6th edition, New York:
Free Press of Glencoe.
Scheuing, Eberhard E. (1969), "The Product Life Cycle as an Aid in Strategy
Decision", Management Review International , 9 (Sept. -Oct. ) , 50-62.
Schneeweiss, Hans (1974), Oekonometrie, Wuerzburg-Wien: Physica.
Simon, Hermann (1976), Preisstrategien fuer neue Produkte, Wiesbaden: Gabler.
(1978), "An Analytical Investigation of Kotler's Competitive
Simulation Model" Management Science, 24 (October),
Telser, Lester G. (1962), "The Demand for Branded Goods as Estimated from
Consumer Panel Data" Review of Economics and Statistics, 44 (August),
300-324.
Wasson, Chester R. (1974), Dynamic Competitive Strategy and Product Life
Cycles, St. Charles: Challenge Books.
Wildt, Albert R. (1974), "Multifirm Analysis of Competitive Decision Variables"
Journal of Marketing Research, 11 (January), 50-62.
(1976), "The Empirical Investigation of Time Dependent Parameter
Variation in Marketing Models" in Educators' Proceedings, Chicago:
American Marketing Association.
Winer, Russell S. (1976), "A Time-Varying Parameter View of the
Sales-Advertising Relationship", Educators' Proceedings, Chicago:
American Marketing Association.
Wittink, Dick R. (1977a), "Exploring Territorial Differences in the
Relation-ship between Marketing Variables," Journal of Marketing Research, 14
(May), 145-155.
(1977b), "Advertising Increases Sensitivity to Price", Journal
JYOi
SEP 27
1991ACME
BOOKBINDING CO., INC.
SEP
6 1983100 CAMBRIDGE STREET
3 TOflO
004
5E4
Mfll3 TOflO
004
5E4
50\OV-7?
HD28.M414 no.1032- 78
Kalwani, Manoh/Structure of repeat buy
736263 D*BKS Q006931f
w
3 TOflO DD1 E40 bSl
H028.M414 no.1032- 78 1979
Kalwani, Manoh/Structure of repeat buy 73757.1 D*BKS.. . .0013716"
1
3 TOflO 00E OSD Dlfl
HD28.M414 no.1033- 78
Baldwin, Carli/Liquidity preference un 73601.1 D»BKS.. 00.066623
3 TOflO DD1 EOT 3S3
H028.M414 no.1034- 78
Van Breda, Mic/Bayes vs. the lens
736013 D*BKS 0006662
3 TOflO DD1 EOT 433
HD28.M414 no.1035- 78
Simon, Hermann/Dynamics of price elast
73601.5 Jtt*BKSL_. .00.066627
3
toao
ao EOT MSfl HD28.M414 no.1036- 78Schmalensee, R/A simple model of risk
736017 D*BKS... .00.066625. Ill
3
T060
001 EOT N HD28.M414 no.1038- 79Choffray, Jean/Methodology for segment 736019 D*BKS 00066621
3
T060
001 EOT 34E HD28.M414 no 1039- 79Meldman, Jef fr/Decision support system
82764646 0*BKS
3 TOflO 001 E40 S75
HD28.M414 no.1040- 79
Kaplan. Nancy /A computer code for sol
736021 D*BKS . .00.066622
I
3 TOflO 001 EOT 3b7