Plasma boundaries at Mars: a 3-D simulation study
18
0
0
Texte intégral
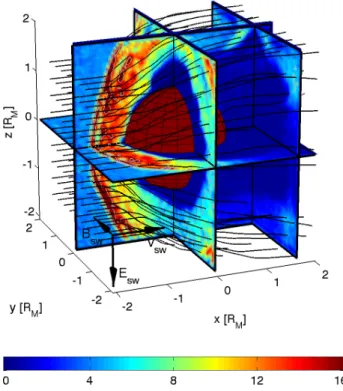
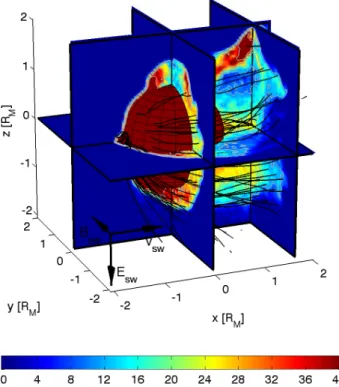
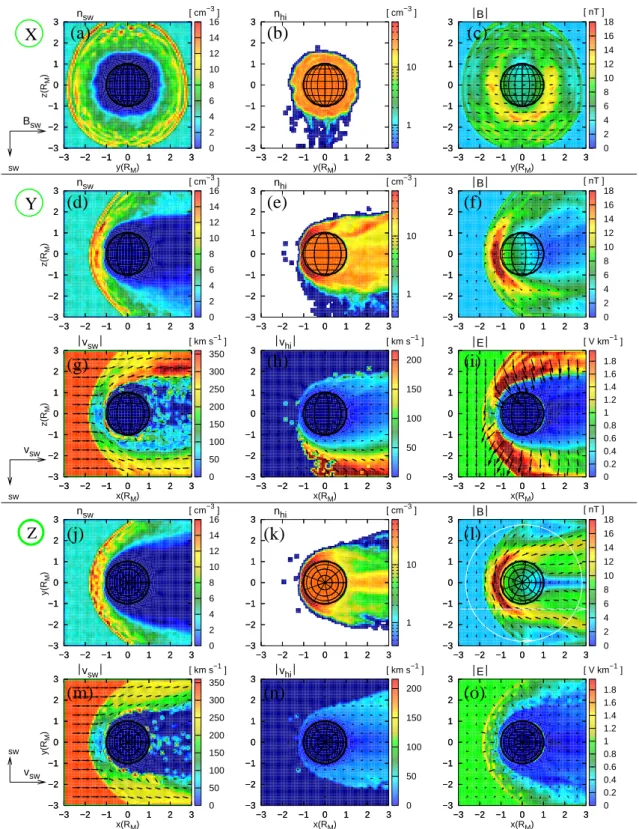
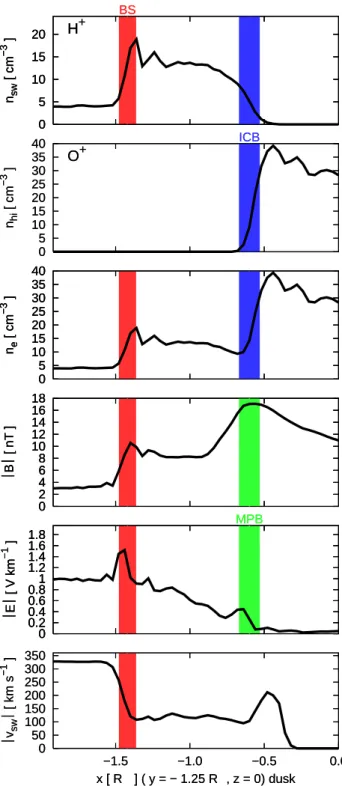
Figure
+7
Documents relatifs
Hybrid sim- ulations for unmagnetised planets (Shimazu, 2001; Ter- ada et al., 2002; Kallio and Janhunen, 2002; B¨oßwetter et al., 2004; Modolo et al., 2005), a statistical analysis
For three-axis stabilized (i.e., nonspinning) spacecraft, like STEREO which is continuously imaging the Sun, an alternative strategy is required to measure solar wind electrons:
