HAL Id: hal-00318326
https://hal.archives-ouvertes.fr/hal-00318326
Submitted on 4 Jun 2007
HAL is a multi-disciplinary open access
archive for the deposit and dissemination of
sci-entific research documents, whether they are
pub-lished or not. The documents may come from
teaching and research institutions in France or
abroad, or from public or private research centers.
L’archive ouverte pluridisciplinaire HAL, est
destinée au dépôt et à la diffusion de documents
scientifiques de niveau recherche, publiés ou non,
émanant des établissements d’enseignement et de
recherche français ou étrangers, des laboratoires
publics ou privés.
injections
A. J. Kavanagh, G. Lu, E. F. Donovan, G. D. Reeves, F. Honary, J.
Manninen, T. J. Immel
To cite this version:
A. J. Kavanagh, G. Lu, E. F. Donovan, G. D. Reeves, F. Honary, et al.. Energetic electron precipitation
during sawtooth injections. Annales Geophysicae, European Geosciences Union, 2007, 25 (5),
pp.1199-1214. �hal-00318326�
© European Geosciences Union 2007
Geophysicae
Energetic electron precipitation during sawtooth injections
A. J. Kavanagh1,*, G. Lu1, E. F. Donovan2, G. D. Reeves3, F. Honary4, J. Manninen5, and T. J. Immel6
1High Altitude Observatory (HAO), National Center for Atmospheric Research (NCAR), P.O. Box 3000, Boulder, CO,
80307-3000, USA
2University of Calgary, 2500 University Drive NW, Calgary, Alberta, Canada 3Los Alamos National Laboratory, Los Alamos, New Mexico, USA
4Department of Communication Systems, Lancaster University, Lancaster, UK 5Sodankyl¨a Geophysical Observatory, T¨ahtel¨antie 62, 99600 Sodankyl¨a, Finland 6University of California at Berkeley, Space Science Lab, Berkeley, CA 94720, USA *now at: Department of Communication Systems, Lancaster University, Lancaster, UK
Received: 24 January 2007 – Revised: 3 May 2007 – Accepted: 21 May 2007 – Published: 4 June 2007
Abstract. We present simultaneous riometer observations
of cosmic noise absorption in the nightside and dawn-noon sectors during sawtooth particle injections during 18 April 2002. Energetic electron precipitation (>30 keV) is a fea-ture of magnetospheric substorms and cosmic radio noise absorption acts as a proxy for qualitatively measuring this precipitation. This event provides an opportunity to com-pare the absorption that accompanies periodic electron injec-tions with the accepted paradigm of substorm-related absorp-tion. We consider whether the absorption is consistent with the premise that these injections are quasi-periodic substorms and study the effects of sustained activity on the level of pre-cipitation. Four consecutive electron injection events have been identified from the LANL (Los Alamos National Labo-ratory) geosynchronous data; the first two showing that addi-tional activity can occur within the 2–4 h sawtooth periodic-ity. The first three events have accompanying absorption on the nightside that demonstrate good agreement with the ex-pected pattern of substorm-absorption: discrete spike events with poleward motion at the onset followed by equatorward moving structures and more diffuse absorption, correlated with optical observations. Dayside absorption is linked to gradient-curvature drifting electrons observed at geostation-ary orbit and it is shown that low fluxes can lead to a lack of absorption as precipitation is suppressed; precipitation be-gins when the drifting electron flux surpasses some critical level following continuous injections of electrons from the magnetotail. In addition it is shown that the apparent mo-tion of absorpmo-tion determined from an azimuthal chain of ri-ometers exhibits an acceleration that may be indicative of an energisation of the drifting electron population.
Correspondence to: A. J. Kavanagh
Keywords. Ionosphere (Auroral ionosphere) –
Magneto-spheric physics (Energetic particles, precipitating; Storms and substorms)
1 Introduction
During some geomagnetic storms geosynchronous satellites observe quasi-periodic changes in energetic particle fluxes (particularly protons but also electrons); these take the form of sharp increases followed by gradual decays observed across large local time ranges. The overall profile is a well defined “sawtooth” composed of particle injections occurring every 2–4 h (e.g. Borovsky et al., 2001; Henderson et al., 2002; Skoug et al., 2002; Huang et al., 2003a). These vari-ations occur at the same time as increased emissions from energetic neutral atoms in the inner magnetosphere, confirm-ing the sawtooth signature as multiple ion and electron in-jections (Reeves et al., 2003) rather than some local effect at the satellite. The sawtooth is associated with stretching and dipolarisation of the magnetic field and displays sim-ilar characteristics to periodic substorms (e.g. Borovsky et al., 1993; Belian et al., 1995) and in the past individual teeth have been studied as substorms (Henderson, 2004). Huang et al. (2003a) used observations from three geomagnetic storms to show that continuous energy transfer to the magnetosphere is necessary to maintain sawtooth behaviour. They suggested that solar wind pressure oscillations excite a magnetospheric resonant state, which triggers substorms at the resonant fre-quency without the need for subsequent external triggers.
A number of authors have used riometer (Little and lien-bach, 1959) chains to provide a global picture of energetic electron precipitation related to substorms (Hargreaves et al.,
1975, 1997, 2001; Pytte el al., 1976; Ranta et al., 1981; Ranta et al., 1999). Riometers provide a simple means of monitoring the precipitation of energetic electrons (energy greater than ∼30 keV) via measurements of the cosmic ra-dio noise absorption (CNA), which has been recognised as a substorm phenomenon (Akasofu, 1968). CNA manifests in various time-dependent structures during the phases of a substorm both on the night and dayside. During the growth phase an equatorward drifting arc forms (Hargreaves et al., 1975; Ranta et al., 1981); this can contain pulsating forms (Ranta et al., 1999) and is linked to optical arcs (e.g. Jus-sila et al., 2004). At the expansion phase onset the region of CNA expands both poleward and equatorward, usually in the close to but pre-midnight sector. The change in propaga-tion character occurs close to ∼65◦magnetic latitude (Jelly, 1970). The poleward propagating CNA front tends to be a sharp enhancement whilst appearing more gradual at lower latitudes. Following onset the riometer absorption is usually highly correlated with near-equatorial >30 keV electron flux (Baker et al., 1981) indicating that the CNA is a result of strong pitch angle diffusion in the electron population that is freshly injected from the magnetotail.
Small scale structure also appears following the onset of the expansion phase, particularly the spike-event. Lasting 1– 2 min in duration spikes appear at the poleward edge of the surge and were thought to be caused by the motion of an elongated 10–50 km thick ribbon of absorption (e.g. Neilsen and Axford, 1977). Observations with imaging riometers have shown that the spike event is actually localised in nature with typical dimensions of 190×80 (167×74) km at L∼6 (∼13) (Hargreaves et al., 1997). The spikes typically dis-play a poleward motion at the start of an event with speeds from hundreds to thousands of ms−1. There is also usually
an associated east or westward motion, the latter being more prevalent (Spanswick et al., 2005). Stauning (1996) iden-tified a number (6–8 per hour) of localised discrete events which included some equatorward moving forms. The spike event also displays fine structure similar to magnetic Pi pul-sations suggesting a common source region for the modula-tion (e.g. Hargreaves et al., 2001; Aminaei et al., 2006).
As well as the north and southward motion the back-ground CNA displays azimuthal propagation (e.g. Harg-reaves, 1968). It is probable that this is linked with the motion of the injection region, but also the electrons will gradient-curvature drift eastward towards dawn (e.g. Ka-vanagh et al., 2002, and references therein). The elec-trons are quasi-trapped and experience pitch-angle scattering through whistler mode wave interactions (e.g. Kennel and Petschek, 1966) such that post midnight the CNA tends to be more diffuse and is less well correlated with optical mea-surements (e.g. Ansari, 1964). The eastward drift results in a day-side signature that has been termed slowly varying ab-sorption (e.g. Hargreaves and Berry, 1976; Hargreaves and Devlin, 1990; Stauning, 1996; Nishino et al., 1999); how-ever the slow-varying nature is often replaced by small scale
spatial and temporal changes including quasi-periodicities of 10s of minutes and occasionally displays modulation from geomagnetic pulsations such as field line resonances (e.g. Se-nior and Honary, 2003, and references therein).
A sawtooth event occurred on 18 April 2002; these injec-tions have previously been presented by a number of authors (e.g. Huang et al., 2003b; Lui et al., 2004; Clauer et al., 2006; Henderson et al., 2006) and have been identified as periodic substorms (mean recurrence time = 2.7 h), with accompa-nying phenomena in the magnetotail, inner magnetosphere and in ground magnetometer data. This study focuses on the energetic precipitation signature and considers the data in the context of past riometer observations of substorms. An overview of the whole event is provided with particular con-sideration of three of the identified “teeth”. Observations of CNA show overall agreement with the recognised features of substorm absorption though some unusual effects are high-lighted and explained in terms of the effects of sustained ge-omagnetic activity on the electron population.
2 Instrumentation
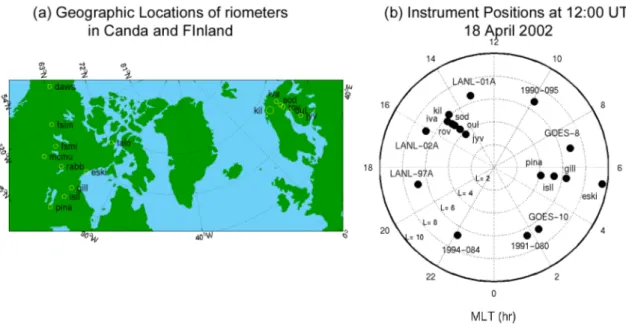
Observations of the precipitation of energetic electrons dur-ing this sawtooth event have been provided by selected sta-tions of the Global Riometer Array (GLORIA) in Canada and Finland. Riometers measure the absorption of cosmic radio noise produced by increased electron concentration in the D region of the ionosphere, caused by precipitating electrons with energy in excess of about 30 keV. Since these instru-ments only observe the height-integrated absorption no di-rect information on the precipitation spectrum can be ascer-tained, and consequently the riometers give only a qualitative measure of the level of precipitation. Figure 1a shows the ge-ographic locations of the riometers used in this study. Cana-dian data is supplied from what was the CANOPUS project (Rostocker et al., 1995); each of the stations is equipped with a broad beam (∼60◦), 30 MHz riometer (pointing to the zenith) as well as a 3-component fluxgate magnetome-ter, which provide data at 5 s resolution. The riometer data from Finland have been supplied by a chain of widebeam riometers, operated by Sodankyl¨a Geophysical Observatory (SGO), and from a widebeam instrument co-located with the Imaging Riometer for Ionospheric Studies (IRIS), operated by Lancaster University (UK) (Browne et al., 1995). IRIS data is taken at 1-s resolution but has been averaged to 5 s here and the SGO chain provides data at 1-min resolution. The data from those riometers that do not operate at 30 MHz have been corrected using the simplified assumption that the CNA is inversely proportional to the square of the operat-ing frequency (e.g. Hargreaves, 1969). Table 1 provides a complete list of the riometers stations and their AACGM (al-titude adjusted corrected geomagnetic) coordinates (Baker and Wing, 1989). The two sets of riometers are separated by approximately 9 h of magnetic local time (MLT) with the
Fig. 1. (a) Positions of the ground stations used in this study. The size of the circles represents approximate fields of view at 90 km altitude. (b) Orbital positions of the satellites at the magnetospheric equatorial plane, also shown are the projected positions of the SGO and Churchill line riometers using the IGRF model. Taloyaok is not plotted since the riometer is inside the polar cap and exposed to open field lines.
Table 1. List of riometers used in this study. Columns from left to right represent: the instrument name and the chain it belongs to (e.g. CAN=CANOPUS) instrument code, the magnetic coordinates (latitude and longitude), L shell and the operating frequency. All instruments are in the Northern Hemisphere.
Riometer (chain) Code Magnetic Coordinates (lat, longitude)
L-shell (Earth Radii)
Frequency (MHz)
Dawson (CAN) daws 66.10◦, 272.6◦ 6.09 30
Eskimo Point (CAN) eski 71.12◦, 332.0◦ 9.55 30
Fort McMurray (CAN) mcmu 64.64◦, 308.0◦ 5.45 30
Fort Simpson (CAN) fsim 67.57◦, 292.9◦ 6.87 30
Fort Smith (CAN) fsmi 67.72◦, 303.6◦ 6.96 30
Gillam (CAN) gill 66.65◦, 332.0◦ 6.36 30
Island lake (CAN) isll 64.25◦, 332.4◦ 5.30 30
Ivalo (SGO) iva 65.28◦, 108.6◦ 5.72 30
Jyv¨askyl¨a (SGO) jyv 59.13◦, 103.6◦ 3.80 32.4
Kilpisj¨arvi (IRIS) kil 66.10◦, 103.9◦ 6.09 38.2
Oulu (SGO) oul 61.82◦, 105.1◦ 4.48 30
Pinawa (CAN) pina 60.59◦, 330.8◦ 4.15 30
Rabbit Lake (CAN) rabb 67.36◦, 317.9◦ 6.75 30
Rovaniemi (SGO) rov 63.56◦, 106.4◦ 5.04 32.4
Sodankyl¨a (SGO) sod 64.18◦, 107.2◦ 5.27 30
Taloyoak (CAN) talo 78.83◦, 329.3◦ Polar cap 30
Finnish riometers being 2.6–3 h of MLT ahead of UT and the Canadian riometers lagging UT by 6.5 h.
Monitoring of less energetic precipitation has been pro-vided by the Far Ultra Violet (FUV) camera on board the IMAGE spacecraft (Mende et al., 2000). The energy of the particles that produce emission in the far UV (∼1–15 keV) overlaps the lower energy of those that produce some
cos-mic radio absorption in the ionosphere. More importantly the FUV instrument provides global maps of the auroral pre-cipitation such that the widely spaced point measurements of the riometers can be placed in context. The images that are shown in this paper have been processed to remove dayglow (e.g. Immel et al., 2000) and contributions from proton au-rora. Subsequently electron mean energies and fluxes have
−10 0 10 GSM B Y (nT) (a) −10 0 10 GSM B Z (nT) (b) 450 500 550 VSW (km/s) (c) 00 04 08 12 16 20 00 0 5 10 15 density (protons/cm −3 ) UT (h) (d)
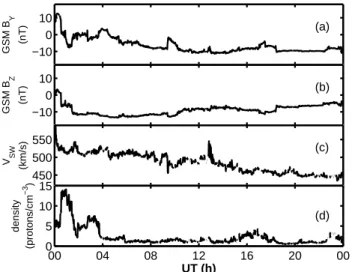
Fig. 2. Solar wind parameters from the ACE spacecraft: (a) IMF
BY in GSM; (b) IMF BZ in GSM; (c) solar wind speed; (d)
so-lar wind proton density. These data have been propagated to the bowshock via a minimum variance analysis technique.
been determined from the emission measurements (e.g. Frey et al., 2003).
Satellite borne instruments also provide observations of the corresponding magnetospheric variations during the saw-tooth event. The SOPA (Synchronous Orbit Particle An-alyzer) instrument, on board the LANL (Los Alamos Na-tional Laboratory) geostationary satellites, measures elec-tron fluxes from 50–26 000 keV; in this paper only the seven lower energy channels (50–315 keV) are used. The fluxes are spin averaged (1 min values) and provide clear indica-tions of when electron injecindica-tions occur at geostationary or-bit. Magnetic field measurements have been provided by two of the Geosynchronous Operational Environmental Satellites (GOES-8 and GOES-10), which carry twin-fluxgate magne-tometers (Singer et al., 1996). The measurements have been transformed into GSM (Geocentric Solar Magnetospheric) coordinates (Russell, 1971) and we have calculated the in-clination of the magnetic field relative to the GSM equato-rial plane. Table 2 lists the locations of the geostationary satellites used in this study, calculated using the IGRF-2000 model (Mandea et al., 2000), and Fig. 1b shows their loca-tions in McIlwain (dipole) L-Shells and MLT along with the equatorial projections of some of the riometer sites.
3 Observations
3.1 Overview
Solar wind data have been taken from ACE (Advanced Com-position Explorer) near the L1 point; the spacecraft was south of the ecliptic plane (between 7 and 19 RE)and 26–32 REin
the GSM Y direction. Figure 2 shows data from the
mag-100 102 104 106
LANL−01A
18 April 2002 − LANL geostationary Electron Fluxes
100 102 104 106 LANL−02A 100 102 104 106 LANL−97A 100 102 104 106
Spin Averaged Flux (electrons/cm
2/s/sr/keV) 1994−084 100 102 104 106 1991−080 00 02 04 06 08 10 12 14 16 18 20 22 100 102 104 106 UT (h) 1990−095
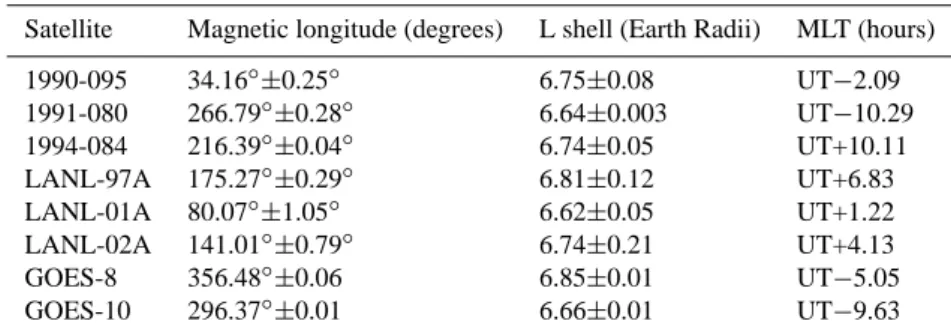
Fig. 3. Electron flux measured by the geostationary LANL satellites on 18 April 2002. The energy channels are 50–75 keV (blue), 75– 105 keV (green), 105–150 keV (red), 150–225 keV (cyan) and 225– 315 keV (magenta).
netic field (MAG) and solar wind (SWEPAM) instruments (Smith et al., 1998; McComas et al., 1998); the data have been time-shifted to the bowshock using a minimum vari-ance analysis technique based upon the work of Weimer et al. (2003). The top two panels (a–b) display the IMF BY and BZ components respectively; BY was predominantly
west-ward throughout the day except for an hour after midnight and BZwas mostly negative (southward), moving gradually
northward as the day progressed. Panel (c) shows the solar wind velocity, which generally slows as the day progresses. Proton density (d) drops from 14.4 to 0.9 cm−3by 05:50 UT, fluctuating between 0.5 and 4 cm−3 thereafter, resulting in dynamic pressure values of less than 1.5 nPa after 03:10 UT. Figure 3 shows the electron fluxes from the six LANL satellites that were operating during the storm. No data were available for LANL-97A and 1994-84 before 04:25 UT; how-ever, as many as nine injections were observed in the electron measurements when all satellites are considered. Decreases in the electron flux are followed by sharp increases resulting in the “sawtooth” profile. Dispersion in energy (e.g. 1990-095 at 12:00 UT) indicates that the observing satellite is out-side of the injection region and electrons gradient-curvature drift into the field of view.
Table 2. Satellites used in this study. Columns from left to right display the following: satellite name/number; mean magnetic longitude with maximum/minimum indication; mean L-shell with extremes indicated; magnetic local time in terms of universal time. These parameters have been calculated using the International Geomagnetic Reference Field model.
Satellite Magnetic longitude (degrees) L shell (Earth Radii) MLT (hours)
1990-095 34.16◦±0.25◦ 6.75±0.08 UT−2.09 1991-080 266.79◦±0.28◦ 6.64±0.003 UT−10.29 1994-084 216.39◦±0.04◦ 6.74±0.05 UT+10.11 LANL-97A 175.27◦±0.29◦ 6.81±0.12 UT+6.83 LANL-01A 80.07◦±1.05◦ 6.62±0.05 UT+1.22 LANL-02A 141.01◦±0.79◦ 6.74±0.21 UT+4.13 GOES-8 356.48◦±0.06 6.85±0.01 UT−5.05 GOES-10 296.37◦±0.01 6.66±0.01 UT−9.63
Figure 4a shows the CNA from five of the CANOPUS ri-ometers in the meridional Churchill Line; the low CNA at Taloyoak indicates that this riometer is in the polar cap for the entire day. The high geomagnetic activity on this day, caused by the prolonged southward (IMF), led to a maximum (peak = 9.6 dB) in the absorption oval close to Pinawa, (60.59◦N) with a daily mean absorption of 1.5 dB compared with 0.6 dB (peak = 5.2 dB) at Island Lake, the next highest. In Fig. 4b the data from the Finnish riometers are displayed; in this sec-tor absorption maximizes close to 63.6◦N (Rovaniemi: mean = 1 dB, peak = 8.6 dB). Some absorption spikes, correspond-ing to later injections, can be seen later in the day as the riometers approach local midnight. The relative weakness of the response in comparison with the Canadian riometers is readily explained if one examines the LANL data presented in Fig. 3; note that the flux increases associated with each injection post 16:00 UT are much smaller than the earlier in-jections.
For this study only three of the “teeth” are considered (be-tween 02:00 and 10:00 UT) to provide optimum configura-tion of the riometers. The CANOPUS instruments were in the night sector where they are most likely to respond to di-rect substorm precipitation, and the Lancaster/SGO riome-ters are in the morning sector (from dawn to noon) where dayside absorption tends to maximise (e.g. Kavanagh et al., 2004). In this section we present the observations related to each injection before discussing the implications of the day and night observations separately in Sect. 4 (Discussion). 3.2 Injection A: ∼03:22 UT
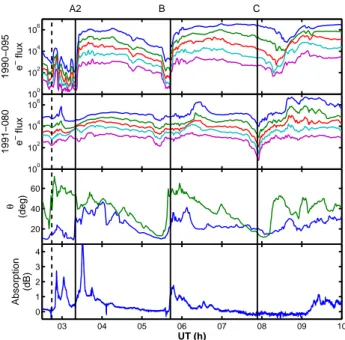
Figure 5 shows the selected injections during 18 April 2002. The top two panels display electron fluxes from the 1990-095 and 1991-080 spacecraft; the three vertical black lines (A, B and C) demonstrate the times of non-dispersed injections ob-served by the two satellites. The third panel shows the angle,
θ, between the vertical and horizontal (GSM) magnetic field components measured by GOES-8 (blue line) and GOES-10 (green line); in general lower angles indicate more stretched
field configurations. In the bottom panel the absorption from the Gillam riometer is displayed; relative locations of the in-struments can be seen in Fig. 1b.
The first marked injection is at 03:22 UT (from 1990-095) and occurred with a dipolarization at GOES-8 (1θ =20◦); however, some forty minutes before the sharp rise in elec-tron flux observed by 1990-095 there is a smaller, more vari-able flux enhancement (02:40 UT) consisting of four clear impulsive increases. This coincides with a rise in the flux at 1991-080 and a sharp (1θ =45◦) dipolarization in the
mag-netic field at GOES-10, though only a small increase in θ occurs at GOES-8. The IMAGE FUV camera also records an increase in emission; a V-shaped enhancement of a pre-existing arc structure at the dusk terminator (data not shown). The enhancement is orientated such that there are simultane-ous brightenings at high and low auroral latitudes. On the ground Gillam (Fig. 5, bottom panel) shows a sharp enhance-ment in the CNA close to the time of this injection (∼4 min later) followed by further enhancements. This riometer also records a large spike (∼3 dB) above a background of ∼1 dB absorption, shortly after the injection in the 1990-095 data at 03:22 UT. Around this time 1991-080 observes a dispersed flux signature, probably linked to the previous injection.
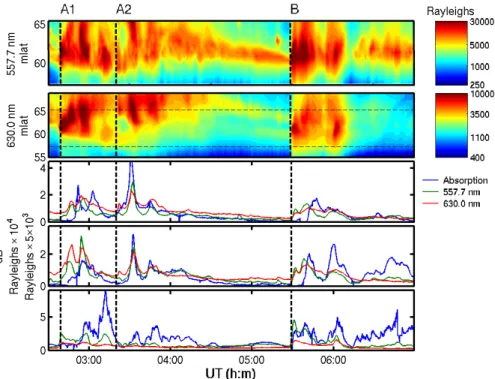
Figure 6 shows data from the Meridian Scanning Pho-tometer (MSP) located at Pinawa. The 557.7 nm (a) and 630.0 nm (b) emissions generally correspond to precipitation from electrons with energy of a few keV and <1 keV, respec-tively. Panels (c) to (e) compare CNA with the emission from the relevant latitudes for Gillam, Island Lake and Pinawa; several scan positions of the MSP have been averaged to ac-count for the larger field of view of the riometer. The ini-tial “tooth” (A) has been split into two and marked, with dashed lines A1 and A2, corresponding to the two injections. There is a quiet arc in the optical data which develops into an expansion onset at 02:38 UT expanding both poleward and equatorward from Pinawa and the CNA spike moves equa-torward. The absorption and optical signatures have simi-lar morphology, suggesting that the electrons producing the
20 00 04 08 12 16 MLT (h) 0 2 4 6 18 April 2002
(a) CANOPUS riometers −Churchill Line
talo, L = pc 0 2 4 6 eski, L = 9.6 0 2 4 6 Absorption (dB) @ 30 MHz gill, L = 6.4 0 2 4 6 isll, L = 5.3 00 02 04 06 08 10 12 14 16 18 20 22 24 0 2 4 6 UT (h) pina, L = 4.2 04 08 12 16 20 00 MLT (h) 0 2 4 6
(b) IRIS and SGO riometers
kil, L = 6.1 0 2 4 6 iva, L = 5.7 0 2 4 6 Absorption (dB) @ 30 MHz sod, L = 5.3 0 2 4 6 rov, L = 5.1 0 2 4 6 oul, L = 4.5 00 02 04 06 08 10 12 14 16 18 20 22 24 0 2 4 6 UT (h) jyv, L = 3.8
Fig. 4. (a) Cosmic noise absorption (CNA) from five of the Churchill line riometers. Corresponding L-shells are labelled; pc refers to “polar cap” where Taloyoak (talo) is on open field lines. The second x-axis demonstrates the average magnetic local time for the five riometers. (b) CNA from IRIS (kil) and the SGO riome-ters in the Finnish sector. All values of decibels (dB) are given for 30 MHz.
emission (∼1 keV) and those creating CNA (>30 keV) are being precipitated via the same mechanism.
100 102 104 106 1991−080 e − flux 20 40 60 θ (deg) 03 04 05 06 07 08 09 10 0 1 2 3 4 UT (h) Absorption (dB) 100 102 104 106 1990−095 e − flux A2 B C
Fig. 5. LANL, GOES and Gillam riometer data on the 18 April 2002 from 02:30 UT to 10:00 UT. The top two panels show the elec-tron fluxes from two of the LANL satellites near to the CANOPUS riometers; the energy channels are described in Fig. 3 caption. The third panel shows the elevation angle, θ , of the geomagnetic field recorded by the GOES 8 (blue line) and GOES 10 (green line). The bottom panel shows the auroral absorption measured by the Gillam riometer. The vertical black lines (marked A, B and C) demonstrate the approximate times of particle injections. The dashed, vertical black line notes the position of an additional dipolarization.
The evidence suggests that there are actually two injec-tions occurring within ∼40 min. Figure 7 shows the H component (northward) of the magnetometer stations in the Churchill line (no data were available from Taloyoak) af-ter subtraction of the daily mean. A negative bay is ob-served by the three most equatorward magnetometers with a largest change at Pinawa; the downward excursion be-gins at 02:38 UT (coincident with the onset of the optical brightening shown in Fig. 6) and reaches −255 nT (from 400 nT) at 02:57 UT before decreasing further to −410 nT by 03:12 UT. Following this is a second negative bay observed by all of the magnetometers and peaks at Gillam by 03:30 UT (from 400 nT to −700 nT). Figure 8 shows CNA recorded by the Fort Smith and Fort McMurray riometers, west of the Churchill line. Fort McMurray observes a sharp absorption increase at 02:44 UT which subsequently expands poleward to Fort Smith 3 min later. Figure 9 shows the data from the azimuthal chain of riometers. There is a small spike at Daw-son and a stronger response at Fort SimpDaw-son; these data seem to indicate a rapid eastward motion of the absorption at the same time as the poleward motion shown in Fig. 8.
Figure 10 presents the electron flux measured by LANL-01A and LANL-02A with the absorption from IRIS and the
Fig. 6. These data come from the meridian scanning photometer (MSP), located at Pinawa, on 18 April 2002. The top two panels show the two emissions: 557.7 nm (a) and 630.0 nm (b). The horizontal black lines in (b) denote the field of view of the 557.7 filter (lower altitude emission. The bottom three panels show data from Gillam (c), Island Lake (d) and Pinawa (e); adjacent latitude scans have been averaged to account for the larger beam sizes of the riometers. The three vertical, dashed lines represent the approximate times of the electron injections (A1, A2 and B). Reliable data were not available for substorm C.
SGO chain from 02:30 UT to 10:00 UT. There is a dispersed energy signature at LANL-01A (04:00 MLT) following A1 beginning at 02:45 UT, thus the riometers are outside of the injection region. The absorption at Kilpisj¨arvi occurs be-tween the peak fluxes at LANL-01A and LANL-02A rather than linked to the leading edge of the flux enhancement. There is an L-shell dispersion at the onset time of the ab-sorption, and the CNA at Rovaniemi and Sodankyl¨a is twice the magnitude of that at Kilpisj¨arvi (L=6.1).
A2 has a smaller response in the satellites but the riome-ters observe an increase in absorption some 11 min after the injection is recorded at 1990-095. This time the absorption is notable at Kilpisj¨arvi (∼2 dB) but is still significantly higher at Rovaniemi on occasions (e.g. at 04:05 UT). This absorp-tion decays to background levels by ∼05:10 UT. Jyv¨askyl¨a sees small increases (<1 dB) however the absorption is con-sistently low. It is worth noting at this point that the riome-ters are sensitive to particles that enter the loss cone and consequently precipitate into the ionosphere whereas SOPA measures electron fluxes at all pitch angles. Consequently, although similar structure may appear in the LANL and ri-ometer data, one would only expect a direct correspondence if there is strong pitch angle scattering of the electrons (e.g. Baker et al., 1981). At other times only a fraction of the elec-tron flux (depending on the effectiveness of the scattering
mechanism) measured by LANL is observed by the riome-ters.
3.3 Injection B: 05:40 UT
Injection B, observed by 1990-095 at ∼05:40 UT (Fig. 5), consists of a single flux enhancement of similar magnitude to the injection at 03:22 UT. Both GOES 8 (05:34 UT) and GOES 10 (05:32 UT) record a dipolarization of the mag-netic field. The riometer at Gillam witnesses a 2 dB rise at approximately the same time; this increase is smaller than the previous event and there is no easily discernable spike event. In this case the absorption displays a poleward motion (Fig. 6) that reflects the expected CNA response to the onset of a substorm (Hargreaves, 1974) and is consistent with the optical data. The changing ratio of the 557.7 nm emission to the CNA suggests that there is either a hardening of the pre-cipitation spectrum as time progresses (Fig. 6) or a change in the effectiveness of pitch angle scattering. The similarity of the structure suggests that the precipitating electrons are from the same source population. The magnetometer data (Fig. 7) also shows a poleward motion of the negative bay in the H component, starting at ∼05:30 UT.
Figure 11 consist of snapshots of the Ultra Violet (UV) emission (from IMAGE), taken at 2 min resolution and mapped onto a geographical and local time grid. The auroral
−500 0 500 eski −500 0 500 fchu −500 0 500 gill −500 0 500 isll 03:00 04:00 05:00 06:00 −500 0 500 UT (h:m) pina −500 0 500
18 April 2004 − Churchill Line H component (nT)
rank
A1 A2 B
Fig. 7. Magnetograms from six magnetometers in the Churchill line displaying the H component for 02:30 UT to 07:00 UT on 18 April 2004. Daily averages of the measurements have been subtracted from the data to highlight variations in the magnetic observations.
02:30 02:40 02:50 03:00 03:10 0 1 2 3 mcmu CNA (dB) UT (h:m) 0 1 2 3 fsmi CNA (dB) A1
Fig. 8. Cosmic Noise Absorption from the two riometers at Fort Smith and Fort McMurray, which comprise part of the second CANOPUS meridional chain. Once again the dashed vertical lines represent the estimated times of electron injections.
oval is quiet at 05:22 UT and the emission shows a small in-crease near 03:00 LT. At 05:30 UT there is an intense bright-ening at ∼23:00 LT which expands such that by 05:45 UT there is a clear auroral bulge at the northwest edge of the brightest emission.
LANL-01A is located at 06:50 MLT for injection B and records a distinct, non-dispersed injection at 05:40 UT (Fig. 10). LANL-02A sees a dispersed signature, begin-ning at 05:44 UT, placing the edge of the injection region between 06:50 and 09:50 MLT. There is an increase in
0 2 4 fsim CNA (dB) 0 2 4 fsmi CNA (dB) 03 04 05 06 07 08 09 10 0 2 4 UT (h) gill CNA (dB) 0 2 4 daws CNA (dB) A1 A2 B C
18 April 2002 − CANOPUS azimuthal riometer chain
Fig. 9. Cosmic Noise Absorption from the azimuthal chain of CANOPUS riometers (including Gillam). These riometers between magnetic latitudes of 66.1◦to 67.2◦. Vertical, dashed lines indicate estimated times of substorm onsets.
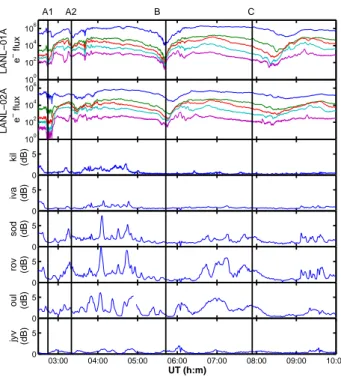
0 5 kil (dB) 0 5 iva (dB) 0 5 sod (dB) 0 5 rov (dB) 0 5 oul (dB) 03:00 04:00 05:00 06:00 07:00 08:00 09:00 10:00 0 5 UT (h:m) jyv (dB) 100 102 104 106 LANL−02A e − flux 100 102 104 106 LANL−01A e − flux A1 A2 B C
Fig. 10. Dayside observations of geostationary electron flux and riometer absorption in Finland. The vertical, solid lines show the timing of the onsets of the 4 injections. The top two panels show the electron flux (energy channels described in Fig. 3 caption) from satellites either side of the line of riometers. The bottom six panels show the morning absorption from IRIS (kil) and the SGO riome-ters.
Fig. 11. Maps of Northern Hemisphere FUV emission converted to electron energy flux (mW/m2)recorded by the camera on board the IMAGE satellite on 18 April 2002. These cover the onset of substorm B from 05:22 UT to 05:53 UT.
absorption at Jyv¨askyl¨a starting at 05:30 UT and peaking just after 06:00 UT (∼1.9 dB), but this riometer is situated at a point distant from the geosynchronous footprint. The tim-ing makes it extremely unlikely that this increase is directly associated with the injection and none of the other riome-ters observe an increase immediately following the injection. The LANL satellites (01A and 02A) observe further flux in-creases (beginning at 06:10 UT and 06:15 UT, respectively) which are dispersed in energy, the timing of which suggests that they are drift echoes of the initial injection (e.g. Reeves et al., 1990). The flux in the highest plotted energy channel of LANL-01A (225–315 keV) peaks first at 06:01 UT and the peak in the dispersed signature returns 27 min later. This is consistent with an estimate of the drift period of an equato-rially mirroring electron with energy of 256 keV in a dipole field. The riometers at Sodankyl¨a and Rovaniemi record in-creases in absorption starting at ∼06:30 UT, which is shortly after the rise in flux at LANL-01A. Kilpisj¨arvi does see a solitary increase, at 06:25 UT, associated with the rise in flux but nothing after that.
3.4 Injection C: ∼07:55 UT
A weak injection at 07:55 UT is clear in the 1991-080 measurements at ∼21:40 MLT (Fig. 5) followed by a
dis-Fig. 12. Maps of Northern Hemisphere FUV derived electron en-ergy flux (mW/m2) on 18 April 2002. These images run from 07:49 UT to 08:35 UT (four minute snapshots) and cover the appar-ent injection at 07:55 UT and the onset at 08:12 UT during evappar-ent C.
tinct dipolarization signature recorded by GOES-10 some 30◦ longitude towards midnight and 15 min later. The 1994-084 satellite also observes an increase at ∼07:55 UT (∼18:00 MLT) (see Fig. 3). Close to dawn the 1990-095 satellite shows dispersion as do the LANL-01A (∼09:15 MLT) and LANL-02A (∼12:00 MLT) satellites.
There is no absorption increase at Gillam associated with either the injection at 07:55 UT or the dipolarization at 08:12 UT and the electron flux is two orders of magnitude less than in the preceding injections. There is an absorp-tion enhancement at Gillam shortly after 09:05 UT, approx-imately an hour after the injection onset. This follows an increase in the flux at geostationary orbit (e.g. 1991-080). Riometers west of Gillam observe an increase in absorption at progressively earlier times (Fig. 9), though there is a thirty-five minute separation between the onset at Dawson and the response at Fort Simpson. LANL-02A and LANL-01A see dispersed signatures as the electrons gradient curvature drift into the dayside (Fig. 10) and at 09:06 UT the Finnish ri-ometers were close to noon and they observed an increase in absorption at the lower latitudes.
Figure 12 shows the UV emission at this time; a distinct, quiet auroral arc can be seen at 07:49 UT and no significant activity occurs until 08:12 UT when a distinct enhancement
appears in the pre-midnight sector. This expands predom-inantly westward with increased brightenings close to dusk by 08:22 UT. The enhancements remain confined between
∼17:00 LT and ∼01:00 LT and no significant increases in
emission are measured above the Churchill Line riometers. The increase in CNA that peaks at 08:30 UT at Dawson co-incides with a rise in the total flux recorded by 1991-080 to 5×10⁶, which is a factor of 30 greater than at 08:15 UT.
4 Discussion
4.1 Overview
On 18 April 2002 the magnetosphere displayed quasi-periodic injections of energetic particles from the magneto-tail to the inner magnetosphere (Fig. 3) during a geomagnetic storm. In general the storm led to increased ionisation in the D-layer that resulted in enhanced CNA. Figure 4 demon-strates that the absorption is high in both the Canadian and Finnish sectors and that the absorption oval has expanded in response to the solar-wind/IMF driving of the magneto-sphere. The absorption maximises at lower magnetic lati-tudes in Canada than in Finland by approximately 3–4 de-grees, in agreement with previous statistical studies of ab-sorption (e.g. Hargreaves, 1966, and references therein). A loss of absorption occurs at higher latitudes in Finland as the event progresses, somewhat at odds with the findings pre-sented by Hargreaves (1968) who determined that increases in activity are likely to shift the maximum absorption (which increases) to lower latitudes, but not to reduce the absorp-tion at higher latitudes. This is likely true in general when the increased absorption is driven by high solar wind speeds and pressure changes, but in this case the motion to lower latitudes is predominantly caused by an enlarged polar cap, associated with a long period of southern IMF BZ.
The absorption follows the diurnal pattern highlighted in statistical studies (e.g. Kavanagh et al., 2004, and references therein) such that there is a maximum occurrence of CNA in the morning sector and around midnight but a notable min-imum in the afternoon. There is a sustained enhancement at Pinawa between 15:00 and 23:00 UT (mean = 1.13 dB) which is possibly the result of a steady drizzle of radiation belt electrons at L=4, but this is not investigated here.
As well as the three main injections (A1, B and C) an-other has been identified (A2); this occurs some 40 min after A1. The timing of the observations makes it highly unlikely that this is caused by an expansion of the original dipolar region; this would result in a rapid acceleration of the expan-sion from 0.05◦s−1(delay between the GOES spacecraft) to 0.3◦s−1. It is possible that either A1 or A2 is actually a pseu-dobreakup (e.g. Koskinen et al., 1993) although much of the data suggest that they are substorms. It appears that follow-ing the auroral activation accompanyfollow-ing injection A1 growth continues away from the region of dipolarization (due to
con-tinued energy input from the solar wind) leading to a second injection and auroral enhancement (at A2). The break-up accompanying A2 starts at higher latitudes; the photometer (Fig. 6) and magnetometer (Fig. 7) data shows the auroral signature to begin at Gillam rather than Pinawa. Following injection A1, open magnetic flux is closed, shrinking the po-lar cap, and the dayside reconnection rate is insufficient to return the flux to the pre-substorm level before the next ex-pansion onset. Huang et al. (2003b) identified injection A1 as a substorm through observations by GEOTAIL (Kokubun et al., 1994) of a travelling compression region related to plas-moid formation in the magnetotail as well as observations of proton flux enhancements by 1991-080 (16:00 MLT).
These observations suggest that additional and/or more complicated activity may occur within the quasi-periodic 2– 4 h sawtooth timeframe. The cause for this particular devi-ation may be found in the solar wind conditions at the time (Fig. 2); BY was eastward (positive) at 02:48 UT
(account-ing for the delay to Earth) and then turned sharply westward (negative) before the second injection (A2); the first injection (A1) also corresponded with a rise in the dynamic pressure (1 nPa) above an already increased level. Conditions for sub-sequent injections were much more stable thus this “double event” may have been triggered by the more variable solar wind. Changes in the magnetospheric configuration might explain the reduced flux at some of the LANL satellites as the region of densest particle population moved across the satellites.
4.2 Nightside absorption (Canadian sector)
More insight into the dynamics of the particle precipitation may be gleaned from separate analyses of the night and day-side absorption signatures of the selected teeth. For the first 3 injections there are distinct examples of riometer absorp-tion related to substorm activity. There is a poleward mov-ing, weak onset at the Churchill line and a strong, poleward moving enhancement further west (Fig. 8) following injec-tion A1. This is followed by equatorward moving enhance-ments (∼10 min after the first) in agreement with the current paradigm of auroral absorption during substorms (e.g. Ranta et al., 1981) that is described in Sect. 1. After 02:45 UT the CNA propagates eastward from a small spike at Dawson (Fig. 9) consistent with past observations of the substorm on-set in absorption. Thus A1 has some of the general features of a “standard” absorption substorm but whether a growth phase absorption bay exists is difficult to assess due to the short timescales between intense activity-onsets. An inter-esting aspect to this injection is the structure of the geosyn-chronous flux enhancements; the injections are short lived (∼8 min in duration) and this may be the controlling factor behind the short duration of the CNA enhancements. In this case they would not be spike events in the classical sense (e.g. Hargreaves et al., 1997); rather they are the direct pre-cipitation of short-lived injection bursts from the tail.
The second injection (A2), at ∼03:20 UT, has a well-defined equatorward moving CNA spike (Fig. 6), which de-creases in magnitude as it moves south. The time differ-ence between the dipolarization at GOES-8 and the spike at Gillam is 11 min (separated by 24.48◦ longitude), whereas during A1 it is ∼5 min from GOES-10 to the first poleward moving spike (11.62◦ separation). Thus there is time for a poleward propagating spike event to form outside of the field of coverage, possibly poleward and/or eastward of the riome-ters. Thus this absorption fits the substorm paradigm as well, including absorption that correlates well with the diffuse op-tical signature (e.g. Ansari, 1964). Westward motion of ab-sorption before midnight, as seen in A2 (Fig. 9), is a feature of the global pattern of absorption motion defined by Harg-reaves (1968). This type of motion shall be investigated with respect to injection B with the additional available diagnos-tics but is more a function of the location of the riometers within the injection region than a local time phenomenon.
For the third injection, B, at ∼05:30 UT there is a poleward progression of a sharp onset (though not a clearly defined spike) that begins at Pinawa and is generally well correlated with the optical signature (Fig. 6). The decline in the ratio of the 557.7 nm emission to absorption indicates either that the spectrum of precipitation hardens or else the effectiveness of the pitch angle scattering increases. After ∼06:20 UT the slowly varying absorption structure (at Island Lake) suggests that it is related to drifting electrons of higher energy than those responsible for the discrete spikes (second category of absorption from Ansari, 1964).
The westward expansion of absorption (Fig. 9) from 05:40:50 UT to 05:47:25 UT moves with a velocity of
∼0.15◦s−1. It is unlikely that gradient-curvature drifting
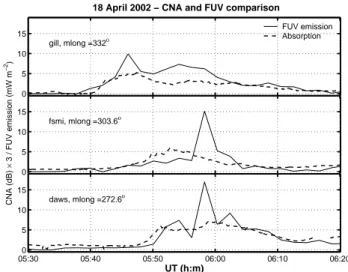
ions precipitate with enough intensity to produce the 1–2 dB absorption since the apparent motion suggests that the lead-ing edge of driftlead-ing ions would have energy of ∼150 keV, leading to E-region deposition. Figure 13 shows time se-ries from three pixels of the FUV camera corresponding to the locations of the Dawson, Fort Smith and Gillam riome-ters. The rise time of the emission (converted to electron energy flux) closely matches the absorption at the three lo-cations suggesting that either the low energy electrons are moving with the same drift speed in the magnetosphere as the higher energies or else the precipitation is caused by some form of trigger moving independently of the particle drift speed. The apparent speed of the absorption (corre-sponding to ∼6.6 km s−1in the F region ionosphere) is much
higher than the typical convection speeds of a few hundred metres per second and the convection pattern derived from AMIE (Assimilative Mapping of Ionospheric Electrodynam-ics) (Richmond and Kamide, 1988) shows that the westward motion of absorption is within a region of eastward con-vection (pattern not shown) Hargreaves (1968) suggests that a fast mode magneto-sonic wave, propagating azimuthally from the midnight sector could trigger precipitation of an extant population of electrons. For this to occur the
elec-0 5 10 15 CNA (dB) × 3 / FUV emission (mW m −2) fsmi, mlong =303.6ο 05:300 05:40 05:50 06:00 06:10 06:20 5 10 15 UT (h:m) daws, mlong =272.6ο 0 5 10 15 gill, mlong =332ο
18 April 2002 − CNA and FUV comparison
FUV emission Absorption
Fig. 13. Comparison of cosmic noise absorption with the electron energy flux derived from the FUV emission from closest pixel of the camera following Injection B on 18 April 2002. The stations, Gillam to Dawson, run east to west, respectively, and show the ap-parent westward motion of both the FUV emission and the CNA. The magnetic longitudes are marked on the plots.
tron flux must be above the critical stable trapping limit (e.g. Coroniti and Kennel, 1970) but here, the time between injec-tion and precipitainjec-tion is too short for the electron populainjec-tion to have increased following gradient curvature drift. A more likely explanation is that the apparent westward motion rep-resents an expansion of the injection region where electrons are injected at progressively earlier local times (e.g. Thomsen et al., 2001).
Observations during the final injection, C, provide con-flicting information of when the onset of the potential sub-storm occurs. The 1991-081 and 1994-084 satellites record sharp injection fronts close to 07:57 UT (at ∼18:00 MLT and
∼21:45 MLT, respectively). The proton fluxes from the
satel-lites also suggest a pre-08:00 UT injection (data not shown). However the GOES-10 magnetometer measures a dipolar-ization at 08:10 UT and the dispersed electron fluxes from the 02A, 01A and 095 spacecraft also suggest an injection closer to 08:10 UT. This later estimate ties in with the ob-servations from the GEOTAIL satellite, as described by Lui et al. (2004), which observes a travelling compression region (TCR) related to a plasmoid at 08:15 UT when the spacecraft is ∼26 RE down tail; however, since GEOTAIL is in the tail
lobe at this time (ZGSM=7.6 RE)there will be a propagation
delay between the passage of the plasmoid and the obser-vation of the TCR. Thus connecting the timing of the TCR with the injection at geosynchronous orbit is difficult. The FUV camera (Fig. 12) records no enhanced emission at the time of the initial injection but does observe a strong onset at 08:12 UT; this softer precipitation is predominantly confined to the dusk-midnight sector. During an injection the auroral
precipitation lies within the injection region but it cannot be reliably used as an identifier for the boundary of the injec-tion region. In this case it suggests that the dipolarizainjec-tion region is heavily skewed towards dusk and this is reinforced by the observations from GOES 8 (at 03:00 MLT), which show no dipolarization at all. The explanation for this dis-crepancy in timing is not clear, although close inspection of the electron flux data from 1991-080 and 1994-084 suggest that the initial rise is followed by a slightly larger increase at
∼08:12 UT. The same is true of the proton flux: a small
in-crease at ∼07:56 UT, which peaks at 08:05 UT, followed by a decline and a second enhancement at 08:10 UT. Therefore it appears that there are two separate impulsive injections; the first is not accompanied by a dipolarization and results in low fluxes; the second is a sustained injection after the first rise and consists of higher fluxes of electrons. Thus the second in-jection accompanied an apparent substorm onset as identified from other signatures, although the dipolarization/injection region was confined in longitude to the dusk-midnight sec-tor.
Most of the riometers were outside of the asymmetric injection region and consequently observed no absorption response. The rise in absorption after 08:10 UT suggests that Dawson is within the injection region. The following eastward expansion of the CNA spreads to Fort Simpson at 08:52 UT, Fort Smith by 08:59 UT and arrives at Gillam by 09:06 UT; this represents an apparent acceleration of the av-erage absorption motion from 0.01◦s−1through 0.03◦s−1to 0.06◦s−1. Although the instruments are most likely on dif-ferent drift paths the radial separation cannot explain the tim-ing of the CNA onset; one would expect a swifter response at Fort Smith and a longer delay at Gillam. A duskward elec-tric field would lead to energisation of the drifting electrons in this time sector leading to an overall increase in the energy of electrons most responsible for absorption,. Conserving the first adiabatic invariant the energy increase is in the longitu-dinal direction leading to lower pitch angles and increased precipitation (Pellinen and Heikkila, 1984). This would lead to an increase in the gradient-curvature drift speed but should also result in an increase in absorption; the observed reduc-tion could be a consequence of the radial distribureduc-tion in the flux of electrons where the flux is highest at the L-shell con-nected to Dawson. Alternatively the reduction could be at-tributed to either an overall loss of flux at progressively later local times or a change from strong to weak pitch angle diffu-sion. It is currently impossible to determine the exact cause with the available data. However, the absorption structure at Fort Simpson is similar to that at Dawson but changes con-siderably at the other riometers, indicative of the precipita-tion spectrum is changing.
The CNA peak at Dawson occurs with a sharp, disper-sionless, rise in the electron flux observed by 1991-080 (see Fig. 5); the total electron flux (50–315 keV) rose by over an order of magnitude from 08:15 UT (∼×30) to 08:45 UT. The non-dispersed nature of the signature suggests that this is an
additional injection of particles rather than a drift echo of the previous injection. Although the sharp rise is not apparent in the other spacecraft a small dispersed signature appears some 45 min later at 1990-095 (∼×30 flux increase from 105to 3.5×10⁶at ∼09:12 UT). This increase seems to trig-ger the precipitation of drifting electrons that had been stably trapped even after the injection closer to 08:00 UT.
Kennel and Petschek (1966) suggested that in order for precipitation to begin whistler mode wave turbulence must occur. This only happens when the flux of electrons on a field line surpasses a critical level. Thus, it would appear that the electron flux injected between L=4 and L=9 is initially too low to produce precipitation. Ongoing injections raise the level of electron flux and lead to eventual precipitation. The meridional chains of riometers demonstrate a lack of L-shell dispersion in agreement with the non-dispersed electron flux signature. This places the eastward edge of this injection region between Fort Smith and 1990-095.
4.3 Dayside absorption (Finnish sector)
In the morning sector the first two injections (A1 and A2) produce fairly typical results: Dispersed signatures are ob-served at geostationary orbit by LANL-01A and LANL-02A and the CNA displays L-shell dispersion at onset. This is consistent with the effects of gradient-curvature drift, which predicts that particles on a higher L-shell should reach a par-ticular longitude earlier than particles of the same energy at lower L-shells (e.g. Kavanagh et al., 2002, and references therein). The spike-like enhancements in CNA in the day-side ionosphere are not the same phenomenon as night-day-side spikes related to the substorm onset/injection. As the precip-itation event progresses the L-shell dispersion disappears and much of the structure appears to be either coincident across L-shells or sometimes leading in the equatorward riometers. This may be attributed to the changing dominant energy com-bined with continuous injections over large regions of MLT. Another possibility is that some local effect in the magne-tosphere is modulating the precipitation, such as interaction with a ULF wave (e.g. Coroniti and Kennel, 1970); this will be the subject of a future paper. It can be inferred from the higher absorption at lower latitudes at this time that either higher electron fluxes were present at lower L shells or else greater pitch angle scattering into the loss cone occurred. It is important to note that the flux measurements were made at some distance from the riometer sites (see Table 2) and that the relationship between electron-flux at geostationary orbit and riometer data from the dayside ionosphere is complex. Baker et al. (1981) demonstrated that the flux-absorption re-lationship is heavily dependent on the strength of the pitch-angle diffusion, even when the flux is above the Kennel-Petschek limit. In addition the LANL satellites provide a snapshot of the flux in the radiation belts at geosynchronous orbit and so are not directly comparable (in time and struc-ture) with measurements of CNA away from the footprint.
For injection B LANL-01A was in the electron injec-tion region at 05:40 UT, as evidenced by the dispersion-less signature. 1990-095 was also in the injection region (Fig. 5) and showed similar timing of injection to LANL-01A but with larger flux values; for example the flux of elec-trons between 75 and 105 keV ranged from 5 to 15 times greater at 1990-095 than at LANL-01A. This is either a dif-ference in the nature of the injection region across MLT or else LANL-01A is connected to a different drift path than 1990-095 (Table 2 shows that the satellites are on different dipole L-shells). An analysis of the dispersed signature at LANL-02A places the eastern boundary of the injection at
∼07:00 MLT; therefore the Finnish riometers are close to
the injection region (∼08:30 MLT) but only the two lowest latitude instruments (Oulu and Jyv¨askyl¨a) observe absorp-tion enhancements with a response at 05:55 UT. The lack of CNA at the time of the injection is likely related to the low electron flux observed at LANL-01A (1 h of MLT west of the riometer site). In this case, although there is injec-tion of electrons across a wide range of MLT as indicated by the geosynchronous satellites the precipitation region is narrower, confined to the more westward portion of the in-jection region over Canada. The flux continues to increase at LANL-01A such that by 06:00 UT the levels are compara-ble with those at 1990-095 at the time of the injection. With no direct measurement of the injection region available at lower latitudes it is difficult to be certain of the cause of the delayed response at Oulu and Jyv¨askyl¨a, however a slow re-sponse is expected at lower latitudes where the drift speed is lower than at higher L-shells. It is not until 06:24 UT (almost an hour after injection) that Kilpisj¨arvi records a response; this is an isolated increase (∼1 dB) followed by some weaker structure <0.8 dB. The increased absorption south of Ivalo (maximum at Rovaniemi and extending beyond Oulu) oc-curs at a similar time to the drift echo in the LANL-01A data, which has raised the total flux (50–315 keV) by a factor of 3 to 1.8×10⁶ electrons cm−2s−1sr−1keV−1since 06:00 UT. Of course the LANL satellites are separated from the L-shell of Rovaniemi by ∼1.6 RE and the weaker response at
Kilpisj¨arvi (1L∼0.5 RE) suggests that the electron flux is
somewhat higher at L=5 than at geostationary orbit. Jelly and Brice (1967) found that the fluxes of electrons in the inner magnetosphere following periods of low geomagnetic activ-ity (∼12 h) were insufficient to produce dayside precipitation even after injections from small substorms. It seems that the same effect can be produced during periods of sustained ac-tivity such as this sawtooth event (average Kp=6 since the
CME impacts on 17 April 2002) when the loss of electrons is increased and precipitation is only triggered once continu-ous (or secondary) injections have raised the electron flux on a given drift shell beyond the stable trapping limit (Kennel and Petshcek, 1966).
The rise-time of absorption when compared to the elec-tron flux signatures at the LANL spacecraft suggests that it is most associated with electrons of energy in ex-cess of 100 keV. The flux of 105–150 keV electrons sur-passed 4×104cm−2s−1sr−1keV−1 shortly before the ab-sorption increase (at Rovaniemi) peaking at 06:53 UT at 1.1×105cm−2s−1sr−1keV−1. The peak flux levels at LANL-01A during injection A2 are of similar values to this peak and notably Kilpisj¨arvi responded to A2 but not B. Ac-cording to Kennel and Petschek (1966) the stably trapped limit (for electrons >40 keV) increases as the particles ap-proach noon, thus a higher particle flux is required to initiate precipitation.
The final injection, C, was heavily confined to the dusk-midnight sector. The 50–75 keV electron flux at LANL-01A rises by a factor of 4 (to 7×105cm−2s−1sr−1keV−1)
between 08:55 and 09:08 UT. Since absorption increases at 09:05 UT this suggests that the injection at 08:12 UT was sufficient to instigate precipitation at the SGO riome-ters on the dayside and the CNA is predominantly caused by electrons greater than 50 keV. The timing of the on-set at Gillam and Ivalo is most likely coincidental since the electron flux on the relevant drift path for Gillam only reached the critical level following the secondary injection at 08:31 UT. Therefore it seems that the electron flux at lower L shells (L<5.7) is high enough to trigger precipita-tion. The lack of a response at Kilpisj¨arvi is indicative of the lower fluxes at higher L-shells over Finland: for the low-est energy channel compare 7×105cm−2s−1sr−1keV−1 at LANL-01A with 5×106cm−2s−1sr−1keV−1 at 1991-080;
the pre 08:31 UT flux level at 1991-080 is more comparable (2×105cm−2s−1sr−1keV−1).
Thus higher absorption is confined to the ionosphere that is linked to regions of the inner magnetosphere. Consequently, it can be inferred that electron fluxes remain high at lower lat-itudes (L<5), possibly aided by radial diffusion over the pre-ceding hours. At higher latitudes many of the drifting elec-trons are being lost, probably through a mixture of precipita-tion between Canada and Europe and the open drift paths of some of the electrons, carrying them to the magnetopause.
5 Summary and conclusions
Observations of CNA during a quasi-periodic sawtooth event have been presented for the first time. Data have been used from an extensive network of riometers (GLORIA) that cov-ers the Canadian and northern European sectors. Night side observations during the first four injections show that the sawtooth event is consistent with the expected precipita-tion pattern from a series of quasi-periodic substorms. For the first two injections L-shell dispersion of CNA was ob-served on the dayside, consistent with the effects of curvature drift; this effect disappears such that gradient-curvature drift is no longer the dominant mechanism in
determining the apparent absorption motion. Following the latter two injections CNA is not observed until over an hour later; this is likely caused by the drifting electron flux being below the stable-trapping limit; continuous or secondary in-jections add more electrons onto the drift shells such that the electron flux is increased sufficiently to produce precipitation on the drift echo.
Following the third injection a case of westward moving absorption in the pre-midnight sector has been identified. Al-though this motion is matched by the lower energy precipi-tation recorded by FUV the speed of motion rules out E×B drift as the mechanism. Instead we suggest that it is an az-imuthal expansion of the injection region such that the pre-cipitation trigger is moving westward and the motion of the electrons in the magnetosphere is still eastward. This may explain other instances of westward motion that have been identified by past authors in the global pattern of absorption motion.
Observations of CNA following the fourth injection show that the azimuthal motion of absorption across a relatively large base line varies in speed (in this case it accelerates). This may be caused either by a change in the dominant en-ergy of precipitation related to the particles that are being continually injected from the magnetotail or through acceler-ation of the electron populacceler-ation in the duskward convection electric field. It is impossible to be certain without direct measurements of the precipitation spectrum even though it does reinforce past observations of hardening spectra on the dayside as absorption events progressed. Therefore large un-certainties and errors will arise when widely spaced riome-ters are used to estimate the energy or drift speed of the elec-tron population that contributes to the precipitation.
Finally, an important point relating to the sawtooth injec-tions should be considered. The first two injecinjec-tions are sep-arated by ∼40 min rather than the 2–4 h that usually charac-terise the sawtooth injections, although this may be an ex-ample of a single complex response to the continuing en-ergy input to the magnetosphere within the quasi-periodicity. Each signature in the LANL data is accompanied by a dipo-larization in at least one of the GOES satellites and has corre-sponding ground signatures suggestive of possible substorm activity. It appears that the growth phase is continuing away from and after the initial onset resulting in an expansion. The short time separation may be due to triggering by variable so-lar wind conditions (IMF BY and dynamic pressure) before
it settled into the more stable configuration that accompanied the remainder of the injections.
Acknowledgements. The CANOPUS instrument array was
con-structed, maintained and operated by the Canadian Space Agency, and provided riometer, magnetometer and optical data for this study. The Imaging Riometer for Ionospheric Studies (IRIS) is operated by the Department of Communication Systems at Lancaster University (UK) in collaboration with the Sodankyl¨a Geophysical Observatory and funded by the Particle Physics and Astronomy Research Coun-cil (PPARC). Thanks to S. R. Marple and E. Spanswick for
process-ing the IRIS and CANOPUS riometer data, respectively. We are grateful to H. Singer and the Space Environment Center for sup-plying the GOES data via CDAWeb. ACE data were provided via OMNIWeb. IMAGE FUV analysis is supported by NASA through Southwest Research Institute subcontract number 83820 at the Uni-versity of California, Berkeley, contract NAS5-96020. G. Lu was supported by NASA SEC theory and Guest Investigator programs. A. J. Kavanagh is grateful to NSF/NCAR/HAO for support through a Postdoctoral fellowship from the HAO Visitors Committee.
Topical Editor I. A. Daglis thanks C. R. Clauer and another ref-eree for their help in evaluating this paper.
References
Akasofu, S.-I.: Polar and Magnetospheric substorms, D. Reidel, Holland, 1968.
Aminaei, A., Honary, F., Kavanagh, A. J., Spanswick, E., and Vil-janen, A.: Characteristics of night-time absorption spike events, Ann. Geophys., 24, 1887–1904, 2006,
http://www.ann-geophys.net/24/1887/2006/.
Ansari, Z. A.: The aurorally associated absorption of cosmic noise at College Alaska, J. Geophys. Res., 69, 4493–4513, 1964. Baker, D. N., Stauning, P., Hones, E. W., Higbie, P. R., and Belian,
R. D.: Near equatorial high resolution measurements of electron precipitation at L≈6.6, J. Geophys. Res., 86, 2295–2313, 1981. Baker, K. B. and Wing, S.: A new magnetic coordinate system for
conjugate studies at high latitudes, J. Geophys. Res., 94, 9139– 9143, 1989.
Belian R. D., Cayton, T. E., and Reeves, G. D.: Quasi-periodic global substorm generated flux variations observed at geosyn-chronous orbit, in: Space Plasma: Coupling between small and medium scale processes, Geophys. Monogr. Ser., 86, edited by: Ashour-abdalla, M., Chang, T., and Dusenbery, P., 143–148, AGU, 1995.
Borovsky, J., Nemzek, R. J., and Belian, R. D.: The occurrence rate of magnetospheric-substorm onsets: Random and periodic substorms, J. Geophys. Res., 98, 3807–3813, 1993.
Borovsky, J. E., Thomsen, M. F., Reeves, G. D., Liemohn, M. W., Kozyra, J. U., Clauer, R., and Singer, H. J.: Global sawtooth os-cillations of the magnetosphere during large storms, EOS Trans. Amer. Geophys. Soc., 82(47), F1077, 2001.
Browne, S., Hargreaves, J. K., and Honary, B.: An Imaging Riome-ter for Ionospheric Studies, Elect. Comm. Eng. J., 7, 209–217, 1995.
Clauer, C., R., Cai, X., Welling, D., DeJong, A., and Henderson, M. G.: Characterising the 18 April 2002 storm-time sawtooth events using ground magnetometer data, J. Geophys. Res., 111, A04S90, doi:10.1029/2005JA011099, 2006.
Coroniti, F. V. and Kennel, C. F.: Electron Precipitation Pulsations, J. Geophys. Res., 75, 1279–1289, 1970.
Frey, H. U., Mende, S. B., Immel, T. J., Gerard, J.-C., Hubert, B., Habraken, S., Spann, J., Gladstone, G. R., Bisikalo, D. V., and Shematovich, V. I.: Summary of quantitative interpretation of IMAGE far ultraviolet auroral data, Space Sci. Rev., 109(1), 255–283, 2003.
Hargreaves, J. K.: On the variation of auroral radio absorption with geomagnetic activity, Planet. Space. Sci., 14, 991–1006, 1966. Hargreaves, J. K.: Auroral Motions Observed with Riometers:
Phys., 30, 1461–1470, 1968.
Hargreaves, J. K.: Auroral Absorption of HF Radio Waves in the Ionosphere: A Review of Results from the First Decade of Ri-ometry, Proc. IEEE, 57, 1348–1373, 1969.
Hargreaves, J. K.: Dynamics of Auroral Absorption in the Midnight Sector – The Movement of Absorption Peaks in Relation to the Substorm Onset, Planet. Space Sci., 22, 1427–1441, 1974. Hargreaves, J. K., Browne, S., Ranta, H., Ranta, A., Rosenberg,
T. J., and Detrick, D. L.: A study of substorm associated night-side spike events in auroral absorption using imaging riometers at South Pole and Kilpisj¨arvi, J. Atmos., Sol. Terr. Phys., 59, 853–872, 1997.
Hargreaves, J. K., Chivers, H. J. A., and Axford, W. J.: Develop-ment of substorm in auroral radio absorption, Planet Space Sci., 23, 905–911, 1975.
Hargreaves, J. K. and Berry, M. G.: The eastward movement of the structure of auroral radio absorption events in the morning sector, Ann. Geophys., 32, 401–406, 1976,
http://www.ann-geophys.net/32/401/1976/.
Hargreaves, J. K. and Devlin, T.: Morning Sector electron precipi-tation events observed by incoherent scatter radar, J. Atmos. Terr. Phys., 52, 193–203, 1990.
Hargreaves, J. K., Ranta, A., Annan, J. D., and Hargreaves, J. C.: Temporal Fine Structure of nighttime spike events in auroral ra-dio absorption, studied by wavelet method., J. Geophys. Res., 106, 24 621–24 636, 2001.
Henderson, M. G.: The May 2–3 1986 CDAW-9C inter-val: A sawtooth event, Geophys. Res. Lett., 31, L11804, doi:10.1029/2004GL019941, 2004.
Henderson, M. G., Reeves, G. D., Skoug, R., Thomsen, M. F., Denton, M. H., Mende, S. B., Immel, T. J., Brandt, P. C., and Singer, H. J.: Magnetospheric and auroral activity during the 18 April 2002 sawtooth event, J. Geophys. Res., 111, A01S90, doi:10.1029/2005JA011111, 2006.
Henderson, M. G., Friedel, R. H., Skoug, R. M., Jahn, J. M., Mende, S. B., Immel, T. J., Ingraham, J., Cayton, T. E., and Thomsen, M. F.: Simultaneous multipoint Observations of stormtime sub-storms with the CLUSTER, IMAGE, POLAR, geosynchronous and GPS satellites, EOS Trans. Amer. Geophys. Soc., 83(19), S287, 2002.
Huang, C.-S., Reeves, G. D., Borovsky, J. E., Skoug, R. M., Pu, Z. Y., and Le, G.: Periodic magnetospheric substorms and their relationship with solar wind variations, J. Geophys. Res., 108, 1255, doi:10.1029/2002JA009704, 2003a.
Huang, C.-S., Foster, J. C., Reeves, G. D., Le, G., Frey, H. U., Pol-lock, C. J., and Jahn, J.-M.: Periodic magnetospheric substorms: Multiple space-based and ground-based instrumental observa-tions, J. Geophys. Res., 108, 1411, doi:10.1029/2003JA009992, 2003b.
Immel, T. J., Craven, J. D., and Nicholas, A. C.: An empirical model of the OI FUV dayglow from DE-1 images, J. Atmos. Solar. Terr. Phys., 62(1), 47–64, 2000.
Jelly, D. H.: On the morphology of auroral absorption during sub-storms, Can. J. Phys., 48, 335–345, 1970.
Jelly, D. H. and Brice, N. M.: Changes in van Allen radiation as-sociated with polar substorms, J. Geophys. Res., 72, 5919–5931, 1967.
Jussila, J. R. T, Aikio, A. T., Shalimov, S., and Marple, S. R.: Cos-mic radio noise absorption events associated with equatorward
drifting arcs during a substorm growth phase, Ann. Geophys., 22, 1675–1686, 2004,
http://www.ann-geophys.net/22/1675/2004/.
Kavanagh, A. J., Honary, F., McCrea, I. W., Donovan, E., Wood-field, E. E., Manninen, J., and Anderson, P. C.: Substorm related changes in precipitation in the dayside auroral zone – a multi in-strument case study, Ann. Geophys., 20, 1321–1334, 2002, http://www.ann-geophys.net/20/1321/2002/.
Kavanagh, A. J., Kosch, M., Honary, F., Senior, A., Marple, S. R., Woodfield, E. E., and McCrea, I. W.: The statistical dependence of auroral absorption on geomagnetic and solar wind parameters, Ann. Geophys., 22, 877–887, 2004,
http://www.ann-geophys.net/22/877/2004/.
Kennel, C. F. and Petschek, H. E.: Limit on stably trapped particle fluxes, J. Geophys. Res., 71, 1–28, 1966.
Kokubun, S., Yamamoto, T., Acuna, M. H., Hayashi, K., Shiokawa, K., and Kawano, H.: The Geotail Magnetic Field Experiment, J. Geomag. Geoelectr., 46, 7–21, 1994.
Koskinen, H. E. J., Lopez, R. E., Pellinen, R. J., Pulkkinen, T. I., Baker, D. N., and B¨osinger, T.: Pseudobreakup and substorm growth phase in the ionosphere and magnetosphere, J. Geophys. Res., 98, 5801–5814, 1993.
Little, C. G. and Leinbach, H.: The riometer: a device for the con-tinuous measurements of Ionospheric absorption, Proc. IRE, 37, 315–320, 1959.
Lui, A. T. Y., Hori, T., Ohtani, S., Zhang, Y., Zhou, X. Y., Hender-son, M. G., Mukai, T., Hayakawa, H., and Mende, S. B.: Magne-totail behaviour during storm time “sawtooth injections”, J. Geo-phys. Res., 109, A10215, doi:10.1029/2004JA010543, 2004. Mandea, M. and Macmillan, S.: International Geomagnetic
Refer-ence Field – the eighth generation, Earth, Planets and Space, 52, 1119–1124, 2000.
Mende, S. B., Heetderks, H., Frey, H. U., Lampton, M., Geller, S. P., Abiad, R., Siegmund, O., Tremsin, A. S., Spann, J., Dougani, H., Fuselier, S. A., Magoncelli, A. L., Bumala, M. B., Murphree, S., and Trondsen, T.: Far ultraviolet imaging from the IMAGE spacecraft: 2. Wideband FUV imaging, Space Sci. Rev., 91, 271– 285, 2000.
McComas, D. J., Bame, S. J., Barker, P., Feldman, W. C., Phillips, J. L., Riley, P., and Griffee, J. W.: Solar Wind Electron Proton Alpha Monitor (SWEPAM) for the Advanced Composition Ex-plorer, Space Sci. Rev., 86, 563–612, 1998.
Nielsen, E. and Axford, W. I.: Small-scale auroral absorption events associated with substorms, Nature, 267, 502–504, 1977. Nishino, M., Nishitani, N., Sato, N., Yamagishi, H., Lester, M., and
Holtet, J. A.: A Rectified Response of Daytime Radio Wave Ab-sorption to Southward and Northward Excursions During North-ward Interplanetary Magnetic Field: A Case Study, Adv. Polar Upper Atmos. Res., 13, 139–153, 1999.
Pellinen, R. J. and Heikkila, W. J.: Inductive electric fields in the magnetotail and their relation to auroral and substorm phenom-ena, Space Sci. Rev., 37, 1–61, 1984.
Pytte, T., Trefall, H., Kremser, L., Tankskanen P., and Riedler, W.: On the morphology of energetic (>30 keV) electron precipitation at the onset of negative magnetic bays, J. Atmos. Terr. Phys., 38, 757–774, 1976.
Ranta, H., Ranta, A., Collis, P. N., and Hargreaves. J. K.: Develop-ment of the Auroral Absorption Substorm: Studies of Pre-onset Phase and Sharp Onset Using an Extensive Riometer Network,