HAL Id: insu-01671184
https://hal-insu.archives-ouvertes.fr/insu-01671184
Submitted on 22 Dec 2017
HAL is a multi-disciplinary open access archive for the deposit and dissemination of sci-entific research documents, whether they are pub-lished or not. The documents may come from teaching and research institutions in France or abroad, or from public or private research centers.
L’archive ouverte pluridisciplinaire HAL, est destinée au dépôt et à la diffusion de documents scientifiques de niveau recherche, publiés ou non, émanant des établissements d’enseignement et de recherche français ou étrangers, des laboratoires publics ou privés.
Anasthase Liméry, Nicolas Cézard, Didier Fleury, Didier Goular, Christophe
Planchat, Johan Bertrand, Alain Hauchecorne
To cite this version:
Anasthase Liméry, Nicolas Cézard, Didier Fleury, Didier Goular, Christophe Planchat, et al.. Ra-man lidar for hydrogen gas concentration monitoring and future radioactive waste Ra-management. Optics Express, Optical Society of America - OSA Publishing, 2017, 25 (24), pp.30636-30641. �10.1364/OE.25.030636�. �insu-01671184�
Raman lidar for hydrogen gas concentration
monitoring and future radioactive waste
management
A
NASTHASEL
IMÉRY,
1,2,*N
ICOLASC
ÉZARD,
1D
IDIERF
LEURY,
1D
IDIERG
OULAR,
1C
HRISTOPHEP
LANCHAT,
1J
OHANB
ERTRAND,
3ANDA
LAINH
AUCHECORNE21ONERA, The French Aerospace Lab, F-91123 Palaiseau, France
2LATMOS/IPSL, UVSQ Université Paris-Saclay, UPMC Univ. Paris 06, CNRS, Guyancourt, France 3ANDRA, French Nat’l. Radioactive Waste Management Agency, F-92298 Chatenay-Malabry, France *anasthase.limery@onera.fr
Abstract: A multi-channel Raman lidar has been developed, allowing for the first time
simultaneous and high-resolution profiling of hydrogen gas and water vapor. The lidar measures vibrational Raman scattering in the UV (355 nm) domain. It works in a high-bandwidth photon counting regime using fast SiPM detectors and takes into account the spectral overlap between hydrogen and water vapor Raman spectra. Measurement of concentration profiles of H2 and H2O are demonstrated along a 5-meter-long open gas cell
with 1-meter resolution at 85 meters. The instrument precision is investigated by numerical simulation to anticipate the potential performance at longer range. This lidar could find applications in the French project Cigéo for monitoring radioactive waste disposal cells.
© 2017 Optical Society of America
OCIS codes: (280.3640) Lidar; (290.5860) Scattering, Raman; (010.7340) Water; (030.5260) Photon counting.
References and links
1. T. Hübert, L. Boon-Brett, G. Black, and U. Banach, “Hydrogen sensors – A review,” Sens. Actuators B Chem. 157(2), 329–352 (2011).
2. S. Delepine-Lesoille, J. Bertrand, L. Lablonde, and X. Phéron, “Distributed hydrogen sensing with Brillouin scattering in optical fibers,” IEEE Photonics Technol. Lett. 24(17), 1475–1477 (2012).
3. A. Campargue, S. Kassi, K. Pachucki, and J. Komasa, “The absorption spectrum of H2: CRDS measurements of the (2-0) band, review of the literature data and accurate ab initio line list up to 35000 cm-1.,” Phys. Chem. Chem.
Phys. 14(2), 802–815 (2012).
4. R. G. Sellar and D. Wang, “Assessment of remote sensing technologies for location of hydrogen and helium leaks,” NAG10–0290, Florida Space Inst. (2000).
5. I. Asahi, S. Sugimoto, H. Ninomiya, T. Fukuchi, and T. Shiina, “Remote sensing of hydrogen gas concentration distribution by Raman lidar,” Proc. SPIE 8526, 85260X (2012).
6. U. Wandinger, “Raman lidar” in Lidar: Range Resolved Optical Remote Sensing of the Atmosphere, C. Weitkamp, ed., Springer Series in Optical Sciences 102, 241–271 (Springer, 2005).
7. D. A. Long, The Raman Effect (Wiley, 2002), Chap.6.
8. W. F. Murphy, W. Holzer, and H. J. Bernstein, “Gas phase Raman intensities: A review of “Pre-Laser” data,” Appl. Spectrosc. 23(3), 211–218 (1969).
9. R. M. Measures, Laser Remote Sensing: Fundamentals and Applications (Wiley & Sons, Inc., 1984). 10. G. Avila, J. M. Fernández, G. Tejeda, and S. Montero, “The Raman spectra and cross-sections of H2O, D2O,
and HDO in the OH/OD stretching regions,” J. Mol. Spectrosc. 228(1), 38–65 (2004).
11. A. Liméry, N. Cézard, J. Bertrand, and A. Hauchecorne, “A multi-channel Raman Lidar in photon counting mode using SiPM technology,” in Proceedings of the Imaging and Applied Optics Conference 2016, OSA, paper LTh1G.4 (2016).
12. R. Agishev, A. Comerón, J. Bach, A. Rodriguez, M. Sicard, J. Riu, and S. Royo, “Lidar with SiPM: Some capabilities and limitations in real environment,” Opt. Laser Technol. 49, 86–90 (2013).
1. Introduction
Long-term management of radioactive wastes is an important scientific and society concern. In France, reversible deep geological disposal is under study as a solution for high-level and intermediate level long-lived radioactive wastes. Since the 2006 planning act, the French
#297657 https://doi.org/10.1364/OE.25.030636
National Radioactive Waste Management Agency (Andra) is in charge to design and build an industrial disposal site. In this project called Cigéo, nuclear waste packages are expected to be buried 500 meters below the ground inside horizontal galleries of a few hundred meters long (disposal cells, into the dark). Some waste packages generate hydrogen gas (H2) by radiolysis.
The release rate, expected to be slow (1.6 mol/package/year), may occur during a long time. To ensure that H2 concentration remains well below the lower explosive limit (4% in air), it is
important to develop means for profiling H2 concentration within disposal cells’ atmosphere.
Performed at high spatial resolution, such monitoring could also highlight potential deterioration of waste packages by detecting unexpected local release rates of H2. The lidar
technique has the potential to perform non-intrusive measurement, which could, in radioactive environment, prove very useful compared to in situ sensors [1,2].
As a diatomic homonuclear molecule, H2 has no dipole moment that could create a strong
optical absorption in the infrared region. The absorption spectrum of H2 is limited to
vibrational bands of very weak electric quadrupole transitions. Absorption-based detection techniques for H2 therefore require specific cavity-enhanced setups like Cavity Ring Down
Spectroscopy [3], so open-path remote sensing techniques such as Differential Absorption Lidar (DIAL) cannot be used. Nevertheless, H2 has a strong Raman cross section and Raman
lidar is recognized as one of the most appropriate technique for remote H2 detection [4]. H2
measurement by Raman lidar has already been demonstrated in the past for pure H2 point
leaks at short range [5]. However, the Shikoku Research Institute system is designed to probe a limited close area and does not allow monitoring over hundreds of meters. Moreover, it disregards the potential impact of water vapor on H2 measurements (discussed in Sec.2.1).
Detection is often challenging in Raman lidar due to intrinsic signal weakness. In the Cigéo scenario, low H2 concentration (<1%) must be measured and this makes photon
detection even more difficult. For this reason the mentioned overlap between H2 and H2O
spectra cannot be ignored, and simultaneous profiling of H2 and H2O must be performed. Our
goal is also to monitor the atmosphere of future disposal cells with a high spatial resolution (at least 3m gates) in order to distinguish successive waste packages. It is thus crucial to design a very efficient, sensitive, fast and robust detection stage.
In this paper, we first recall Raman lidar measurement basics, highlighting H2 detection
specificities. Then we detail the lidar design, and we report on first experiment results for concept demonstration on hydrogen gas and water vapor. Finally, we conclude on the expected performance at longer range for our system.
2. Measurement principle
2.1 Vibrational-rotational Raman scattering of H2, H2O, O2 and N2
Scattering of light in the atmosphere returns various signals dependent on scattering sources. Aerosols yield strong elastic scattering, whereas air’s molecules yield elastic Cabannes scattering, pure rotational Raman (RR) scattering, and vibrational–rotational Raman (VRR) scattering [6]. Measurement of the Stokes VRR scattering is chosen for the present Raman lidar system. In that case, scattered wavelengths are red-shifted with respect to the excitation wavelength by the quantityΔ =ν ν ν L−R = ΔE hc/ characteristic of the molecule (νLand νR
are wavenumbers (in cm−1) of excitation incident light and Raman scattered light respectively,
ΔE is the energy difference between incident and scattered photons, h is the Planck’s constant and c the velocity of light). For diatomic homonuclear molecules like H2, O2 and N2, VRR
transitions consist of a central Q branch with a wavenumber shift Q vib
ν ν
Δ = surrounded on both sides by O and S branches. For the latter, the wavenumber shift is (adapted from [7]):
3 1 1 2 (2 3) 3(2 3) (2 3) with 0,1, 2, S vib J B J D J J J ν ν Δ = + + − + + + = (1) 3 1 1 2 (2 1) 3(2 1) (2 1) with 2, 3, 4, O vib J B J D J J J ν ν Δ = − − + − + − = (2)
where νvib is the specific vibrational wavenumber of the molecule, B1 and D1 are respectively
the specific rotational and stretching constant of the vibrational level, and J is the rotational quantum number corresponding to each rotational level.
The measured intensity of these VRR transitions for an observation at 180° is proportional to the backscatter coefficient (in m−1.sr−1). This coefficient is given by
π i π
β =N×(dσ /dΩ) where
the molecule number density N (in m−3) is multiplied to the differential Raman scattering
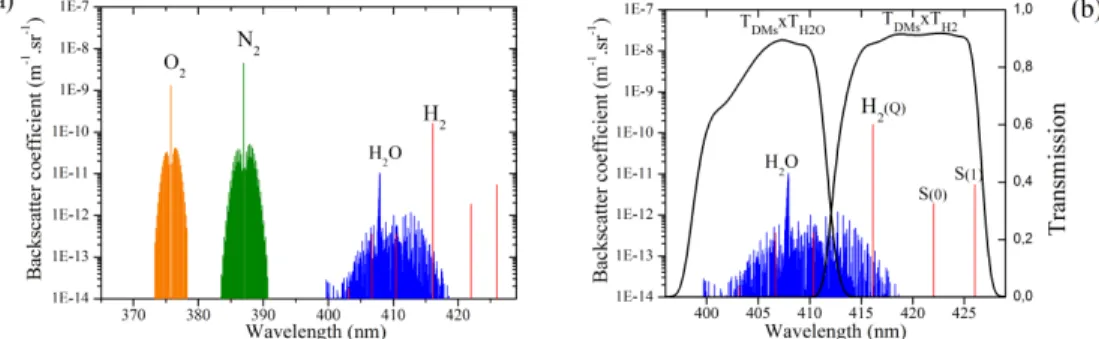
cross section (in m2.sr−1) for scattering at 180°. Figure 1 shows the computed backscattering
spectra for O2, N2, H2O and H2 for a case study gas mixture. The calculation results from [6,7]
with parameters data taken from [6,8–10]. For H2 concentration measurement with a 355 nm
laser excitation, the Q branch scattering at 416.1 nm is used along with the two first S-lines. The reference signal is given by N2 scattering centered at 386.7 nm. The important distance
between transitions lines of H2 compared to other molecules is explained by the high value of B1 for H2 (due to a lower reduced mass value and a shorter internuclear distance).
A spectral overlap between H2 and H2O Raman spectra is visible on Fig. 1. This overlap
could induce a bias on the hydrogen concentration calculation. Therefore a third channel is needed in the Raman lidar system to also monitor water vapor concentration and correct the bias. This third channel is centered on the Q branch of water vapor at 407.5 nm. The few H2
O-lines inside the pass band of the water vapor filter are not sufficiently intense (compared to the sum of all VRR H2O lines) to create a notable bias on the water vapor channel.
Fig. 1. (a) Vibrational-rotational Raman spectra for an air composition of 78% N2, 20% O2, 1%
H2O and 1% H2 at 300K for a 355 nm laser excitation. (b) Zoom on H2O and H2 VRR spectra
along with optical transmissions on each channel (transmission product of dichroic mirrors (DMs) and bandpass filters, discussed in Sec.3.1)
2.2 Mixing ratio retrieval
In photon-counting mode, the number of photons measured per meter i( )
m
N z from the Raman scattering of a gas species i at wavelength λR,i from distance z is given by the lidar equation:
, , ( ) ( ) ( ) ( ) ( ) ² L R i i atm atm m i i z N z K z T z T z z π λ λ γ β = (3)
where Ki comprises all range-independent system parameters, γ(z) is the overlap function
between the transmitted laser beam and the receiver field of view, atmL
Tλ and atmR i,
Tλ are atmospheric transmissions at the laser wavelength λL and at Raman wavelength. For high
signal intensities the receiver response is no longer linear. The true number of photons Nt is
then given by Nt =Nm (1−Nm rt ) (non-paralyzable behaviour) where Nm is the measured
number of photons and tr the measured pulse pair time resolution, or dead time.
Concentration measurement by Raman technique requires the measurement of a gas species taken as reference. Nitrogen was chosen here, since N2 concentration in disposal cells
expected to decrease with time because of corrosion processes. Because of the spectral overlap previously discussed, water vapor in the atmosphere induces an overestimation of hydrogen mixing ratio. This bias is continuously corrected through a third channel dedicated to water vapor measurement. Therefore H2 mixing ratio estimator is given by:
2 2 2 2 , , 2 2 ( ) ( ) ( ) ( ) ( ) ( ) R R H N atm H H O t t H N atm t T z N z k N z x z C T z N z λ λ − = (4)
where C is the calibration constant which depends on system characteristics and differential cross sections. k is a correction factor determined through a calibration procedure, that consists in forcing to zero the residual signal measured on the H2 channel in the absence of
‘true’ H2 along the line of sight. The transmission ratio depends on aerosol distribution.
The 1σ error expected on H2 mixing ratio estimation can be written as:
2 2 2 2 2 2 2 2 2 2 V( ) ²V( ) V( ) ( ) H H H O N x t t t H H O N H t t t N k N N x N k N N σ + = + − (5)
where V(Nti) is the variance of Nti, for which the shot noise from signal and background
radiation measured on each channel, along with the count correction are taken into account.
3. Simultaneous hydrogen and water vapor measurements
3.1 Raman lidar design
The emitter is a 355 nm laser source (Quantel – Ultra 100) that emits pulses of 30 mJ and 5.5 ns FWHM at 20 Hz. The Raman signal is collected via a Newtonian telescope of 152 mm diameter and 609 mm focal length. The received signal is coupled into a multimode fiber and directed towards the subsystem dedicated to spectrum analysis.
This multi-channel spectral analyzer, detailed in [11], is used to select VRR scattering spectral bands of interest seen in Sec.2.1. It uses bandpass optical filters (Δλ=15nm) placed in front of each detector, and a long-pass filter eliminating Rayleigh-Mie scattering at 355nm. There is a minimum of 100 dB attenuation at 355 nm on each channel (70dB is needed to obtain a Rayleigh scattering 100 times weaker than a 2%-H2 Raman scattering). Dichroic
mirrors are used for channel spatial separation. Silicon PhotoMultipliers detectors (SiPMs – SensL – 30035), working in photon-counting mode, have been chosen for the detection. This technology, still little used in lidar to date [12], suits well for this application [11]. It brings to the setup simplicity (no high voltage needed), high detectivity (photon counting), high speed (500 MHz count rate) and robustness (short dark state and undamaged by ambient light).
3.2 Experimental layout
Long-range measurements of H2 and water vapor profiles have been performed for system
concept demonstration. A 5-meter-long open gas cell, 10 cm diameter, has been developed to simulate H2 release between waste packages. In order to redirect the laser beam in a more
convenient area, a mirror has been placed at 50 m as shown in Fig. 2. The effective distance to the gas cell reached 85 m. Bottles containing either pure dry air or a mixture of H2 at 2% in
dry air were available for gas-release experiments (through the center of the tube).
For each measurement, in order to homogenize gas composition inside the tube, the latter was first filled with gas with the two openings blocked. Then obstructions were removed, leaving way for the laser beam, and Raman lidar acquisition started while maintaining the gas flow inside the tube. SiPM dark counts and background radiation contributions, measured between two lidar shots, are removed through signal processing. Mixing ratio calculations and displays were performed in real time by a computer. In these experiments, the laser energy
was reduced to 5 mJ to avoid signal saturation, and the telescope depth of focus was optimized at the center of the tube.
Fig. 2. Experimental configuration for H2 and H2O measurements into a gas generation cell.
3.3 Results on hydrogen and water vapor
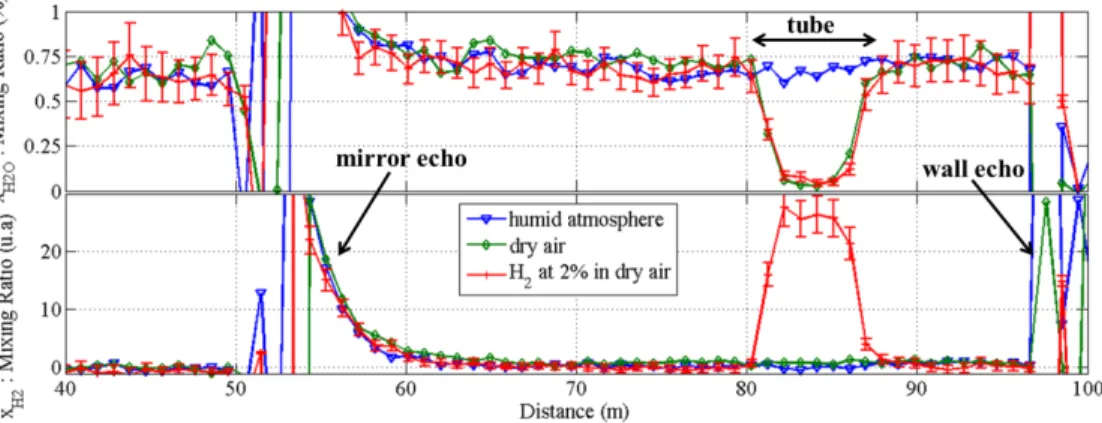
Three successive experiments have been conducted on a winter night (T = 4°C, RH = 84%) and the calculated mixing ratios profiles for H2 and H2O are shown in Fig. 3. The first
experiment (blue line) was made with the natural humid atmosphere (no gas released). The second experiment (green line) was made with pure dry air released inside the tube, and the third one (red line) with hydrogen gas at 2% in dry air. For water vapor profiles, a first-order calibration has been performed using an in situ hygrometer (Rotronic – HygroPalm HP23). H2
profiles are given in arbitrary unit because no calibration sensor was available (currently under development). The water vapor cross talk is removed using a correction factor of
k = 0.33 (determined 6 days before by a calibration procedure as explained in Sec.2.2). All
profiles are shown for 1 m resolution and 1 min accumulation time (1200 lidar shots). Drawn error bars show the expected 1σ standard deviation of H2 mixing ratio given by Eq. (5) (a
similar calculation is done for H2O). As an example, in the 2% H2 in dry air case study (red
curves), the average numbers of photons/meter/shot for the measurement point at center of the tube (z = 84 m) are N2 0.5 t N = , H O2 0.05 t N = and H2 1.9 t N = .
Fig. 3. Profiles comparison for water vapor and hydrogen gas mixing ratio (top and bottom resp.) with 3 different gases in the tube: i) natural atmosphere, no added gas (blue); ii) dry air (green) and iii) 2% of H2 in dry air with its ± 1σ estimated error bars (red).
The blue line shows no discontinuity inside and outside the tube, which means that the air composition without gas released is uniform along the line of sight. When the tube air is replaced with dry air a large decrease (95% extinction) of the water vapor mixing ratio inside the tube is observed as expected. Meanwhile there is no change on the H2 mixing ratio. When
the tube is filled with 2% H2 in dry air, the same decrease is observed on the H2O profile, but
H2 signal is at least one order of magnitude above the level of signal fluctuation. Regarding
the potential limit of detection, this result is therefore promising. For further works, the measurement range could be increased with additional mirrors, since the laser energy here was limited to 5 mJ, while 25 mJ (considering losses) are available. Range resolution could also be slightly degraded from 1 m to 3 m (size of a waste package) to reduce measurement fluctuations by spatial averaging if necessary. Finally the accumulation time (only 1 minute here) could be significantly increased (up to 1h) inasmuch as the experiment conditions and instrument behaviour remain stable enough along the integration time.
4. Expected LOD at long range
The expected limit of detection (LOD) of H2, defined here as the expected 3σ error (Eq. (5))
around a zero-H2 mixing ratio, has been calculated in conditions comparable to long disposal
cells. Its evolution at 500 m over accumulation time is shown on Fig. 4. All the available laser energy (25 mJ), a 3 m range resolution and a background noise similar to the previous experiment are assumed to be used for this calculation. Evolutions for two humidity conditions are drawn, humid (blue line, 0.7% of H2O same as the real experiment) and dry
(green) atmosphere. For 1 minute accumulation, the LOD of H2 is about 0.2%, i.e. 10 times
below the concentration used for concept demonstration, which looks consistent with our experimental observations. Assuming stable accumulation processes the 0.05% limit could be reached in 11 minutes in dry air and in 19 minutes in humid atmosphere.
Fig. 4. Evolution over time of the LOD of H2 at 500 m in humid (blue) and dry (green)
atmosphere (laser energy of 25 mJ and a range resolution of 3m are assumed here).
5. Conclusion and outlooks
Simultaneous high resolution profiles of hydrogen gas and water vapor have been performed along a 5-meter-long open gas cell at 85 meters with our multi-channel Raman lidar. This system could contribute to security, safety and reversible management of radioactive waste by monitoring future waste disposal cells if the Cigéo project comes into being.
Performance at longer range has been predicted by numerical simulation. A 0.05% LOD in dry air should be achieved for H2 at 500 m in 11 minutes, insofar as the experiment
conditions and instrument behaviour remain stable enough along the integration time.
In future works, the lidar calibration for quantitative hydrogen gas measurements will be performed using a local H2 sensor inside the tube (currently under development by Andra).
The lidar range will also be increased to several hundred meters, in order to demonstrate the measurement feasibility in long disposal cells galleries and confirm the expected detection limit of our system.
Funding