Calorimetric Measurements of a Yang-Koldamasov
Device
by
Jennifer Novosad
Submitted to the Department of Electrical Engineering and Computer
Science
in partial fulfillment of the requirements for the degree of
Master of Engineering in Computer Science and Engineering
at the
MASSACHUSETTS INSTITUTE OF TECHNOLOGY
February 2007
c
Massachusetts Institute of Technology 2007. All rights reserved.
Author . . . .
Department of Electrical Engineering and Computer Science
February 1, 2007
Certified by . . . .
Peter Hagelstein
Associate Professor
Thesis Supervisor
Accepted by . . . .
Arthur C. Smith
Chairman, Department Committee on Graduate Students
Calorimetric Measurements of a Yang-Koldamasov Device
by
Jennifer Novosad
Submitted to the Department of Electrical Engineering and Computer Science on February 1, 2007, in partial fulfillment of the
requirements for the degree of
Master of Engineering in Computer Science and Engineering
Abstract
Due to the finite supply of oil, energy availability and price are issues facing the world. Among the possible approaches to this problem is research of new physical effects which may produce energy in novel ways.
The Yang-Koldamasov device was reported to produce excess heat by iESi by pumping oil through a thin nozzle; however, the theoretical mechanism for this effect is at the present unknown. The subject of this thesis is an attempt at independent confirmation of the effect at MIT and FRC.
To perform calorimetry on this device, there are several issues involved, such as thermocouple offset errors, RF noise, and erroneous readings due to fluid flow conditions. Methods for handling these issues are discussed in application to two independent measurements of energy gain in the system, differential calorimetry over the cell, and flow calorimetry via a heat exchanger. The differential calorimetry has been improved compared to what was earlier available on Yang-Koldamasov devices, and the flow calorimetry is new to the device.
Data was collected on several tests After analysis, the data was found consistent with a null result. However, over the course of the runs the behavior of the device was very different than the behavior at earlier demonstrations where excess heat was observed. For example, earlier demonstrations exibited electrical arcing perpendicular to the flow of oil, while the current device shows only arcing in the direction of oil flow. Future work is being conducted by FRC to identify the reasons that the current apparatus behaves differently.
Thesis Supervisor: Peter Hagelstein Title: Associate Professor
Acknowledgments
I would like to thank my mother and father, Laura and Richard Novosad, my advisor, Peter Hagelstein, Epsilon Theta Fraternity, my family, and my friends for giving me the emotional and intellectual support I needed to get through these 5.5 years at MIT. I would also like to thank Dexter for the emotional support he gave me (and editing assistance) during the time that I was working on this project.
Jim Gimlett’s help on this project has been invaluable. He has helped me to under-stand the complex experimental issues involved in this work, reviewed my analysis for common errors and helped me with the presentation of it, and provided suggestions for experiments.
I also thank Fusion Research Corp (FRC) for the wonderful opportunity to work on this experiment and financial support in my last year, and the Canadian government for allowing me across the border to observe work at FRC. I would not have been able to complete this project without the people I met there: Chris, Dave, Sean, Stephen, Mike, Christine, Carston, Denis, and Chansoo. These people contributed greatly to the design, operation, and analysis of this experiment. In particular, Chris helped with organization and communications with Korea. Dave, Mike and Sean helped with design and manufacture of many of the parts I needed, even for experiments that I wanted to try but did not pertain to the main focus of the company. Stephen created the setup for getting data from the instrumentation to the DAQ, and set up the vast majority of the instrumentation. Christine and Carston enabled me to go to FRC, and helped me to deal with customs and my financial situation. Mike and Chansoo taught me how to run the machine. Denis provided me with many resources as to the work which had already been done in the area. This was invaluable, since very little work has been published in this area. He also kept my spirits up with his optimistic attitude combined with an experimentalists viewpoint.
Thank you to the individuals who responded to my requests for advice and help in areas what I wasn’t well equipped to handle, such as Fran Tanzella, who recommended parts and methodology related to calorimetry.
Lastly, David Griswold provided the funding necessary for me to complete this project. Thank you very much for enabling me to complete my Master’s degree.
Contents
1 Introduction 15
1.1 Focus of this Thesis . . . 18
2 Motivation 21 2.1 Hubbert’s Peak and the Coming Energy Crisis . . . 22
2.2 How Oil is Formed: Why One Can’t Just ’Find More’ . . . 23
2.3 Arguments for and against Hubbert’s Peak . . . 25
2.4 When Will it Peak? . . . 27
2.5 Consequences . . . 29
2.6 Replacing oil . . . 30
3 Background 35 3.1 Hot Fusion . . . 36
3.2 Electron Screening . . . 37
3.3 Fleischmann and Pons . . . 40
3.4 Experiments after Fleischmann and Pons . . . 42
3.5 The 2004 DoE review . . . 43
3.6 Previous Work on the Yang-Koldamasov Effect . . . 46
4 Non-Nuclear Explanations: Combustion or Measurement Error 51 4.1 Measurement Error . . . 51
4.2 Combustion . . . 52
5 Nuclear Explanations 59 5.1 Theories Proposed In Designer’s Papers . . . 59
5.1.1 Theory Presented in the Patent Application . . . 59
5.1.2 Theory Presented at ICCF12 . . . 60
5.2 Phonon Exchange with a Two-State System . . . 61
5.2.1 Physical Model . . . 61
5.2.2 Hamiltonian . . . 63
5.2.3 Inclusion of Loss . . . 65
5.2.4 Application to this Experiment . . . 68
6 Experimental Setup 71 6.1 Simplified Oil Loop . . . 71
6.2 The Oil . . . 72
6.3 Oil Loop Embellishments . . . 73
6.3.1 Downstream Pressure Control . . . 73
6.3.2 Cell Removal . . . 74
6.3.3 Gas Injection and Removal . . . 74
6.3.4 Safety . . . 74
6.4 Water Loop . . . 75
6.4.1 Flow Control Valve . . . 75
6.4.2 Manual Valves . . . 75 6.4.3 Pressure Regulator . . . 75 6.5 Instrumentation . . . 76 6.5.1 Temperature . . . 76 6.5.2 Pressure . . . 76 6.5.3 Other Instruments . . . 77 6.5.4 Data Acquisition . . . 77
6.6 Complete Loop Lists . . . 79
6.6.1 Complete Oil Loop . . . 79
6.6.2 Complete Water Loop . . . 81
7 Procedures 83 7.1 Changing a Tip . . . 83
7.2 Changing the Oil . . . 84
7.3 Injecting Gas . . . 84
7.4 Heuristics for Light Emission . . . 84
7.5 An Example Run . . . 86 8 Data 89 9 Errors 95 10 Analysis 99 10.1 Analysis Method . . . 99 10.2 Heater Measurements . . . 101
10.3 Fits for Heat Loss in the System . . . 101
10.3.1 The Initial Unit at FRC . . . 105
10.3.2 Effect of Insulating the Cell . . . 106
10.3.3 Effect of Adding a Reservoir . . . 107
10.4 Assorted Tip Designs . . . 108
10.4.1 Tips on the Initial Unit at FRC . . . 108
10.4.2 Tips After Insulating the Cell . . . 110
10.4.3 Tips After Adding a Reservoir . . . 111
10.5 Comparing Tip Material . . . 112
10.6 HD Gas . . . 113
10.7 D2, Xe, and/or He . . . 115
10.8 Runs After Removing Gases . . . 117
11 Discussion 121 11.1 Results . . . 121
11.1.1 Gain Over the Cell . . . 121
11.1.2 Gain Over the Entire Machine: Water Measurements . . . 123
11.2 Comparison to Theory . . . 126
11.2.1 Theory Presented in the Patent . . . 126
11.2.3 Combustion . . . 127
12 Conclusions 129
12.1 Contributions . . . 130 12.2 Recommendations for Future Work . . . 131
List of Figures
1-1 Photography of an oil-based Yang-Koldamasov device taken by S. B.
Krivit, c New Energy Times. Fair use permitted for non-commercial
educational use. . . 16
1-2 Photography of a Russian cell with electrical discharge taken by S. B. Krivit, c New Energy Times. Fair use permitted for non-commercial educational use. . . 17
2-1 Hubbert Logistic Graph Predicting US Oil Production [17] . . . 23
2-2 Hubbert Logistic graph predicting world oil production [20] . . . 26
2-3 Comparing Hubbert’s prediction to actual world oil production [17] 27 2-4 World Oil Production Scenarios, Based on Variable Growth Rates and Total Oil Estimates [42] . . . 29
3-1 Fusion Cross Sections as a Function of Deuteron Energy [37] . . . . 38
3-2 M. Fleischmann observing a damaged cell, provided by S. B. Krivit, c New Energy Times, use permitted for non-commercial educational purposes . . . 50
4-1 Solubility of O2 in hexane as a function of temperature [8] . . . 53
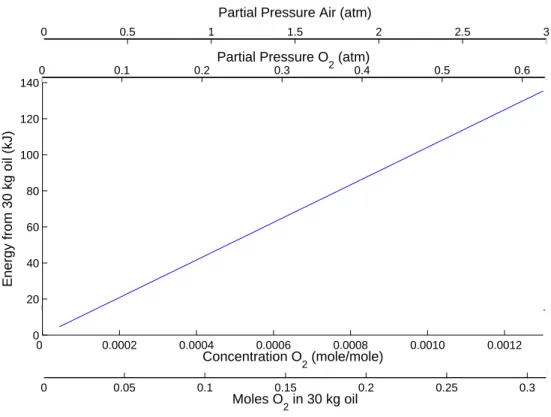
4-2 Combustion energy dependence on oxygen quantity . . . 54
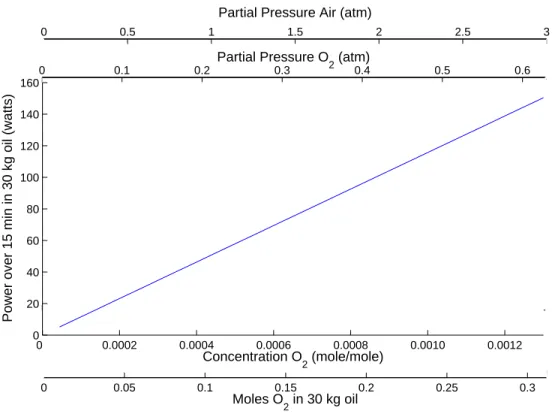
4-3 Combustion power dependence on oxygen quantity . . . 56
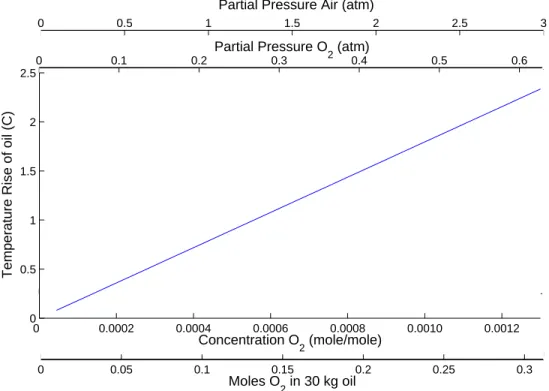
4-4 Temperature rise of the oil as a function of oxygen quantity . . . 57
5-1 A graphical schematic of two two-state systems coupled to a low energy harmonic oscillator . . . 61
6-1 A cross section of the cell, based on [1] . . . 72
6-2 A cross section of the tip, based on [1] . . . 73
6-3 Schematic of experimental setup . . . 78
6-4 Schematic of water loop . . . 82
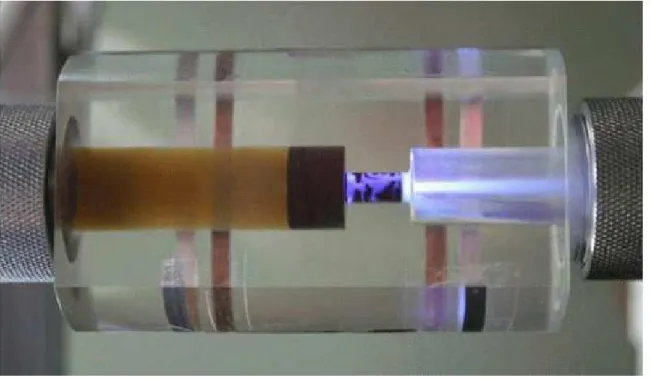
7-1 Photography of discharge through the tip, provided by S. B. Krivit, c New Energy Times, use permitted for non-commercial educational purposes . . . 85
8-1 An example run without steady state data . . . 93
8-2 An example run with 9 steady state data points . . . 93
10-1 Gain across the cell with a heater . . . 102
10-2 Water power versus electrical power with a heater . . . 102
10-3 Gain across cell on initial unit at FRC . . . 105
10-4 Water power on initial unit at FRC . . . 105
10-5 Gain across cell after cell insulation . . . 106
10-6 Water power after cell insulation . . . 106
10-7 Gain across cell after reservoir addition . . . 107
10-8 Water power after reservoir addition . . . 107
10-9 Gain across cell of assorted tips with initial system . . . 109
10-10 Water power versus electric power of assorted tips on initial system 109 10-11 Gain across cell of assorted tips with insulated cell . . . 110
10-12 Water power versus electric power of assorted tips with insulated cell 110 10-13 Gain across cell of assorted tips with reservoir addition . . . 111
10-14 Water power versus electric power of assorted tips with reservoir ad-dition . . . 111
10-15 Gain across cell of three tip materials . . . 112
10-16 Water power/electrical power of three tip materials . . . 112
10-17 Water power - electrical power of three tip materials . . . 113
10-19 Water power/electrical power with HD gas . . . 114
10-20 Water power - electrical power with HD gas . . . 115
10-21 Gain across cell with D2,Xe, and/or He gas . . . 116
10-22 Water power/electrical power with D2,Xe, and/or He gas . . . 116
10-23 Water power - electrical power with D2,Xe, and/or He gas . . . 117
10-24 Downstream pressure buildup seen with palladium tip and helium . 117 10-25 Gain across cell after gases removed from system . . . 118
10-26 Water power/electrical power after gases removed from system . . . 118
10-27 Water power - electrical power after gases removed from system . . 119
11-1 As a reminder of the calibration of the device to measuring heat, the graph of gain measured in the system when a heater is in the oil stream is reproduced here from the analysis section. . . 122
11-2 As a reminder of the calibration of the device to measuring heat, the graph of water power compared to electrical power measured in the system when a heater is in the oil stream is reproduced here from the analysis section. . . 124
List of Tables
3.1 Energies of Fusion for a Few Deuterium Reactions . . . 36
3.2 Screening Power for Several Materials at 20 C . . . 39
4.1 Energy per mole O2 for Several Combustion Reactions . . . 55
5.1 Nuclear Spin of the Ground State of Several Nuclear Isotopes [10] . . 62
6.1 Some properties of new and used PetroCanada TurboFlo 10 [18] . . . 73
9.1 Estimates of Statistical Errors, Based on Outside Calibrations . . . . 95
9.2 Estimates of Statistical Errors, Based on Calibration Data . . . 96
10.1 Table of Fit Values . . . 103
A.1 List of Mathematical Symbols . . . 133
A.2 List of Abbreviations . . . 133
Chapter 1
Introduction
Due to the finite supply of crude oil, world faces problems in energy price, quantity, and quality (see Chapter 2). There are many potential approaches to address the problem, for instance, coal, nuclear power, or solar energy. Cold Fusion is an emerging field which is looking at a new mechanisms for energy production.
Dr. Hyunik Yang and collaborators believe that they have discovered a new technology that produces energy; however, the physical mechanism for the energy production is at present unknown. One implementation of this technology is displayed in Fig. 1-1. The device operates by pumping oil through a thin nozzle, resulting in electrical discharges (Fig. 1-2). One of the reasons that this device is interesting is that if it works, it would be almost immediately practical.
In light of other successful Cold Fusion experiments, and demonstrations of the machine at iESi1, an attempt at a confirmation of the effect was made at MIT. This
work was later continued at FRC2. These demonstrations and other successful work
in the Cold Fusion field are further discussed in Chapter 3.
To perform a confirmation, a machine, operational instructions, and calorimetry instrumentation were needed. Our group collaborated with FRC, who provided the machine, procedures and instrumentation (see Chapters 6 and 7).
1Innovative Energy Solutions Inc. The abbreviation potentially refers to two groups, iESi, the parent company based in Las Vegas and the subsidiary iESiUSA based in Edmonton, Canada. References to iESi in this work are to iESiUSA.
Figure 1-1: Photography of an oil-based Yang-Koldamasov device taken by S. B.
Krivit, c New Energy Times. Fair use permitted for non-commercial educational
use.
Initially, the machine had a simple differential calorimetry set up. Our tasks included improving the differential calorimetry so that it would provide meaningful and reliable measurements, and adding flow calorimetry with a heat exchanger.
These are two independent measurements of the energy balance in the system. The differential calorimetry measurement estimates the thermal power over the nozzle from a measurement of the temperature differences across the nozzle. This value is compared to the mechanical power over the cell to create a heat gain.
Pheat= Coil∆T ρ dV dt Pmechanical = ∆P dV dt gain = Pheat Pmechanical = Coilρ∆T ∆P
The flow calorimetry measurement compared the electrical power put into the motor to the power taken out of the cooling water in the form of heat. The comparison was
Figure 1-2: Photography of a Russian cell with electrical discharge taken by S. B. Krivit, c New Energy Times. Fair use permitted for non-commercial educational use. done in two ways, the difference and the ratio.
Pwater = Cwρw∆Tw
dVw
dt gain = Pwater
Pelectric
dif f erence = Pwater − Pelectric
Several measurements were taken of the behavior of the device. These included • scanning over pressure and temperature
• varying nozzle configurations
• injecting gases such as HD, D2, Xe, and He
The results are expected to fall into one of two categories, based on earlier work done on this machine:
• In February 2005, iESi conducted demonstrations for several scientific observers including Prof. Hagelstein. An integral temperature measurement of the reser-voir temperature before and after the 15 minutes run was used to calculated
power gain. Electrical discharges perpendicular to the flow of oil and high voltages outside the cell (with the machine frame defined as ground) were also observed. Excess thermal energy in the oil was more than 300% of the input electric power when running around 800W. The total thermal power, including heating of the frame of the machine and losses to air, was probably greater than 500%.
• At later visits in June and July 2005, the machine behaved qualitatively dif-ferently. Electrical arcing was only in the direction of oil flow, and integral calorimetry was no longer used. An audit performed in July indicated that there was no excess power.
• At the reproduction attempts performed at MIT and later FRC in 2006, electri-cal arcing was only in the direction of oil flow. Measurements of power indicated that there was no excess power.
Despite our efforts, the data collected in the experiments in this thesis was from a device behaving much like the device in June and July 2005. Visual behavior such as electrical arcing was very similar, as was the lack of anomalous heat. The analysis of this data is presented in Chapter 10 and discussed in Chapter 11.
Given that the current machine is behaving differently than the February 2005 demonstration device, work has gone into theorizing how the original device may have worked, so that the current device can be made to operate in the anomalous regime. Conventional explanations are presented in Chapter 4 and nuclear explanations are presented in Chapter 5.
1.1
Focus of this Thesis
The focus of this work is the experimental data collected, its analysis, and inter-pretation. To better understand the experiment in this thesis, several supplemental materials are provided which are not directly the conducted research, but taken from outside sources. Chapter 2 covers the motivation for conducting this work, Hubbert’s
Peak and the coming energy crisis due to the decreasing supply of oil. Chapter 3 de-scribes the background of the field and the previous work with the Yang-Koldamasov effect. Nuclear explanations are presented in Chapter 5. Explanations for this ef-fect which are not nuclear in nature are given in Chapter 4, such as combustion and measurement error. The measurement error discussions are primarily derived from outside sources who observed the original demonstrations at iESi. The combustion calculation was done in collaboration by the author, P. Hagelstein and J. Gimlett.
Chapter 2
Motivation
Our world faces serious problems of energy supply in the coming years, which has motivated many scientists to pursue research into areas which might provide solutions. Energy problems have been one of my main motivations. In this chapter I provide some discussion from recent sources concerning the aspects of this problem that I am interested in.
Dr. M. King Hubbert’s oil supply theory predicts drastic changes in the way we live. The currently available solutions cannot support the world’s current energy consumption without oil. Because researching new solutions requires a great deal of energy, if research into solutions is to be done, it needs to happen while energy is still plentiful rather than after the energy crunch has occurred.
In addition to putting research efforts into conventional methods like solar, wind, and water power, some effort should be put into double checking some promising cold fusion experiments. While these experiments may have a low probability of success based on current physical theory, if they do produce energy they would be incredibly helpful in keeping the cost of energy low.
This chapter covers the theory of Hubbert’s Peak, other viewpoints, roughly when the end of cheap energy will occur, and the current available solutions.
2.1
Hubbert’s Peak and the Coming Energy Crisis
In 1949, Dr. Hubbert predicted that use of fossil fuels would be short lived, not due to their utility, but their supply [19]. The prediction is based on the fact that since oil is being used at a rate much faster than it is created, one can consider the total amount of oil on Earth to be a constant. With a few additional assumptions, Hubbert computed an estimate of when the price of oil would begin to drastically rise, as a result of reduced supply. This computation is summarized below, from [6].
First, define Q(t) to be the total quantity of discovered oil at time t (this quan-tity is known up until t is right now), Qf to be the total that will be discovered.
Consequentially, Q(t) − Qf is the amount undiscovered at time t.
So far, Q(t) has roughly followed unconstrained exponential growth, dQ/dt = rQ where r is some rate. Since the quantity of oil is finite, exponential growth is not sustainable. One assumption that can be made is the rate r is actually a function of the remaining amount of oil. As the amount of oil left in the world decreases, the ability to find oil becomes more difficult. One guess for the amount of remaining oil is r = A(Qf − Q)/Qf. A relates to the ability of people to locate oil and find ways
of accessing it. While A might vary with time as technologies improve, for simplicity this analysis will treat A as a constant. Since Qf is a constant and A is unknown, we
could also absorb the Qf in the denominator into A and have the same equation.
The equation is now
dQ/dt
Q = A(Qf − Q)/Qf
This equation is the form of logistic population growth. dQ(t)/dt resembles a bell curve, though it is not a Gaussian. This equation can be rearranged to form Hubbert’s equation 27 from his 1982 paper in Oil and Gas Supply Modeling, from the National Bureau of Standards Special Publication [6].
dQ/dt
Q = A − (AQ)/Qf
Dr. Hubbert’s estimates of the total amount of oil may have ignored that as price increases, harder to access oil becomes more economical to obtain. US oil production
Figure 2-1: Hubbert Logistic Graph Predicting US Oil Production [17]
after 1990 is higher than Hubbert’s original estimate, perhaps due to the cost of oil becoming high enough that investing in technologies to retrieve oil became more affordable.
2.2
How Oil is Formed: Why One Can’t Just ’Find
More’
This section summarizes the viewpoints given by K. S. Deffeyes in [6] on oil formation via saporels, the signs that this formation leaves for companies drilling for oil, and how productive future searching for oil is likely to be.
Saporels are deposits rich in organic material. These saporels can only form when the nutrients aren’t being consumed by bacteria or being swept away by ocean currents. In deeper water, the lack of light and oxygen will discourage the growth of bacteria which would consume organic oils. Saporels can occur in bowl shaped sections of water near land. If the deeper water is coming in, and the surface water leaving, then nutrients will be carried in and deposited. These water patterns might
occur if the surface water is less salty, due to a fresh water river or a lot of rain. However, if the surface water is saltier, perhaps due to evaporation from sunlight, then the surface water will sink, pushing the nutrients out of the saproel and into the sea. Because saporel formation is very weather sensitive, saporels occur sporadically over time, leaving black bands of organic rich source rock. The source rock bands are seen in drilling sites which eventually lead to oil.
Plate tectonics move the source rock deeper into the earth, exposing them to warmer temperatures. If the temperatures are not hot enough, then the organic structures won’t change significantly. However, hot enough temperatures will ’crack’, or rearrange the molecules, resulting in crude oil. Additionally, if the source rock goes too deep for too long a time period, the organic material will become the simplest of hydrocarbons: methane (natural gas). Based on fossil and pollen samples found in drilling holes, the cracking process is believed to take millions of years. Because of the time that it takes to naturally create crude oil, we can consider the amount available to us over the next 100 years to be essentially a finite supply.
When searching for new oil, there are several constraints which help guide the search. For instance, it is very unlikely that oil will be found where temperatures are too hot (instead one may find natural gas). Since temperatures rise as depth increases, searching below a certain depth for oil is unlikely to result in oil discoveries. Additionally, oil won’t be present without source rocks. Lastly, crude oil can’t form without enough heat. Unless the rocks show evidence of having at some point been deep enough for long enough, source rocks can’t develop into crude oil.
According to [6], most areas of the earth, except the South China Sea, have been searched for oil . Oil estimates are reasonably well known, except for the amount that may be found in the South China Sea and the amount in the middle east (which is a national secret of the countries involved). Searching more thoroughly everywhere else is unlikely to produce much more crude oil, since it has already been determined that the region lacks source rocks or rocks that have passed through proper temperatures. Drilling deeper may yield natural gas (particularly in areas where crude oil has already been found), but it is unlikely to produce crude oil [6]. With this information and
knowledge of current oil reserves, estimates of the amount of crude oil available can be created.
2.3
Arguments for and against Hubbert’s Peak
Note that the arguments given above by [6] are not universally agreed upon, and that there are other models for oil development. The idea that oil is of essentially finite supply is not under dispute. There are disagreements on the amount of oil left, which are inn general agreement with the concept of Hubbert’s Peak that oil will run out soon, and energy availability will peak and then prices will drastically rise. Arguments on the amount of oil left only change the peak date a few years in one direction or the other; the peak is still expected to occur. Some of this debate is reviewed briefly in the next section.
Three other arguments on energy consumption do not look at energy supply for a variety of reasons, and are briefly presented here. These arguments can be summa-rized as the environmentalist, economist, and politician arguments. The discussion given here is a summary of the interpretation of these arguments given by R. Heinberg in [16].
The environmentalist viewpoint doesn’t focus on the limited supply of oil because its main priority is preserving some portion of the earth’s natural state. While the goal isn’t to reduce the current standard of living, living quality is measured in terms other than consumption, such as the quality of weather and ones surroundings (i.e. acid rain is not characteristic of a high quality of life). While this viewpoint advocates the use of alternative energies, it is for cleanliness rather than necessity.
The economist viewpoint is that market forces will correct the over or underpric-ing of crude oil naturally, as would occur with any other commodity. Higher prices caused by reduced supply will naturally result in increased exploration, both with new oil drilling and new energy sources, as well as lowered demand [16] [9]. Polit-ical viewpoints frequently agree with this, perhaps because it is a positive outlook that helps garners more votes. Energy crunches are blamed on either greedy
corpo-Figure 2-2: Hubbert Logistic graph predicting world oil production [20]
rations reserving supply to artificially raise the price of energy, or on environmental regulations which restrict the drilling of new wells or processing oil [16].
Petroleum geologists in agreement with the Hubbert’s Peak predictions find several problems with the above arguments. In the case of the environmentalists, alternative energies are a good idea to use, but in their current state they can’t replace oil, because of energy density and quantity. The political viewpoint incorrectly assigns blame, and is fundamentally flawed.
The economist viewpoint ignores the differences between oil and other commodi-ties. Foremost, oil is a finite resource, and more cannot be found at will. If it was possible to do this, more US oil would have been located in the 1980’s, when demand drastically out paced supply, causing prices to rise [6]. Secondly, oil interacts with other commodities differently, forcing all prices higher because it is required for trans-port and some raw materials such as plastics. During extreme energy crunches, an estimated 90% of the cost in producing corn was from the cost of oil [6]. While higher oil prices do encourage the development of alternative energies, if energy prices are
Hubbert’s Curve
World Oil Production and Hubbert’s Curve
Production
Billion Barrels Per Year
Figure 2-3: Comparing Hubbert’s prediction to actual world oil production [17]
too high, there will not be enough energy available for the necessary research and development into them. Regardless of how high prices soar, the amount of energy available will become greatly restricted, which will have serious repercussions on the rest of the economy.
2.4
When Will it Peak?
The discussions in this section come primarily from [6] and [42]. As a geologist for Shell, Dr. Hubbert had privileged knowledge on how much more oil would be found within the US. He predicted two estimates of US oil production peaks based on a conservative and optimistic guess of the amount of undiscovered oil: 1965 and 1972 [6]. The actual peak occurred around 1970. The clearest sign of this peak was in the spring of 1971, when the Texas Railroad Commission “announced a 100 percent allowable” [6]. The regulatory body which controlled the production of oil allowed all oil wells in the US to produce as much oil as possible. The US could no longer meet its oil demand. Despite demand increasing, there was not the supply. As predicted,
production began to drop off after that point, and the US became dependent on oil imports.
Hubbert in 1974 claimed that if current trends continued, peak oil for the world would occur in 1995 [21].This does not seem to have been the case, as is illustrated in by comparing his predicted production curve to world oil production (Fig. 2-2 and Fig. 2-3). Possible reasons include the recession in the 80’s from reduced oil consumption and may have contributed to a delayed peak; poor estimates of the total world supply of oil due to the lack of information available from the Middle East may also be involved [35]. Another way to look at oil supply is to envision the amount of oil in the ground which can be extracted at a certain price. As prices have risen, harder to access oil has become profitable to drill and new technologies have been developed for this purpose which were not available when Hubbert made his estimates. Based on new reserve findings, and the chance of finding new technologies which will allow us to access previously unprofitable oil deposits, new estimates have been made for when the actual peak will occur.
In a 2004 study based on numerical data from the Energy Information Admin-istration, John Wood, Gary Long, and David Morehouse estimate several peak oil scenarios by extrapolating current trends and guessing the amount of oil available. They find that if a 2% growth rate continues, assuming a total oil volume of 3003 Billion Barrels, oil will most likely peak in 2037 [42]. They also calculated the effect on the date of the peak of different economic growth rates and total oil estimates. This estimate is considered by some by some to be overly optimistic. Their results are redisplayed in Fig. 2-4. Because growth rate is likely to be exponential, finding more oil does not move the peak forward much. Reductions in growth rate have a larger effect.
Other individuals expect that peak oil will occur much sooner, based on how quickly oil discoveries occur. Even if larger oil reserves exist, the process of drilling exploratory holes and developing the technology to access the oil takes around ten years [6]. Consumption already drastically overcomes finds; in 1998, on a global scale about 5.5 billion barrels were found per year, and about 26 billion used [44]. Deffeyes
Figure 2-4: World Oil Production Scenarios, Based on Variable Growth Rates and Total Oil Estimates [42]
of [6] expected peak oil to occur around 2004, though commented that other scientists had estimated as late as 2008.
2.5
Consequences
The discussion in this section summarizes the arguments given by K. S. Deffeyes in [6], P. Roberts in [35], and R. Heinberg in [16]. The most obvious uses of oil are for the transportation of people, goods, and armies. Oil is also used for electricity, fertilizers, and plastics. Regardless of what happens in the future, the way in which these things are done will have to change. The way in which lifestyle will change is still under debate.
It is possible, though fairly unlikely, that developing technology will find a way to produce enough power, and save enough energy, that the way in which we live will not change noticeably. Others have suggested that the global political structure as we know them will fall apart, governments will fight bitterly for resources, and large
populations will have to starve to survive on the land available.
A third outcome is one of cooperation between people. The population would need to be smaller, and the economy would need to change from one of unbounded growth to a stable model. Quality living standards are possible with sustainable resources; however, societies would need to undergo a great deal of changes [35], [16].
To avoid a violent possibility, working towards political and technological solutions should begin right now, while energy resources are still plentiful.
2.6
Replacing oil
This section draws heavily upon the arguments made by K. S. Deffeyes in [6], P. Roberts in [35], and R. Heinberg in [16]. In developing technologies to replace oil there are at least seven considerations: return, quantity, density, quality, storage, environmental impact, and safety. Energy output should be greater than energy input, or the return should be greater than 1. The return needs to be improved across the entire line of manufacture, since the amount of energy available is a global quantity. For example, a car which requires less energy is not a valuable technology if it requires additional energy manufacture over previous cars, and does not manage to save this amount of energy over the course of its use. Energy quantity will need to be great enough to meet the basic needs of people available. Problems of quantity can be approached both by finding new energies and by reducing total consumption. Energy density is the amount of energy per unit size (either volume, mass, or surface area). Cars and planes require particularly high energy densities to run, and oil has an incredibly high energy density. Energy quality relates to how easily one energy can be transformed into another and how useful each form is. Electricity is of high quality – it can be used for many things, and is difficult to make. Heat is of low quality – it is the by product of other processes doing work and is difficult to use. Petroleum is a wonderful chemical storage mechanism, whereas electricity is very difficult to store well. Environmental impact and safety relate to the risks for the ecosystems and consumers.
There are many renewable energies currently under consideration: solar, wind, tide, wood, dams, geothermal, plant oil, hydrogen, and alcohol. Coal, natural gas, and nuclear energy will be valuable as transition energies, though they are finite like oil. As an example, below is a discussion of some of the problems and strengths of one energy type, solar power.
Unlike some of the other renewable resources, quantity is not much of a problem with solar energy – the industrialized nations could be powered on the sunlight falling on 1% of the Earth’s surface [35]. However, energy density, quality, storage, and return prevent solar energy from solving the current energy problem.
Capturing 1 percent of the sunlight falling on the earth’s surface actually requires a great deal of surface area, due to its low energy density of about 22 watts per square foot, averaged over day and night [16]. The surface area of the planet is around 510 million km2, while the surface area of the US is around 9.6 million km2, or 2%. So,
half of the surface area of the US would need to be completely covered in 100% efficient soar cells to power the world.
Solar cells however are not efficient, due to the losses in capturing sunlight and transforming it into a high quality energy like electricity. The theoretical maximum efficiency for photovoltaic (solar to electricity) cells is 72% with 36 junctions (layers of materials), and manufacturing difficulties currently prevent the creation of pho-tovoltaic cells better than 30% efficient [39]. Technologies currently in development due to a new effect found in Indium gallium nitrides look like they could produce photovoltaic cells up to 50% efficient [39]. So, the surface area estimate above needs to be multiplied by a factor of at least 2, if not a little over 3.
Solar energy is also available only when time of day and weather permits. At other times it must be stored. When converting solar energy into electricity, the most cost efficient storage method currently available is to send it into the power grid during the day to reduce the amount of fossil fuels being used at that moment and take from the grid at night from the fuels not burned during the day. Solar power alone can’t handle all the energy needs because it simply isn’t available at night.
energy expensive to create. The energy return on energy invested (EROEI) on solar energy was estimated at 1.9 for solar space heaters, and 1.7 to 10.0 for photovoltaics in 1984 by Cleveland, Costanza, Hall, and Kaufman[16]. The EROEI of photovoltaic cells, however, was estimated at .41 by Odum in 1996. Odum also estimated solar water heaters to have an EROEI of .18 [16]. Based on these numbers, it is hard to determine if solar energy is actually worth the energy invested into creating the cells. Of course, as manufacturing technology on these improves, the EROEI will improve because the cost of creating a cell will drop.
Currently, the market for solar energy is growing rapidly (about 30% a year) despite a negative view of it from the 1980s, when the technology was not developed to a feasible level [35]. As more solar cells are sold, manufacturing techniques will improve, and eventually solar cells will become a commercially attractive option. They are about three to four times as costly as fossil fuels at the moment though.
Most photovoltaic cells are silicon based in nature, so their manufacture results in the same environmental and safety hazards as computer equipment . Health and environmental risks such as spontaneous combustion and toxicity are primarily man-ufacture concerns, and described in [36].
For the most part, there are similar issues which prevent the other renewable en-ergies from providing enough energy to meet the current energy consumption. For example, wind is similar to solar power in energy density, hydrogen will always con-sume more energy to create than it will yield (though it is very good for storing energy), and geothermal is only available in very specific, limited locations. No one solution will be enough, in fact it is unlikely that all the solutions combined will be enough. Changes in lifestyle, reorganization of the economy, and population reduction may all be necessary.
The concerns with the transition energies (coal, natural gas, and nuclear power) are from very different metrics. While energy density and quantity are enough for at least a limited period of time, there are concerns of cleanliness and safety.
We have not yet solved the energy problem, and we do not know how much time we have left to try. In addition to putting resources into improving these conventional
methods, it is important to take a risk and put some resources into examining the many cold fusion experiments to see if any of these can contribute to the solution. If any of these experiments were to work, it would lead to the discovery of a new physical mechanism which could provide energy in a cheap, clean way. This would help soften the blow of the energy crunch.
Chapter 3
Background
This chapter covers the previous work done on the Yang-Koldamasov effect. To give context to this work, there is also a discussion of the state of the Cold Fusion field and the reasons for it.
Hot fusion is very unlikely to occur at low temperatures due to the large Coulomb barrier. While electron screening of the nuclear charges increases the probability of fusion reaction in metals, fusion at normal temperatures is still very unlikely. These processes are discussed briefly in the first two sections of this chapter.
Because of these temperature constraints, the announcement of Fleischmann and Pons in 1989 of an excess energy effect seen at room temperature and thought to be nuclear in origin was very disruptive. The effect of the announcement on the field is discussed in section 3.3.
Since the 1989 announcement, work in the field has continued and many experi-ments have been conducted. In 2004, the Department of Energy agreed to conduct a review of the field based on this new information. The amount of work conducted and the results of this review are summarized in sections 3.4 and 3.5.
The development and research which has already gone into the Yang-Koldamasov effect is presented in section 3.6.
3.1
Hot Fusion
Fusion is the process by which two nuclei come together to form a single heavier nucleus. For small nuclei, this process releases energy, while for large nuclei it requires energy. The energy released for a few fusion reactions is given in table 3.1, along with the temperatures at which the energy produced by the reaction exceeds the amount lost due to bremsstrahlung radiation.
Reaction Temperature [37]
Fuel Products Millions C keV
D+D →3He(0.8 MeV)+n(2.45 MeV) 45 4
D+D →T(1.0 Mev)+p(3.02 MeV) 350 30
D+T →4He(3.5 MeV)+n(14.1 MeV) 400 35
D+3He→4He(3.6 MeV)+p(14.7 MeV) 400 35
Table 3.1: Energies of Fusion for a Few Deuterium Reactions
Two main forces are involved in fusion, the strong nuclear force and the Coulombic force. Since both nuclei in the reaction are positively charged, the Coulombic force pushes the nuclei away from each other. The strong force is attractive, but only powerful at very short distances. Above the distance rn= 1.44×10⁻¹⁵(A1/31 +A
1/3 2 )m,
where A1 and A2 are the atomic weight of the two nuclei, the dominant forces are
Coulombic, and therefore repulsive [4]. The nuclei must be closer together than rnin
order for fusion to occur.
One can approximate the energy needed to overcome the Coulombic forces by calculating the Coulomb energy at this distance,
Vcoulomb(rn) = q1q2/r = Z1Z2/(A1/31 + A 1/3
2 ) MeV
For example, two deuterium atoms require 1/(2 ∗ 21/3) ≈ 0.4 MeV to undergo fusion.
This energy corresponds to temperatures around 3.09 × 10⁹ C, using the relation
E = 3/2kBT .
This simple classical viewpoint does not take into account quantum tunneling, or the possibility that a particle can pass through an energy barrier to reach a potential well. A useful quantity when thinking about tunneling is the probability of reaction
per unit time at a certain center of mass energy, E. This quantity is called the cross section, σ(E).
σ ≈ λ2
b × τ × R
where λ2
b is the square of the de Broglie wavelength, and roughly 1/E, τ is the barrier
transparency, and R is the probability that the nuclei will fuse. τ ≈ e−√EG/E
as long as E ≪ EG. EG is the Gamow factor,
EG = (παfZ1Z2)22c2m1m2/(m1+ m2) = 986.1Z12Z22m1m2/mp(m1+ m2).
R is specific to the particular reaction; however, its effect is small in most reactions [4]. It is a weak function of E, and sometimes written as S(E), the astrophysical S factor.
The effect of tunneling then is
σ(E) = S(E)
E e
−√EG/E
A plot of the fusion cross sections for D-D and D-T reactions are given in Fig. 3-1. The probability of reaction is very small unless temperatures are fairly large.
If we approximate the center of mass energy to be 3/2kBT , then near room
tem-perature E ≈ .0353eV and σdd ≈ 3.6 × 10−2298 barn. At room temperature, this
probability is nearly zero (thought not quite, as in the classical case). This is a sim-plification and other physics is involved. In molecular D2, there is tunneling due to
zero-point fluctuations and screening which results in D2 having a theoretical half-life
of about 1064 sec [26].
3.2
Electron Screening
The calculations above assume ’bare’ nuclei, or protons and neutrons without elec-trons. Nuclei usually travel with electrons, which reduces the apparent charge of the atom from a distance. This effect is called electron screening. The required energy for
Material Ue (eV) metals Sn 130 ± 20 Al 520 ± 50 Fe 460 ± 60 Ag 330 ± 40 Cu 470 ± 50 Pd 800 ± 90 Material Ue (eV) semiconductors C ≤ 60 Si ≤ 60 Ge ≤ 80 insulators BeO ≤ 30 B ≤ 30 Al2O3 ≤ 30 CaO2 ≤ 50
Table 3.2: Screening Power for Several Materials at 20 C
nuclear fusion is lower because the two atoms “see” a lower charge as they approach each other.
Of interest to experimentalists is the ratio of the cross section with screening versus the cross section with bare nuclei. This quantity is call the enhancement factor, flab = σs(E)/σb(E) [3]. Using a simple screening model which fits the data
well, the enhancement factor is flab = σs(E)/σb(E) =
ES(E + Ue)
E + UeS(E)
e√(EG/(E+Ue))−√(EG/E)
Here, Ue is the effect of the shielding on the energy barrier, and is roughly a constant
[5]. For deuterium reactions in insulators, Ue is measured to be less than 30 eV. In
metals, Ue for deuterium reactions is much larger, in excess of 100 eV.
The screening energy Ue can be found for different materials by comparing σb to
σs, which can be measured by shooting a beam of particles at a material composed of
the target particles [33]. Several examples are shown in Table 3.2, a subset of the table presented in [34]. In this table, the target and beam particles were both deuterium. This effect was also tested with a3He beam fired at deuterated Pt, and it was found
that the effect was not beam dependent [34]. Interestingly, the values differ greatly between metals and other situations like insulators, semiconductors, and gases.
In metals, Ue varies with the free electron concentration and the temperature [32].
The results are empirically found to follow a classical Debye model scaling. As tem-perature increases, the effect of screening decreases. Variations between metals seem
to relate to the number of free electrons [34]. However, metals have structure differ-ent than plasmas. Initial work on screening models more appropriate for metals show more significant effects than those found in experiment [5]. The current mechanism for screening of the powers seen in experiment is unclear.
3.3
Fleischmann and Pons
The following discussion of the Fleischmann and Pons 1989 announcement and its repercussions is based on an input from Dr. P. Hagelstein [13].
On March 23, 1989, Fleischmann and Pons at the University of Utah announced an incredible result: that running a voltage through electrolysis heavy water using palladium cathodes resulted in excess heat so great that it could not be explained by chemical means. Fleischmann conjectured that the effect was due to deuterons
somehow reacting to form 4He, and hence the energy of the order of nuclear
reac-tions. It seemed that the only two possibilities were: they may have stumbled across something amazing, or they made serious experimental errors. This announcement produced two primary responses, one from the physics community and one from the chemistry community.
The physics community had a background of about 70 years of research into nuclear physics and hence fusion, which led to the identification of possible problems with the interpretation of the experiment.
1. Energy is carried away from fusion reactions by energetic particles.
The experiment suggested that energy was not put directly into energetic par-ticles, but provided no information on the specific reaction mechanism.
2. The primary D+D reaction pathways (p+t and n+3He) were already known,
which produce energetic particles and happen about as fast as the laws of physics allow.
These known pathways happened so quickly, that once the deuterons were close enough together it would be impossible for any new mechanism to happen
fast enough to compete, as seemed to be implied by the experiments. The experiment implications would be inconsistent with relativity.
3. The reaction rates of nuclear D+D fusion can be calculated at room temper-ature. These rates are so small that it was thought that screening could not improve them enough for reactions to occur sufficiently fast to be consistent with the observations.
Some in the chemistry community had a very different response. A new physical process was on the table, so the absence of a corresponding theoretical picture was not an impediment. Additionally, Fleischmann was a well-regarded electrochemist. A 30% to 50% excess heat effect had been measured, when 0.1-1% accuracy was common for calorimetry in the field.
Efforts to reproduce the experiment, mostly negative, followed. On May 1st,
American Physics Society (APS) included in their regular meeting a session on cold fusion results of experiments, most of which were very negative. The viewpoint was put forth that the original announcement was an error at best, and a hoax at worst. This viewpoint was solidified by this meeting, many talks at conferences, books, and the DoE review of the work in 1989, done by the Energy Research Advisory Board (ERAB).
The experiment had originally been presented as a simple (sophomore-level) elec-trochemistry experiment, and early reproduction attempts appeared to treat it as such. There was little information on the operation requirements for the original experiment available at this time. In less than forty days of time, there was not enough information to determine the necessary conditions for operation. Finding the necessary conditions took other groups years; within two years time successful reproductions had occurred at SRI and other labs.
In addition to the correctness of the experiment, there were two other large con-siderations: the funding and reputation of all other science fields. At the time of the announcement, cold fusion was a topic very much in the public eye. It was appearing in magazines, newspapers, and television. Since science is funded by the good will
of the public, who are generally content with continuing funding. However, a large failure receiving funding and in the public eye had the potential to diminish funding for all (other) scientific fields. Likewise, the reputation of science as an honorable, competent discipline would be tarnished. Since there was little guarantee that the effect existed, or was of a nuclear nature, it could have been very risky for scientists to allow attention on cold fusion for very long.
Even at the present time, there are still very strong feelings on both sides of the debate. On one hand, people perusing experiments in the lab continue to see abnormalities. On the other hand, most physicists are convinced that there can be no new effects, and view the work with skepticism. Mainstream reproduction attempts have not been conducted in recent times, even though the experiment is now much better understood. Due to the absence of funding, it is difficult to perform rigorous scientific experiments.
3.4
Experiments after Fleischmann and Pons
Since 1989, many experiments have been performed in the field of low energy nuclear reactions. An archive of many of these papers can currently be found at http://lenr-canr.org, with around 250 authors and 900 papers as of 2007. Additionally, twelve international conferences on cold fusion (ICCF) have been held across the world, each with around 100 papers submitted. For instance, the proceedings from the tenth conference (ICCF10) has 1013 pages devoted to 90 papers on experiments, related experimental topics like electron screening and calorimetry practices,and discussions of social topics like website maintenance and teacher debates [15]. The experiments in the field have varying experimental set-ups and detect nuclear effects in a variety of ways: excess heat, protons, neutrons, tritium, and helium. It is worth noting that the observation of particles is generally anti-correlated with the observation of excess heat. Early experiments have a large variance in repeatability, though in recent times this has improved greatly.
3.5
The 2004 DoE review
In 2003 P. Hagelstein (MIT), M. McKubre (SRI), D. Nagel (George Washington University), T. Chubb (NRL and Research Systems Inc.), and R. Hekman (Hekman Industries) asked the DoE to do a second review of cold fusion [31]. In recent years, Cold Fusion had been identified with ESP and UFOs. Their aim was for the DoE to publicly recognize the research in this field as science rather than as not science. They approached the DoE because of strong experimental evidence.
There were a total of eighteen reviewers from fields related to cold fusion such as materials science, chemistry, nuclear physics and atomic physics. Written work was available to all reviewers, and nine attended oral presentations. The content of the work was selected by the cold fusion scientists who requested the review; however, unlike the initial DoE ERAB report which allowed for unlimited material, this review was restricted to fifteen pages and seven presentations that occurred in one morning and one afternoon. The eighteen reviewers were charged with three tasks, quoted from the mailed review charge letter below [7]:
1. “Evaluate the experimental evidence presented for the occurrences of nuclear reactions in condensed matter at low energies (less than a few electron volts).” 2. “Determine whether the evidence is sufficiently conclusive to demonstrate that
such nuclear reactions occur.”
3. “Determine whether there is a scientific case for continued efforts in these stud-ies, and, if so, to identify the most promising areas to be pursued.”
These charges were developed while the fifteen page review material was being pre-pared. Note that while the review material focused on excess power measurements, by asking specifically for evidence of nuclear reactions the first review charge implies a need for energetic reaction products to be present as evidence. These particles are not present quantitatively in excess heat experiments. The second question has the same issue, and in light of the first question, can only be answered negatively. The
DoE did not include a charge on excess power or energy measurements, which were known in advance to be the focus of the review material.
The reviewers’ general response to the body of work was that reproducibility, documentation, credibility, and high level direction were all problems [2]. However, many reviewers found the body of work convincing that some interesting new effect was occurring, and that individual well written proposals should be funded.
While a small few were impressed that reproducibility had been improving in the field over time, most were concerned that even within the same lab, the ability to reproduce an experiment was spotty, and the parameters which led to the effect were not well known. Many reviewers felt that this was attributable to a lack of consistent documentation of the trials done and characterization of the experimental apparatus. These viewpoints are somewhat surprising, since the reviewer charges never brought up the issues of reproducibility, the review document gave instances of multiple labs repeating the same experiment, (implying good reproducibility), and questions about reproducibility were directly answered at the oral presentations with the assurance that several labs were reporting 100% reproducibility of excess heat in addition to other effects.
The reviewers were divided on the likelihood that fusion was the cause of the anomalous signals seen in the experiments presented [2]. Two individuals thought that the evidence presented was conclusively nuclear reactions, though one of these individuals was still skeptical. Three reviewers did not find the current body of work sufficiently different from the original experiment, or the credibility of the field high enough, for this body of work to merit close review. The rest of the reviewers had intermediate opinions. Five thought it was possible that the evidence could be fusion related. Four agreed that the results were anomalous, but felt that it was more likely that a new undiscovered process was behind the results than fusion reactions. Four did not think that the experimenters had properly considered and ruled out all of the possible experimental errors (such as a chemical reaction between deuterium and oxygen creating the heat), which would explain the results with already understood theories. Overall, the majority of reviewer comments recognized that some abnormal
effect was occurring, whether or not it was related to fusion. This result is very positive and significant, given how easy it would have been to ignore the entire body of work due to social stigma and preconceived opinions [15]. Additionally, many reviewers made positive comments on the excess power measurements.
The reviewers were much less divided in their recommendations for future funding of this work by the DoE [2]. One felt that the DoE should specifically fund research in this area. Eleven agreed with varying levels of enthusiasm that individual, careful proposals should be considered if they met certain conditions. While these conditions varied from reviewer to reviewer, they often included a clear proposal as to the purpose of the experiment, a clear description of how this experiment differed from previous ones, or what knowledge would be obtained by the results of this experiment. One reviewer recommended that such proposals should be small, while another suggested a specific proposal to reproduce the work of S. Jones in another lab. One reviewer felt no funding should be given. One did not reply to the question directly and had a fairly negative view of the work, while four did not comment on whether or not the DoE should fund, but did say that work should be continued in the field.
The benefit of this review is that despite the initial very difficult challenges laid out by the DoE, the final summary report showed mixed opinions on the possibility of cold fusion. Many took notice that the review was requested of the DoE by the field. Such a request would not have been made without great confidence in the body of evidence produced. The evidence in the review document was compelling enough for many reviewers to rethink their opinion of the field. As a result, attitudes are changing elsewhere; papers are being considered for mainstream journals, some papers are in print, and several commercial ventures have been founded [15]. Lenr-canr.org is also reporting record downloads, comparable to the amount of downloads for the Physical Review journal website.
3.6
Previous Work on the Yang-Koldamasov
Ef-fect
Work began on this effect in the mid 1990s in Russia. Koldamasov developed a cell, with heavy water filled pores, which released excess heat when irradiated with ultrasound [29]. However, the energy could not easily be extracted in a high quality form, and so development began on a hydroelectric machine, which eventually became the current device under test [29].
During this time period, Dr. Hyunik Yang met Dr. Koldamasov, and together they published ”Explosive Generation of Isotopes/Nucleosynthesis”. They created a patent together for the current device which divided up commercial rights across the globe [29].
The patent application details a machine as follows [1]:
• an operating fluid appropriate for generating ionization and nuclear fusion re-actions
the fluid can be either
– light water with resistivity larger than 106Ωm
– light/heavy water mixture between 100:1 to 100:30, again with resistivity higher than 106Ωm
– mineral oil of viscosity ranging from 5 to 30 If water is used, a purifying unit will be necessary.
• an output pump designed to make the operating fluid at a predetermined pres-sure
The pump can be a gear, piston, or vane pump. In addition, a pulse generator is needed to supply pulses at a frequency determined by the resonance of the fluid and metallic and dielectric inserts.
• a dielectric body with an inlet and outlet to allow for the passage of fluid, perhaps multiple holes with different diameters.
In this paper, this body will be called the cell. The different diameters are used to hold the insert described below using pressure from the pump, and to allow cavitation formation just after the insert by reducing the pressure. An image of the cell used in the experiment discussed here is shown in Fig. 6-1
• at least one metallic insert with a through hole for the dielectric, which allows for the passage of fluid
The metallic insert can be copper, aluminum, gold, silver, palladium, or any alloy which will facilitate the ionization of the operating fluid by emitting elec-trons.
• a dielectric insert with at least one through hole for the passage of fluid, to be inserted in the dielectric body, promoting nuclear reactions through cavitation emission
The material of this insert can be industrial plastic, Pyrex, crystal, ceramic, ruby, or silicon carbide. It must retain the electrons emitted by the nuclear fusion reactions due to cavitation emission.
In this paper, this insert will be called the tip. An image of it is available in Fig. 6-2.
• at least one pair of metal members to control the polarity of the ionized oper-ating fluid or collect electricity
The patent application also provides a procedure for running the device [1].
In the early 2000s, Dr. Yang worked with Baranov in developing a water unit which could be spiked with heavy water to produce the effect [29]. At the Keldish Institute in Moscow, Director Andre Desyatov, Prof. Vladimir Vysotskii of Kiev Shevchencko University and Prof. Alla Kornilova of Moscow University worked on a unit similar to the original unit, with additional sensors, a vacuum pump, and better RF shielding [27] [29].
As of 2005, two Russian groups were working on the project in addition to work being performed in Korea and Canada. The second Russian group was composed of Evgeny Pavlovich Velikhov, Gerasimovich Gnedenko, and Vital’evich Goryachev of the Kurchatov Research Institute also worked on the device [27]. The latter two are patent holders of the device under Russian patent RU2232210 [27]. The Korean group includes Dr. Hyunik Yang, and Dr. Nahm Choe, mechanical engineering professors at Hanyang University in Korea [27].
The various units in existence have a fair amount of variation between them. The Keldish units have a gear pump, sharp angles, and are fairly compact, while the Korean built units generally have longer pipes, smoother angles, and frequently have vane pumps [29]. Pipe diameter and reservoir size also vary. Sometimes the connecting tubing is all metal, other times there are plastic components.
In 2004, the company iESi was founded in Edmonton, Canada [29]. This company did several live presentations for various scientists and investors, including one around Feb 13, 2005 for scientists and one June 6, 2005 for investors[25] [27]. Scientists who attended the presentations in February include P. Hagelstein and D. McConnell. Attendees in June and July include M. Fleischmann, M. McKubre, and D. McConnell [25] [27] [29].
In February, visitors were shown large arcing and discharges through the tip, oil, and inch thick acrylic cell in addition to at least 3300 watts of heat production (associated only with heating the oil, and not the frame and room) at an operating power of 800 watts based on temperature measurements of the reservoir before and after the run [25] [29]. However, little to no scientific data was presented. While observers had high confidence that the machine was working, there was no way to be certain that the effect was not being faked in some way [25] [27]. iESi made two claims to P. Hagelstein during his February visit, though these were not necessarily observed [25]:
1. At maximum operation, the machine produces a factor of 5 gain at temperatures around but less than 100 C.
2. The effect is nearly 100% reproducible. In support of this claim, the machine was operated three times during the February visit with apparent discharge and excess heat.
P. Hagelstein recommended an independent observation of the effect to increase cred-ibility [25].
The later visits in June and July looked visually different. In both visits, the arcing through the oil was primarily in the direction of oil flow, unlike the earlier visit where arcing was perpendicular to it. The June visit was primarily a demonstration for investors, and the effect was not verified with instrumentation, so it is not clear that the machine was producing excess heat at this time. An attempt was made to confirm the effect in July which produced a null result. Between the February demonstration and the two later demonstrations the behavior of the machine was both visually and measurably different.
At ICCF12 there were two presentations on the Yang-Koldamasov, one done by Steven Krivit of New Energy Times, and one by its current operators on their findings and investigations with 11B in the device [27] [23]. Journalist S. Krivit presented
both the amazing claims of the device and the state of the current research. While the designers claimed high reproducibility, control in operating and turning off the device, and power of commercial magnitude [27], there was little to no scientific data collected, little to no published work, and no independent reproductions [28]. While iESi claimed that independent audits had been conducted, the content of these audits was not publicly released because they were the private property of those who paid for them [27].
For the rest of this thesis, the working fluid will be taken to be oil, since this was the working fluid in the experiment that Dr. Yang and FRC requested confirmation of.
Figure 3-2: M. Fleischmann observing a damaged cell, provided by S. B. Krivit, c
Chapter 4
Non-Nuclear Explanations:
Combustion or Measurement Error
This chapter discusses two of the possible explanations for the Yang-Koldamasov effect which are not nuclear in nature: the possibility of measurement error, and combustion. I do not have access to the original devices that the effect was seen on, so any discussion of measurement error is only conjecture. Discussions of combustion reflect simplified models that have been proposed in our collaboration at MIT.4.1
Measurement Error
A single measurement error does not appear to account for the excess power seen at iESi during their early demonstrations. It is the opinion of an observer of some of the iESi demonstrations (Denis McConnell) that the heat power out was greater than the maximum motor output, so power measurement error alone is not the cause of the large power gain.
There have been two independent visits to iESi by P. Hagelstein, which each mea-sured the power or energy out in very different ways. The possibility of measurement error needs to be considered separately for each of these independent measurements. At the first visit in February, the measurement of energy out was one integrated over time. The reservoir temperature was taken before the run began and after it
was completed. The temperature of the reservoir was independently verified by the observer Denis McConnel, who used his own thermocouple to check for spatial varia-tions in the tank by measuring at multiple points. Since the temperature difference is so different from start to finish over the 15 minute run, a small thermocouple error of around 2 C would make a small percentage change over the range of about 50 C. For this calculation, four measurements were used: oil specific heat, tank volume, tem-perature difference, and electrical energy in. While a combination of measurement errors could have lead to an apparent effect, it is unlikely that a single measurement error could have resulted in the 300% to 500% gain observed.
On a later visit in July, the measurement of power was achieved using differential calorimetry over the cell. P. Hagelstein observed that the thermocouples had an offset error, which caused the total heat power to seem to grow with increased flow rate [12]. Because the temperature difference over the cell is only a few degrees, a thermocouple offset of the order of 1 to 2 C results in a large percentage change in the results of the calculation.
4.2
Combustion
To determine if combustion was a likely cause of the effect observed at iESi, an order of magnitude complete combustion calculation can be compared to the iESi observations of a power gain of roughly a factor of three to five when running around 800 W over 15 min with about 30 kg of oil, corresponding to a temperature rise of about 50 C.
There are three requirements necessary for combustion: fuel, oxygen, and suffi-cient energy to begin the reaction. Assuming that the oil provided will have suffisuffi-cient volatiles for combustion, and that the arcing and palladium catalysts will allow com-bustion, the limiting factor for combustion will be oxygen. This scenario is called fuel-rich.
The amount of oxygen in the system can be computed by Henry’s law: C = x2× p

![Figure 2-1: Hubbert Logistic Graph Predicting US Oil Production [17]](https://thumb-eu.123doks.com/thumbv2/123doknet/14195381.478960/23.918.143.784.113.479/figure-hubbert-logistic-graph-predicting-oil-production.webp)
![Figure 2-2: Hubbert Logistic graph predicting world oil production [20]](https://thumb-eu.123doks.com/thumbv2/123doknet/14195381.478960/26.918.145.779.115.497/figure-hubbert-logistic-graph-predicting-world-oil-production.webp)
![Figure 2-4: World Oil Production Scenarios, Based on Variable Growth Rates and Total Oil Estimates [42]](https://thumb-eu.123doks.com/thumbv2/123doknet/14195381.478960/29.918.136.787.105.474/figure-world-production-scenarios-based-variable-growth-estimates.webp)
![Figure 3-1: Fusion Cross Sections as a Function of Deuteron Energy [37]](https://thumb-eu.123doks.com/thumbv2/123doknet/14195381.478960/38.918.137.783.216.906/figure-fusion-cross-sections-function-deuteron-energy.webp)