Publisher’s version / Version de l'éditeur:
Journal of the Acoustical Society of America, 94, 3, pt. 1, pp. 1409-1414, 1993-09
READ THESE TERMS AND CONDITIONS CAREFULLY BEFORE USING THIS WEBSITE.
https://nrc-publications.canada.ca/eng/copyright
Vous avez des questions? Nous pouvons vous aider. Pour communiquer directement avec un auteur, consultez la
première page de la revue dans laquelle son article a été publié afin de trouver ses coordonnées. Si vous n’arrivez pas à les repérer, communiquez avec nous à PublicationsArchive-ArchivesPublications@nrc-cnrc.gc.ca.
Questions? Contact the NRC Publications Archive team at
PublicationsArchive-ArchivesPublications@nrc-cnrc.gc.ca. If you wish to email the authors directly, please see the first page of the publication for their contact information.
NRC Publications Archive
Archives des publications du CNRC
This publication could be one of several versions: author’s original, accepted manuscript or the publisher’s version. / La version de cette publication peut être l’une des suivantes : la version prépublication de l’auteur, la version acceptée du manuscrit ou la version de l’éditeur.
Access and use of this website and the material on it are subject to the Terms and Conditions set forth at
Ensemble average requirement for acoustical measurements in noisy
environment using the m-sequence correlation technique
Zuomin, W.; Chu, W. T.
https://publications-cnrc.canada.ca/fra/droits
L’accès à ce site Web et l’utilisation de son contenu sont assujettis aux conditions présentées dans le site
LISEZ CES CONDITIONS ATTENTIVEMENT AVANT D’UTILISER CE SITE WEB.
NRC Publications Record / Notice d'Archives des publications de CNRC:
https://nrc-publications.canada.ca/eng/view/object/?id=f8ce68f7-8320-4bbc-ac5f-8c9f0542c809 https://publications-cnrc.canada.ca/fra/voir/objet/?id=f8ce68f7-8320-4bbc-ac5f-8c9f0542c809
Ense m ble a ve ra ge re quire m e nt for a c oust ic a l m e a sure m e nt s in noisy
e nvironm e nt using t he m -se que nc e c orre la t ion t e c hnique
N R C C - 3 6 9 9 6
Z u o m i n , W . ; C h u , W . T .
S e p t e m b e r 1 9 9 3
A version of this document is published in / Une version de ce document se trouve dans:
Journal of the Acoustical Society of America, 94, (3, pt. 1), pp. 1409-1414,
September 1993
http://www.nrc-cnrc.gc.ca/irc
The material in this document is covered by the provisions of the Copyright Act, by Canadian laws, policies, regulations and international agreements. Such provisions serve to identify the information source and, in specific instances, to prohibit reproduction of materials without written permission. For more information visit http://laws.justice.gc.ca/en/showtdm/cs/C-42
Les renseignements dans ce document sont protégés par la Loi sur le droit d'auteur, par les lois, les politiques et les règlements du Canada et des accords internationaux. Ces dispositions permettent d'identifier la source de l'information et, dans certains cas, d'interdire la copie de documents sans permission écrite. Pour obtenir de plus amples renseignements : http://lois.justice.gc.ca/fr/showtdm/cs/C-42
Ensemble average requirement for acoustical measurements in
noisy environment using the m-sequence correlation technique
Wang Zuominal
Institute of Acoustics, Tongji University, Shanghai, 200092, China
W. T_\Chu
Acoustics Laboratory, Institute for Research in Construction, National Research Council of Canada, Ontario KIA OR6, Canada
(Received 6 January 1993; accepted for publication 26 May 1993)
This paper describes an experiment that provides additional evidence to demonstrate the possibility of making acoustical measurements in noisy environments by using an ュMウ・アオ・ョセ・@
correlation te«hnique. A criterion for choosing the proper number of synchronous averages 1s established and a demonstration of making noise reduction measurement between two rooms is also given.
PACS numbers: 43.55.Rg, 43.60.Gk
INTRODUCTION
In situ architectural acoustic measurements have
al-ways been difficult because of the influence of high back-ground noise. In Ref. 1, Tachibana and Ishii suggested using an m-sequence correlation method for improving the signal-to-noise (SIN) ratio. Them-sequence is also known as the maximum-length sequence (MLS) or the periodic pseudorandom sequence. In their proposal, the m-sequence was used as an on-off modulation for a random noise input signal and the correlation was carried out in the usual manner. An improved version of this method to minimize transient effects has been suggested by Eriksson and Lind-blad in Ref. 2.
A more efficient and direct application of the m-sequence correlation method for architectural acoustic measurements was proposed by Schroeder and his colleagues. 3•4 Based on the periodic nature of the
m-sequence, synchronous averaging is possible and a fast algorithm exists for computing the correlation function. A review of this technique has been presented in Ref. 5. Some preliminary results of measuring reverberation time in a noisy environment have also been given.5 The accuracy of the measurements will depend on the SIN ratios and the number of ensemble averages used. Therefore, a criterion for choosing the number of ensemble averages is necessary. In this paper, we will present an empirical formula for choosing the number of averages based on experimental results obtained in a reverberation chamber and provide a demonstration of the technique for noise reduction mea-surement of a wallboard between two rooms.
I. MEASURING METHOD
According to Schroeder, 6 the ensemble average of the squared sound pressure decay,
<i<
t)), at any point in a •lThe work described in this paper was carried out in the AcousticsLaboratory of IRC/NRC while the author was a visiting scholar.
1409 J. Acoust. Soc. Am. 94 (3), Pt. 1, Sept. 1993
room is equal to a certain integral over the squared impulse response h2( -r) of that point in the room as given by the following equation:
(p2(t))=G
i""
h2(-r)dr, (1)
where G is proportional to the power of the source. In general practice, when interrupted white noise excitation is used, the ensemble average would require a large number of measurements. By contrast, the right-hand side of Eq. ( 1 ) requires only a single measurement of the impulse re-sponse. A comparison of decay measurements using Eq.
( 1) and the decay-curve averaging method has been given by Chu. 7 For t=O, Eq. (1) gives the steady-state mean-square pressure. In the presence of high background noise, the best way to determine the impulse response, h ( r), is the cross-correlation method using an m-sequence as the white noise input. According to random-noise theory, 8
ィHイI]HセI@
faT
Si(t-r)[S0(t)+n(t)]dt, (2)where Si(t) and S0(t) are the input and output signals, respectively, and n(t) is the background noise. If an m-sequence is used as the input signal, T should be one period of the m-sequence. Since the input signal and the background noise are uncorrelated, the influence of the background noise is minimized by the correlation process and it can be reduced further by additional averaging over many periods of the signal. Another advantage of using the m-sequence as the input signal is that Eq. (2) can be com-puted very efficiently using the fast Hadamard transform technique.4
II. MEASUREMENT OF SOUND PRESSURE LEVELS
Measurements to evaluate this process for extracting sound pressure levels from added noise were taken in a small empty reverberation chamber with dimensions 3.17 m X 2.59 mX 1.96 m for one fixed microphone and source position. A small patch of glass fiber material was added to
Microphone Loudspeaker Loudspeaker
FIG. 1. Schematic drawing of experimental equipment.
the room to lower the reverberation time to match the period of the m-sequence used. This is necessary to ensure that the spacing of the frequencies of the excitation signal is less than the average frequency spacing of adjacent max-ima of the room response. An IBM/ AT -compatible micro-computer was used together with a 16-bit A/D board (An-alogic model STB-16) for both data acquisition and analysis. An m-sequence of length= 32 767, generated mathematically, was output through a D/ A channel of the
AID board at a clock frequency of 12.787 kHz. The m-sequence was low-pass filtered at 5.62 kHz before it was fed through a graphic equalizer (Yamaha model DEQ7) and a power amplifier, and radiated into the room through a loudspeaker placed at a corner of the room. The acous-tical signal at a fixed location in the room was measured with a calibrated 12.7 mm B&K condenser microphone. The microphone signal was fed through an antialiasing filter (Standford Research System, Inc. model SR640) set at 5.62 kHz before it was sampled at the same clock fre-quency of 12.787 kHz. Special programs were written for the ensemble averaging and impulse response calculation based on the fast Hadamard transform procedure of Ref. 5. One-third-octave band analysis was performed by digital filtering of the broadband impulse responses. Written in assembly language, the routine takes about 4.5 min to per-form 100 ensemble averages on a 20 MHz/386 machine. A Tracoustics model NS-100 noise source at another corner of the room provided the additional injected back-ground noise for this investigation. The pink noise gener-ator of the NS-100 was also an m-sequence signal whose period has been modified and extended to approximately two hours by using a sequence length of 231-1 and a clock frequency of 300 kHz. Thus, within the measurement pe-riod of our experiment, it can be considered as a random background noise. A fixed level was used for the injected background noise. Different levels of the m-sequence signal were used to provide different values of the S/N ratios. One-third-octave band and the A-weighted levels of the m-sequence signal and the injected background noise were measured separately with the Norwegian Electronics model NE 830 real-time analyzer to establish the S/N ra-tios. Figure 1 shows a schematic drawing of the arrange-ment of the experiarrange-mental equiparrange-ment.
The spectrum of the injected background noise was
co 80 "0 セ@ 75 .3 セ@ iil 70 "' セ@ セ@ 65 .• c "' 0 (f) 60 UU uMセセセMlセセセセセセセセMl Mw@ 1 00 160 250 400 630 1 k 1 .6k 2.5k 4k Frequency, Hz
FIG. 2. One-third octave-band spectra of the injected background noise and the m-sequence signals.
measured first with the real-time analyzer. Then the graphic equalizer was used to adjust the spectrum of the m-sequence signal to approximate that of the injected background noise, so that the SIN ratios remain fairly uniform over the frequency range of interest. The A-weighted broadband values were used to identify the overall S/N ratios. Figure 2 shows a comparison of the spectrum of the injected background noise with the sound for the m-sequence signals.
For each level of the m-sequence, without the injected background noise, the sound pressure levels (SPL), both one-third-octave band and broadband A-weighted, of the radiated sound were measured first via the impulse re-sponse technique and digital filtering to establish the "true" values. Then the measurements were repeated for the simulated environment with injected background noise using the same technique with ensemble averaging. Each period of the signal constituted one sample and the tem-poral signal was averaged over different number of periods before the impulse response and the subsequent SPLs were computed. The number of ensemble averages was increased until the recovered broadband SPL was less than 1 dB from the "true" value.
When the "true" values obtained by the impulse re-sponse technique were compared with the results measured by the NE 830 analyzer, a systematic error ofless than 0.5 dB was observed in all the frequency bands except at the 100-Hz band where the difference was 0.6 dB. The exact reason has not been established. But this should not pose any serious problems when both the "true" and recovered SPL were measured with the same technique.
Figure 3(a) shows the measured broadband impulse response with no injected background noise. The impulse response has been normalized by its maximum value. A similar broadband impulse response recovered in the sim-ulated noisy environment is presented in Fig. 3 (b). The
SIN ratio for this case was -10.4 dB. Using 140 averages, the recovered impulse response compared well with that of Fig. 3 (a) as indicated by their differences plotted in Fig. 3(c), whose magnitude axis has been magnified ten times. It shows that a satisfactory result can be obtained in a noisy environment with the current method when a suffi-cient number of ensemble averages has been applied.
0.10,---- - - - -- -- -- - - ,
Time, sec.
FIG. 3. Comparison of the broadband impulse responses measured with different S/N ratios: (a) MLS signal only; (b) MLS signal was 10.4 dB below injected background noise (recovered after 140 averages); (c) dif-ference between the two impulse responses of (a) and (b).
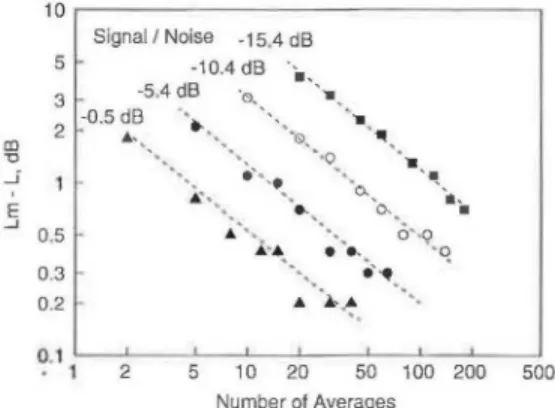
More quantitative results are presented in Figs. 4 and 5 where the differences between the recovered SPL (Lm)
and the "true" SPL ( L) are plotted against the number of averages for different S/N ratios. Even though the spec-trum of the radiated m-sequence sound has been adjusted to approximate that of the injected background noise from 100Hz to 5kHz, the differences between Lm and L varied among the different one-third-octave bands. Table I tabu-lates the mean and the standard deviation of ( Lm- L) from the 18 one-third-octave band results for the four dif-ferent S/N ratios investigated as a function of the number
10 Signal / Noise -15.4 dB 5 -10.4 dB
••
3 -5.4 dB ""'·..
-0.5 dB.
..
..
2...
' ' 0, ᄋ セ@ (!) "0 ' ··o•
_j.
•'',•
.. Mセ@···.
0. ·*-E..
·a. • ...I 0.5.
セ@...
...
0•,9•
·
..
·q 0.3 •..
...
0.2..
M セM...
.
·-0.1 1 2 5 10 20 50 100 200 500 Number of AveragesFIG. 4. Differences between the recovered and the "true"
1
octave-band SPL versus number of averages for different S/N ratios-dashed lines are plots of Eq. (5).of averages used. The mean values of the one-third-octave-band results and the broadone-third-octave-band A-weighted results are plotted in Figs. 4 and 5, respectively. The experimental results are presented by symbols in these figures and they show that, with sufficient number of averages, the recov-ered sound-pressure levels compare well with the "true" values. The errors can be reduced to less than 1 dB.
In addition, the computed reverberation times using the recovered impulse response curves and Eq. ( 1) also show good comparison with the "true" value as indicated in Fig. 6 except for the case with S/N = -15.4 dB where only 180 averages were used and this was apparently not enough to recover the "true" impulse response. The one-third-octave-band reverberation times were calculated from the digitally filtered impulse response curves using the initial 10 dB of the computed decay curves. Larger differences were observed if the reverberation times were calculated using more than 10 dB of decay because of the nonlinearity in the decay curves. One should bear in mind that in this small empty reverberation room, the sound field is nondiffusive below 630 Hz as suggested by the Schroeder's large room limit criterion.9
Ill. ESTIMATION OF ACCURACY
To make the proposed procedure useful for field mea-surements, it is necessary to establish an empirical formula
1D r---, Signal/ Noise -15.4 dB 5 ·10.4 dB (!) 3 ·0.5 dB -5.4 dB ··o ·e. 2 A. • "0 NNNNセM E ..J 0.5 0.3 0.2 0.1 1 2 5 10 20 50 100 200 SOD Number of Averages
FIG. 5. Differences between the recovered and the "true" broadband A-weighted SPL versus number of averages for different S/ N ratios-dashed lines are plots of Eq. (5).
TABLE I. Mean and standard deviation of the differences between the recovered and the "true" sound pressure levels of the 18 one-third octave-band results from 100Hz to 5 kHz as a function of the number of averages used in the recovery process. Results are for four different signal-to-noise ratios.
S/N=-0.5 dB S/N=-5.4 dB
Averages Mean Sigma Averages Mean Sigma
2 1.8 0.4 2 4.3 0.6 5 0.8 0.2 5 2.1 0.5 8 0.5 0.2 10 1.1 0.3 12 0.4 0.1 15 1.0 0.2 15 0.4 0.1 20 0.7 0.2 20 0.2 0.2 30 0.4 0.2 30 0.2 0.1 40 0.4 0.2 40 0.2 0.1 50 0.3 0.1 65 0.3 0.1 80 0.1 0.1
for estimating the number of averages required for a given
SIN ratio and an anticipated accuracy. Results presented in Figs. 4 and 5 suggest the following formulation:
Lm-L=ANB, (3)
where Lm is the recovered SPL for the case with injected background noise, L is the "true" SPL obtained without the injected background noise, and N is the number of ensemble averages. A and B are the coefficients to be de-termined. Using the least-square method, Eq. (3) was fit-ted to each of the four cases of different SIN ratios. It turned out that the coefficient B could be considered as
4.0 NMMMMMMMMMMMMMMMセ@ セ@ 3.5 (/) Q) 3.0 E F 2.5 c 0 セ@ 2.0 (jj € 1.5 Q) 6'i a: 1.0 {a) S/N
=
·0.5 dB 0. 5 L...L...L...l.-J---L---L...L....L...L...J---L---L...L....L...l.-J---L....J..J 100 160 250 400 630 1 k 1.6k 2.5k 4k Frequency, Hz 4.0 . - - - -- - -- - - , セ@ 3.5 (/) Q) 3.0 E F 2.5 c 0 セ@ 2.0 (jj € 1.5 g! セ@ 1.0 {c) S/N = -10.4 dB 0 ·5 100 160 250 400 630 1 k 1.6k 2.5k 4k Frequency, Hz SIN= - 10.4 dB SIN= -15.4 dBAverages Mean Sigma Averages Mean Sigma
2 7.6 0.8 5 8.7 0.8 5 4.7 0.8 10 6.5 0.9 10 3.1 0.7 20 4.1 0.6 20 1.8 0.5 30 3.2 0.5 30 1.4 0.3 45 2.3 0.4 45 0.9 0.3 60 1.9 0.3 60 0.7 0.3 90 1.3 0.3 80 0.5 0.1 120 1.1 0.2 110 0.5 0.2 150 0.8 0.2 140 0.4 0.1 180 0.7 0.2
independent of the SIN ratio, whereas A depended on the
SIN ratio according to the following relationship
A=3.12e-o.tsH,
(4)
where A.L is the broadband A-weighted SIN ratio in dB. Using results of the case with SIN= - 10.4 dB, we arrived at the following empirical formula for estimating the num-ber of averages to be used for any given SIN ratio and accuracy; 4.0 . - - - . セ@ 3.5 (/) Q) 3.0 E F 2.5 c 0 セ@ 2.0 Qj セ@ 1.5 セ@ 1.0 (b) S/N = -5.4 dB 0 ·5 100 160 250 400 630 1k 1.6k 2.5k 4k Frequency, Hz 4.0 . - - - . セ@ 3.5 (/) Q) 3.0 E F 2.5 c 0 セ@ 2.0 (jj
-e
1.5 g! セ@ 1.0 {d) S/N=
·15.4 dB ' I \ 0 ·5 100 160 250 400 630 1k 1.6k 2.5k 4k Frequency, Hz (5)FIG. 6. Comparison of the recovered (dashed line) and the "true" (solid line) reverberation times for different S/N ratios. Number of averages used were: (a) 40, (b) 80, (c) 140, (d) 180.
Microcomputer AID Boa rd m-sequence Generator Receiving Room 12.7mm Microphone Loudspeaker Source Room 12,7 mm Microphone Loudspeaker
セ N@
FIG. 7. Schematic drawing of experimental equipment for noise reduc-tion measurement.
where fl.p=Lm-L. Equation {5) has been plotted in Figs. 4 and 5 (dashed lines) and it fits fairly well with both the one-third-octave-band and the broadband A-weighted ex-perimental data.
IV. MEASUREMENT OF NOISE REDUCTION
Noise reduction across a single layer of 16-mm-thick gypsum wallboard was measured at the National Research Council transmission loss test suite with additional back-ground noise injected in the receiving room to simulate noisy environments often encountered in field measure-ments. The m-sequence correlation technique was used and the results were compared with results obtained with the conventional method under normal quiet laboratory con-ditions. A preliminary report of this experiment was pre-sented in Ref. 10.
Figure 7 shows a schematic drawing of the arrange-ment of the experiarrange-mental setup using the same instrumen-tation as before. The experimental procedure and data analysis were also similar. In this investigation, the Tra-coustics model NS-1 00 noise source was used at a corner of the receiving room. Six microphone positions were used in both the source and the receiving room. Without the added background noise, the sound pressure levels in both the source and the receiving rooms were measured with the real-time analyzer for establishing the reference noise-reduction values of the wall specimen.
In the simulated experiment with a noisy environment, the one-third-octave-band spectrum of the injected back-ground noise in the receiving room was measured first with the real-time analyzer. With the injected background noise turned off the graphic equalizer was used to adjust the spectrum of the m-sequence signal so that the spectrum of the transmitted signal in the receiving room matched that of the injected background noise. Figure 8 shows a com-parison of the two spectra measured at one location in the receiving room. The broadband A-weighted S/N ratio was -9.9 dB. According to Eq. (5), the required number of averages was 250 to ensure the measured SPL would be within 0.2 dB from the "true" value.
Table II shows the one-third-octave-band results of the difference between the recovered and the "true" SPLs mea-sured at the six microphone positions in the receiving room
Wd イMMMMMMMMMMMMMMMMMMMMMMMMMMMセ@ CD 65 "0 -.; a; 60 --' セ@ セ@ 55 セ@ セUP@ c: :;, セ@ 45 Injected Noise /,'" _ / m-Sequence Signal I I I I ' ...
_____
/ ' ' ' ' ' TP セセセセセセセセMlセセセセMlMu@ 125 250 500 1000 2000 4000 Frequency, HzFIG. 8. One-third octave-band spectra of the injected background noise and the transmitted m-sequence signal in the receiving room.
under the noisy and quiet conditions. These values, ob-tained after 250 averages, are slightly higher than the ex-pected values of 0.2 dB.
Figure 9 shows a comparison of the noise reduction values of a 16-mm-thick gypsum wallboard ( 10.7 kg/m2) mounted in a 2.54 m2 opening of a filler wall in the trans-mission loss test suite obtained by two different methods under two different conditions. The results were based on the averaged SPL of six microphone positions both in the source and the receiving rooms. The dotted curve shows the results obtained by the conventional method using the real-time analyzer with no injected background noise in the receiving room. The solid circles depict the results ob-tained by the correlation technique with a substantial back-ground noise (about 10 dB above the transmitted signal) injected into the receiving room. The noise reduction val-ues measured by the correlation technique agree within 0.2 dB with those obtained by the conventional method under normal conditions except at the 4-kHz band where the difference rose to 0.3 dB. Note that these errors were smaller than those reported in Table II because any sys-TABLE II. One-third octave-band results of the difference between the recovered (after 250 averages) and the "true" sound-pressure levels at the six microphone positions in the receiving room.
Lm-L
Frequency Mic #I Mic #2 Mic #3 Mic #4 Mic #5 Mic #6 Average 100 0.2 0.4 0.5 0.2 0.0 0.3 0.3 125 0.2 0.3 0.2 0.2 0.2 0.2 0.2 160 0.2 0.1 0.2 0.2 0.2 0.1 0.2 200 0.2 0.1 0.2 0.2 0.2 0.1 0.2 250 0.3 0.1 0.2 0.3 0.3 0.2 0.2 315 0.2 0.2 0.2 0.5 0.4 0.2 0.3 400 0.3 0.2 0.1 0.4 0.3 0.2 0.3 500 0.3 0.2 0.2 0.2 0.2 0.2 0.2 630 0.4 0.4 0.3 0.3 0.2 0.2 0.3 800 0.4 0.3 0.1 0.2 0.3 0.3 0.3 1000 0.2 0.2 0.2 0.3 0.2 0.2 0.2 1250 0.3 0.3 0.2 0.4 0.2 0.2 0.3 1600 0.1 0.2 0.2 0.3 0.2 0.2 0.2 2000 0.3 0.1 0.3 0.2 0.2 0.3 0.2 2500 0.4 0.2 0.2 0.3 0.2 0.3 0.3 3150 0.5 0.4 0.3 0.4 0.3 0.4 0.4 4000 0.3 0.4 0.3 0.3 0.2 0.3 0.3 5000 0.2 0.2 0.3 0.3 0.2 0.2 0.2
40r-- - - -- -- - - , !g 35 c:' 0 u -5 30 Q) a: Q) en セ@ 25 Conventional method
... ,, .•
, .1
_ . .- '\ .. _,..ri \ ,:··· .. ....ᄋᄋG セMウ・アオ・ョ」・@
• /•
•...
• •.. • · Correlation Technique RP セ Q セ RU セMl R セ U セP セ セ UセP セ P セセ Qセqセqq セセ Rセqセq セq セセ TP セ P M P d@ Frequency, HzFIG. 9. Comparison of the noise reduction results measured by the con-ventional method under quiet condition and by the m-sequence correla-tion using 250 averages under simulated noisy condicorrela-tion.
tematic errors in the measurement of SPLs were canceled when the differences between the source room and receiv-ing room results were considered. For field measurements, the following process is suggested:
( 1) Measure the spectral content and levels of the background noise in the receiving room.
( 2) Choose a comfortable level of the m-sequence sig-nal and measure its spectral content in the source room.
( 3) Estimate the transmission loss characteristic of the component to be tested.
( 4) Use the above information to adjust the graphic equalizer such that the transmitted signal will have a sim-ilar spectral content of the background noise.
( 5) Make two measurements with two different. num-ber of averages in the receiving room.
(6) From the two measured values of Lm, calculate the S/N value in the receiving room using Eq. ( 5).
( 7) Knowing the S/N value and the desired accuracy l:l.p, select the required number of averages using Eq. (5) .
V. CONCLUSION
It has been shown that acoustical measurements can be made in very noisy environments by using the
m-sequence correlation technique with synchronous aver-aging. An empirical formula has also been derived to pro-vide an estimation of the number of ensemble averages required for any given SIN ratio and accuracy. The pro-cedure has been successfully tested for the simple case of noise reduction measurements of a gypsum board wall be-tween two reverberation rooms. A procedure for field mea-surements has also been suggested.
ACKNOWLEDGMENT
The authors would like to thank Dr. R. E. Halliwell for his help in developing the computer programs used in the experiment.
1 H . Tachibana and K. Ishii, "Sound Insulation Measurement by
M-Sequence Correlation Method," lOth ICA, Sydney, Australia, 1980, paper E-13. 1.
2P. Eriksson and S. Lindblad, "An Improved M-Sequence Correlation Method for Measuring Under Low Signal-To-Noise Conditions," Proc. Inter-noise 82, 679-682 (1982).
3M. R. Schroeder, "Integrated impulse method measuring sound decay without impulse," J. Acoust. Soc. Am. 66, 497-500 (1979).
4H. Alrutz and M. R. Schroeder, "A Fast Hadamard Transform Method for the Evaluation of Measurements Using Pseudorandom Test Sig-nals, " 11th ICA, Paris, France, 1983, 6, 235- 238.
5W. T. Chu, "Impulse-Response and Reverberation-Decay
Measure-ments Made by Using a Periodic Pseudorandom Sequence," Appl. Acoust. 29, 193-205 (1990).
6M. R. Schroeder, " New method of measuring reverberation time," J. Acoust. Soc. Am. 37, 409-412 (1965) .
7W. T. Chu, "Comparison of reverberation measurements using Schroeder's impulse method and decay-curve averaging method," J.
Acoust. Soc. Am. 63, 1444-1450 (1978).
8Y. W. Lee, Statistical Theory of Communication (Wiley, New York, 1960) .
9M. R. Schroeder, "Frequency autocorrelation functions of frequency responses in rooms, " J. Acoust. Soc. Am. 34, 1819-1823 (1962) .
10Wang Zuomin and W. T. Chu, "Noise Reduction Measurements
Be-tween Two Rooms by Using a Periodic Pseudorandom Sequence," Proc. Inter-noise 92, 639-642 (1992).