Publisher’s version / Version de l'éditeur:
Annals of Glaciology, 13, pp. 180-184, 1989
READ THESE TERMS AND CONDITIONS CAREFULLY BEFORE USING THIS WEBSITE. https://nrc-publications.canada.ca/eng/copyright
Vous avez des questions? Nous pouvons vous aider. Pour communiquer directement avec un auteur, consultez la
première page de la revue dans laquelle son article a été publié afin de trouver ses coordonnées. Si vous n’arrivez pas à les repérer, communiquez avec nous à [email protected].
Questions? Contact the NRC Publications Archive team at
[email protected]. If you wish to email the authors directly, please see the first page of the publication for their contact information.
NRC Publications Archive
Archives des publications du CNRC
This publication could be one of several versions: author’s original, accepted manuscript or the publisher’s version. / La version de cette publication peut être l’une des suivantes : la version prépublication de l’auteur, la version acceptée du manuscrit ou la version de l’éditeur.
Access and use of this website and the material on it are subject to the Terms and Conditions set forth at
Extreme avalanche run-out : data from four mountain ranges
McClung, D. M.; Mears, A. I.; Schaerer, P. A.
https://publications-cnrc.canada.ca/fra/droits
L’accès à ce site Web et l’utilisation de son contenu sont assujettis aux conditions présentées dans le site
LISEZ CES CONDITIONS ATTENTIVEMENT AVANT D’UTILISER CE SITE WEB.
NRC Publications Record / Notice d'Archives des publications de CNRC:
https://nrc-publications.canada.ca/eng/view/object/?id=c578e188-c08a-48b3-87c6-d6981e4b6a70
https://publications-cnrc.canada.ca/fra/voir/objet/?id=c578e188-c08a-48b3-87c6-d6981e4b6a70
S e r
I
T H ~
National Research
Conseil national
N 2 l d
Council Canada
de recherches Canada
no.
1 6 2 6
I
5 . 2
Institute for
lnstitut de
I
BLDG-
Research in
recherche en
Construction
construction
I
Extreme Avalanche Run-Out:
Data From Four Mountain Ranges
by D.M. McClung, A.I. Mears and\P. Schaerer
Reprinted from
Annals of Glaciology 13,1989
p. 180-184
(IRC Paper No. 1626).
N R C
-
CISTIL l B R A R Y
Les parcours des avalanches ont un caractiire statistique marquant qui ne ressort
habituellement pas des calculs M s des m d l e s de dynamique des avalanches. Pour
pdvoir les parcours de fwon ratiomelle,
il faut faire intewenir 1'616ment statistique. Dans
ce document, nous @sentons et analysons des d 0 ~ 6 e s
sur les parcours exemes dans
quatre chaines de montagnes. Lorsqu'on adapte les dom&s aux &partitions de valeurs
exemes, on est en mesure de montrer comment (et pourquoi) les param6tres des valeurs
ex&mes varient selon les caracfi-etialles tomeraphiques des diffkntes chafnes.
Anrzals of Glaciology 13 1989
@ International Glaciological Society
EXTREME AVALANCHE RUN-OUT: DATA FROM FOUR
MOUNTAIN RANGES
D.M. McClung,
(Institute for Research in Construction, National Research Council of Canada, 3650 Wesbrook Mall, Vancouver, British Columbia V6S 2L2, Canada)
A.I. Mears,
(Natural Hazards Consultants, 222 East Gothic Avenue, Gunnison, CO 81230, U.S.A.) and
P. Schaerer
(Institute for Research in Construction, National Research Council of Canada, 3650 Wesbrook Mall, Vancouver, British Columbia V6S 2L2, Canada)
ABSTRACT
Avalanche run-out distances have a prominent statistical character which is not usually featured in calculations derived from avalanche dynamics models. In order to predict run-out distances in a rational manner, the statistical element should be included. Here, we present and analyze data on extreme run-out from four mountain ranges. When the data are fitted to extreme-value distributions, we are able to show how (and why) extreme-value parameters vary with terrain properties of the different ranges.
INTRODUCTION
When decisions must be made about definition of safe areas and la cement of structures in snow-avalanche terrain. estimation of avalanche-stopping positions is the primary
consideration. Speed measurements show that large
avalanches slow down very rapidly, and, therefore, use of defence structures will only be possible near the end of the avalanche path. Given all the uncertainties about avalanche
velocities, decelerations, and impact pressures, the best
policy is to avoid threatened areas.
In spite of the need for high precision in defining safe areas, data show that run-out distances have a statistical character. When reliable long-term data are unavailable or discontinuous, we feel that at present statistical prediction (based upon terrain features) represents the only rational
I quantitative method for determining run-out distances. The
alternative (traditional) approach is based upon attempts to specify friction coefficients in an avalanche-dynamics model to calculate run-out. Uncertainties about flowing snow and its interaction with the terrain make this method highly speculative.
The pioneering efforts in statistical run-out prediction (Bovis and Mears, 1976; Lied and Bakkehoi, 1980; Bakkehoi and others, 1983) were based on regression analyses of topographic parameters. However, McClung and Lied (1987) analyzed data from western Norway and concluded that the data obey a Gumbel (extreme value) distribution. We believe this approach is superior and we have employed it here.
In this paper, we present and analyze extreme run-out distance data from three more mountain ranges: Purcell and Rocky Mountains of Canada, Sierra Nevada of California, and the Colorado Rocky Mountains. These new data are
compared with data from western Norway. When all the data are fitted to extreme-value distributions, we are able to show how (and why) the extreme-value parameters vary with the terrain properties of a given range. The variations in predictions also yield the important result that reliable predictions in a given mountain range must be based on a data set for that range.
DESCRIPTION OF DATA
The four data sets analyzed in this paper consist of "100 year" avalanches. The extreme position reached by avalanche debris was deduced by vegetation damage or the historical record. Although we have attempted to select a 100 year return period, the true return period probably ranges from 50 to 300 years in the data, thus introducing an unavoidable random error into the analysis. This error should diminish in importance as the sample size (number of avalanche paths) increases for a given mountain range.
The data for each mountain range consist of three angles ( a , R , 6 ) and rhree lengths (H, Ax, X a ) (Fig. I). The
angle a is defined by sighting from the extreme point
reached by avalanches in the past (extreme run-out position) to the starting point:
B
is obtained by sightingf r y n
theposition where the slope angle first declines to 10 from
the starting point: 6 is the angle defined by sighting
between the positions marked for a and
8.
W e have chosen the position defined by
B
(theB
point) as a reference point from which to calculate run-out. The run-out distance (Ax) is the horizontal reach from the
B point to the extreme run-out position. The length (XB) is the horizontal distance between the starting point and the B
point, and H is the total vertical displacement from the starting point to the extreme run-out position.
We have also defined
a
dimensionless run-out ratio(Fig. 1)
Ax tan
B
- tan a- =
Xg tan a
-
tan6 (1)A total of 397 avalanche paths from the four ranges were included in the analysis: (1) western Norway (127);
(2) Rocky Mountains and Purcell Mountains, Canada (125);
McClung and olhers: Extreme avalanche run-out
START POSITION
RUNOUT
Fig. 1. Geometry and definition of angles and distances. California (47). Two of these ranges (western Norway and Sierra Nevada) are in maritime climate areas, and the other two are considered continental.
The data-collection methods employed were slightly different for the different ranges, and for completeness we have included the procedures for each below:
( I ) Western Norway (McClung and Lied, 1987). The angles ((3,S) were determined by field measurements or high-quality maps, and a was measured in the field using a clinometer. Extreme run-out positions were determined from long-term historical records. Values for
H
were calculated by fitting acurve,
y = ax2+
bx+
c, to the terrain profile. The value of y ' a t y = 0 was substracted from the height of the start position to give H. From Equation (I), approximate valuesof Ax were calculated using values of H and simple trigonometry.
(2) Rocky and Purcell Mountains, Canada. The angles (a,
B,6) were measured in the field using a clinometer. Values for Ax were measured in the field using a series of distance and angle measurements. The lengths H were estimated from maps by assuming a start position and an extreme run-out position (observed in the field). Vegetative damage (mature timber, approximately 100 years old or older) was used to determine the extreme run-out position.
(3) Rocky Mountains, Colorado, and Sierra Nevada, California. The extreme run-out positions were observed in the field as in Canada. The angles (a$,&) were measured in the field on the shorter paths and determined from maps on the longer ones. The values for H and XB were scaled from maps, and Ax was determined from maps or measured on the ground.
We believe that the values for the angles are within *0.5' both for estimates from maps and for those measured in the field. Values of Ax are within 30 m when determined from maps, and within 2 0 m from field measurements. Assuming the start positions were correctly identified, H is within about 3 0 m when determined from maps. In the present analysis, we have taken only paths for which H > 3 4 0 m in an attempt to minimize the effects of avalanche-deposit length scale on the run-out ratio. We regard the center of mass-stop position as more fundamental than the position of extreme reach but we have no information about the former for our data sets. The extreme run-out position is the quantity of most interest in engineering aspects of zoning.
CHARACTERISTICS O F DATA: DESCRIPTIVE STATIS- TICS
The mean, standard deviation, and range for all variables used in the analyses are listed in Table I.
Differences in the terrain of the mountain ranges are shown b_y the values of
G
(the bar denotes a mean vatua).a,
and 6. The s t e e p p set of prtfjles is that from western Norway( E
= 29.4, 13
= 32.6,
6-
6.4'b, while t t e gentlest are from Sierra Nevada = 20.7,
8-
26.1,
-
6 = 4.7'). The longest run-out using either Ax or Ax/XB
is
from the gentle terrain of Sierra Nevada and Colorado Rockies. From Table I, the steeper paths generally produce lower Ax and Ax/XB, but this is not always the case. In general, however, the difference between
B
and ;ji ranks the same as either Ax and Ax/XB. The differoence between and ;ji is from Table I: 2.0' (Canada); 3.2 (Norway); 4.8 (Colorado); 5.4' (Sierra Nevada), and it can be seen that both the mean values of Ax and Ax/Xg rank in that same order.By centering and scaling the data, we get the following
TABLE I. DESCRIPTIVE STATISTICS FOR RUN-OUT PARAMETERS FOR FOUR MOUNTAIN RANGES
Mountain range Variable Mean value Standard Range of Number of deviation values avalanche paths
Canadian Rockies a 27.8 3.5 20.5 40.0 127 and Purcells B 29.8 3.1 23.0 42.0 126 6 5.5 5.3 - 21.5 20.6 125 H ( m ) 869.0 268.0 350.0 1960.0 124 Ax (m) 168.0 131.0 -190.0 524.0 124 AxIXB 0.114 0.100 -0.185 0.404 125 Western Norway Colorado Rockies a 22.6 3.1 15.5 30.7 98 B 27.4 3.6 18.8 37.7 98 6 5.3 3.3 -2.9 10.0 98 H ( m ) 641.0 165.0 366.0 1134.0 98 Ax(m) 366.0 195.0 107.0 1200.0 98 Ax/Xg 0.345 0.235 0.07 1.57 98 Sierra Nevada a 20.7 3.9 14.0 35.9 47 B 26.1 4.0 18.0 40.7 47 6 4.7 2.8 0.0 9.0 47 H (m) 590.0 225.0 350.0 1145.0 47 Ax (m) 450.0 253.0 120.0 1433.0 47 Ax/Xg 0.425 0.223 0.15 1.12 47
McClung arzd others: Extreme avalanche run-out
regression equations for the different ranges (" denotes predicted values):
&
= 0.938 Canada (r2 = 0.75, N = 126),&
= 0.900 western Norway (r2 = 0.87, N = I27),i
= 0.82B Colorado (r2 = 0.60, N = 98),(2)
&
= 0.726 Sierra Nevada (r2 = 0.75, N = 47)where r is the Pearson (ordinary) correlation coefficient, and N is the number ~ f ~ a v a l a n c h e paths. When a more general regression equation, a = COB
+
C,, is used, the constant C, is not significant except for the data set from Colorado. Therefore, for the other three data sets, Equations (2) represent the best linear regression equations. For example, with the Canadian data, the t statistic forB
is 19.1, while forC,
it is -0.52, and calculations with the more general equation show that C, is not significant.From Equation (I), 6 (or
5 )
will also affect the run-out ratio, but it has a smaller effect than the difference betweenB
and a illustrated by Equations (2). From Equation (1) and the values in Table I, it can be stated that a large difference between B and a, as well as a low value of a, produces the longest run-out by our definition.The values in Table I also show that the mean value of run-out (either Ax or Ax/XR), decreases as the mean value of H increases for some of the data. Since Ax and Ax/Xp are not Gaussian variables, rank-correlation
coefficients are preferable for determining their relation to other variables. For the individual mountain ranges, the rank correlation coefficients, r,, for Ax/XB correlated with H are: 0.051 (Canada); -0.05 (Norway); -0.41 (Colorado); -0.30 (Sierra Nevada). These results show that, within the data sets, Ax/XR does not have a significant correlation with H for the data from Canada and Norway, but there is a small negative correlation with H for the data from the U.S.A. We do not have a complete explanation of these results but we note that the terrain is steeper and the vertical relief is higher on average for the data sets from Canada and Norway.
All of the data sets have a non-zero but relatively weak rank correlation for Ax/XB with a : -0.58 (Canada); -0.39 (Norway); -0.33 (Colorado); -0.51 (Sierra Nevada), but nearly insignificant correlation with 13: -0.06 (Canada); -0.07 (Norway); 0.23 (Colorado); 0.04 (Sierra Nevada). If I3 is taken as an index of path steepness, we conclude that the run-out ratio is almost statistically independent of path steepness.
QUANTITATIVE RUN-OUT PREDICTION
Previously (McClung and Lied, 1987), it was shown that the dimensionless run-out ratio may be fitted to a Gumbel (extreme value) distribution for the data from western Norway. We shall now derive similar predictions for the other data sets. The chosen procedure is to derive approximate estimates of the two parameters for the extreme value distribution: the scale parameter b and the location parameter u by fitting a linear regression equation through plotting positions defined as a function of the non- excedance probability p for the extreme-value distribution. Let x Ax/Xa, then if /(x) is the probability density function, the non-excedance probability is defined as p =
Pr(x d xp) where
X~
p(xp) = I / ( r ) d r = exp - exp -
[F]
.
(3)4
Given a value xp, 100 x pO/o values of x in the distri-
bution have values less than xp. With the size of our data sets (approximately 100 points), values of p of interest range from about 0.5 to 0.99, corresponding to the median and 1 : 100 run-out ratio, respectively. If run-out distances are found to be much greater than the prediction for
p = 0.99, we conclude that there is a strong probability that such data belong to a different population of values. There are two related reasons why values of p less than 0.5 are not of major interest: (1) in land-use planning, interest is mainly on the extreme values (long-running avalanches), and (2) for data from Norway and Canada the fit to the extreme-value distribution worsens for p < 0.5, and therefore the accuracy of prediction decreases for the long-running avalanches if values less than 0.5 are included. This is not true for the data from Colorado and Sierra
.
Nevada, but for a consistent comparison of data from all four ranges we have censored all the data in a similar way.We have defined the non-excedance probability in terms of N values of the run-out ratio, ranked in decreasing value xN > x ~> -xl: ~
In Equation (4). i is the rank of the observation xi. Thus.
for the largest run-out ratio x pN
-
(N-
0 . 4 ) / N and forN :
the smallest pi = 0.6/N. E q u a t ~ o n (4) can be shown
to
be a good choice for censored extreme-value distributions (paper in preparation by D.M. McClung and A . I . Mears).We have censored each data set to include values of
probability between
7
and 1, where7
= 0.57721...
is Euler's constant. Thus, about 42% of the highest values for run-out were used in each data set. For the extreme-value distribution, the equation of the model for the regression line through the plotting positions defined by Equation (4) is:where E is an error term.
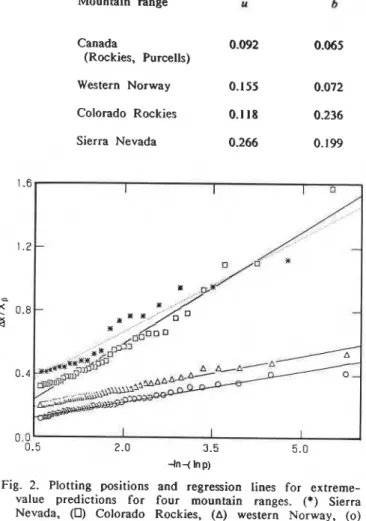
The least-squares procedure above gives values of b and u for each mountain range (the values are listed in Table 11). Figure 2 shows the run-out data and regression lines. From Figure 2, the general conclusions from our previous analysis of mean values of run-out are retained. Given a value of p, run-out distances generally decrease in the following order: Sierra Nevada, Colorado Rockies, western Norway, Canadian Rockies, and Purcells. The wide variation in extreme-value parameters and run-out clearly shows that it would be unwise to use an equation such as Equation (5) developed from avalanche paths in one mountain range to predict run-out distances in another.
EXTREME-VALUE PARAMETERS AND GEOMETRICAL INTERPRETATION O F RUN-OUT
For either a full extreme-value distribution or a limited distribution, the scale and location parameters depend only on the mean
2
and standard deviation ox of the extreme values. For a distribution limited at p = y, approximate estimates of the scale and location parameters are:and u =
X -
1 . 6 1 0 ~ . (7)An approximate value for
2
= (Ax/XR) may be calculated using Equation (1) with the mean values of a,B,
and 6 .For exayple, with $ata
fro^
Canaga, the mean values are:= 25.8 , i3 = 29.4 , and 6 = 4.3 , for the extreme values in Figure 2 (N = 53). Calculation using Equation (1) gives
2
= 0.20, which is the same as the mean of the extreme values. Similar conclusions follow from the other data sets.From Equations (6) and (7), the scale parameter depends only on the standard deviation of the extreme values, and therefore it characterizes terrain variations within a mountain range. The location parameter depends on both the mean value of the run-out ratio (related to terrain steepness) and the standard deviation (terrain variations) in a mountain range.
McClucag actd others: Extreme avalanche run-out
TABLE 11. EXTREME VALUE SCALE AND LOCATION PARAMETERS (b,u) FOR FOUR MOUNTAIN RANGES. ALSO GIVEN ARE CORRELATION COEFFICIENT, r, AND STANDARD
ERRORS, S.E., FOR T H E REGRESSION LINES THROUGH T H E PLOTTING POSITIONS
Mountain range Y b r2 S.E. Number of
avalanche paths Canada 0.092 0.065 0.97 0.012 53 (Rockies, Purcells) Western Norway 0.155 0.072 0.98 0.010 54 Colorado Rockies 0.118 0.236 0.97 0.046 42 Sierra Nevada 0.266 0.199 0.95 0.052 20
Fig. 2. Plotting positions and regression lines for extreme-
value predictions for four mountain ranges. (*) Sierra
Nevada,
(0)
Colorado Rockies, (A) western Norway, (0)Canadian Rockies and Purcells.
run-out (using our definitions) is produced by the greatest
differences on average between
B
and a (Equation (2))combined with the lowest value of a. For our data, this
combination is fulfilled by the gentlest terrain (Sierra Nevada).
SNOW CLIMATE
Since our definition of extreme run-out is based on a
time-scale of approximately 100 years, we expect that
climate regime should not have a strong influence.
Experience shows that large dry avalanches have the longest run-out in the majority of cases. Normally, a greater percentage of dry avalanches is expected in a continental climate, with fewer avalanches overall due to smaller amounts of precipitation. We believe that, for time-scales of 100 years, large dry avalanches will occur in either climatic
regime to dominate the run-out statistics. By our
definitions, the two ranges with the longest run-out
distances encompass a maritime climate (Sierra Nevada) and a continental one (Colorado). Similarly, in the case of the shortest run-out, one of the areas is maritime (Norway) and one is continental (Canada). As discussed previously, the tendency for long run-out can be explained by analysis of avalanche-path profiles, but we cannot explain the observed differences through snow-climate classification.
SCALED HORIZONTAL REACH
Fig. 3. Ge_ometrical interpretation of run-out ratio using
a,
a,
and 6. (-) western Norway, (----) Canadian Rockiesand Purcells.
run-out for data from Norway and Canada. We have used the same vertical drop distances (scaled to unity) with
values of
a,
8,
and from Table I. The value of Ax isabout 1/3 higher for the Norwegian profile in Figure 3, and the values of Ax (Table I) differ by this same amount
(33%). For this particular example, the mean values of
z,
a,
and 6 are all higher for the Norwegian data than thosefrom Canada. Thus, steeper terrain angles produce higher run-out for the Norwegian data set. This result is, however, the exception rather than the rule. Similar constructions with data from the U.S.A. have shown that the highest mean
DISCUSSION
Based on our definitions and analysis, the following conclusions are evident:
There is a significant difference in predicted run-out as terrain in mountain ranges varies. It would not be advisable to predict run-out in one range based on data from another using the methods we have discussed.
If our definition of run-out is accepted, there is no discernible effect based on snow-climate classification. This is expected because of the time-scale our data represent (4100 years).
The highest run-out ratio occurs for mountains with the
greatest difference between
B
and a, and low values for a.We prefer extreme-value prediction of run-out ratio as a measure of run-out rather than the traditional approach
based on a regression analysis of a (response variable) as a
function of B and other terrain variables. In regression analyses with the four data sets, we found that addition of
6 improves predictions of a in a multiple regression analysis
with l3 (see McClung and Lied, 1987). However, if B is
chosen as a reference point, 6 does not qualify as a
predictor variable (in general, it would be unknown). Also,
no other variables (except 6) have been found in
combination with B to improve predictions of a. The
run-out ratio Ax/XR includes the effects of the terrain in the run-out zone (6) and therefore we feel it is superior. There is a "scale" effect in some of the data if run-out is defined using the run-out ratio. We have found this in the data from Colorado and Sierra Nevada, but not in data
McClut~g and others: Extreme avalat~che run-out
from Canada and Norway. Correlation analysis shows that higher vertical drop H tends to produce shorter run-out in Colorado and the Sierra Nevada. With our definition, the mean value of run-out also decreases as the mean value of H increases for individual data sets (Table I). It is possible that the mean value of vertical drop for paths in the two data sets from the U.S.A. is small enough that the scale effect is present. Our attempt to circumvent this problem
by choosing paths with H > 340 m may not have been
entirely successful. This question will not be resolved until data on actual avalanche deposits are analyzed to study the difference between statistics for the center of mass-stop position and the position of the extreme tip of the debris.
The run-out ratio is statistically independent of path
steepness ( 4 or tan 4) for data from Canada, Norway, and the Sierra Nevada, but there is a small positive correlation (rs = 0.23) for the data from Colorado. The correlations of
Ax with respect to I3 (or tan 4) are somewhat larger and negative. These results partially justify our preference for the dimensionless run-out ratio, rather than Ax, as a measure of run-out. Since we are attempting to relate
run-out to the non-excedance probability alone, it is
preferable that run-out should have minimum correlation with other variables which might qualify as predictors.
We believe that accurate prediction of run-out distances
is the most important element in the quantitative
engineering aspects of land-use planning in avalanche
terrain. We also feel that, when accurate long-term
continuous records are not available, prediction based on
terrain variables is the only rational method for
mathematical prediction so far proposed. Philosophically, our preference would be to specify friction parameters as input to a physically based dynamics model and calculate the speed profile along the incline and the stop position as one problem. This is the traditional approach to the problem (Voellmy, 1955; Perla and others, 1980). With the small
amount of information about flowing snow properties
available at present, we feel this ultimate goal is somewhat in the future.
In this paper, we have compared data from the four mountain ranges by treating and censoring the data in a consistent manner. None of the equations presented is suitable for actual zoning applications because they are not the optimal equations for the data sets presented.
ACKNOWLEDGEMENTS
This paper is the product of joint effort involving many years of data collection by (1) the Institute for Research in Construction, NRC Canada; (2) A.I. Mears, Natural Hazards Consultants; (3) the Norwegian Geotechnical Institute. We wish to thank P. Anhorn, B. Benum, and B. Sheffield for their assistance in collection of the Canadian data, and K. Lied for supplying the data from western Norway.
REFERENCES
Bakkehpli, S., U. Domaas, and K. Lied. 1983. Calculation of snow avalanche runout distance. Ann. Glaciol., 4, 24-29. Bovis, M.J. and A.I. Mears. 1976. Statistical prediction of
snow avalanche runout from terrain variables in Colorado. Arct. Alp. Res., 8(1), 115-120.
Lied, K. and S. Bakkehpli. 1980. Empirical calculations
of snow-avalanche runout distance based on topographic parameters. J. Glaciol., 26(94), 165- 177.
McClung, D.M. and K. Lied. 1987. Statistical and
geometrical definition of snow avalanche runout. Cold Reg. Sci. Technol., 13(2), 107-119.
Perla, R., T.T. Cheng, and D.M. McClung. 1980. A
two-parameter model of snow-avalanche motion. J.
Glaciol., 26(94), 197-207.
Voellmy, A. 1955. ~ b e r die Zerstorungskraft von Lawinen.
Schweiz. Bauztg, 73(12), 159-162; (1 5), 21 2-21 7; (17),