Changes in a Gel's Electrical Properties Due to
Exposure to Air
by
Amy Nicole Englehart
Submitted to the Department of Electrical Engineering and Computer
Science
in partial fulfillment of the requirements for the degree of
Master of Science in Electrical Engineering and Computer Science
at the
MASSACHUSETTS INSTITUTE OF TECHNOLOGY
June 2002
@
Massachusetts Institute of Technology 2002. All rights reserved.
A uthor . .. . .. V -. /.). -.-(-. e--. .-- . --
-Departm' /it of E 1etrical Engineering and Computer Science
February 2, 2002
Cerifid
y... .4..-... .... ... Dennis M. FreemanAssociate Professor
Thesis Supervisor
Accepted by ...
...
Arthur C. Smith
FTS INSTITUTECaro
INOTLTTY
Chairman, Department Committee on Graduate Students
6 2002
BARKER
MASSACHUSE OF TECH
Changes in a Gel's Electrical Properties Due to Exposure to
Air
by
Amy Nicole Englehart
Submitted to the Department of Electrical Engineering and Computer Science on February 2, 2002, in partial fulfillment of the
requirements for the degree of
Master of Science in Electrical Engineering and Computer Science
Abstract
A two-bath technique has recently been developed to measure the potential of the tectorial membrane, a gelatinous structure in the inner ear. The two-bath technique gives more stable measurements than previous techniques. However, results for the two-bath technique suggest physiologically unrealistic large concentrations of fixed charge in the tectorial membrane. One hypothesis to account for the unrealistically large concentration of fixed charge is that because the two-bath technique causes part of the TM to be exposed to air, it shrinks. Because of its smaller volume, its concentration of fixed charge would increase. For this thesis, artificial gels were fabricated and used to test this air-exposure hypothesis. The gel's potential was measured with the two-bath technique and also with a variation of the two-bath technique in which the gel was not exposed to air. In the two-bath experiments where the gel was exposed to air, it shrunk and fixed charge concentration estimates of the gel were larger than the fixed charge concentration estimates of the gel from the two-bath experiments when the gel was not exposed to air.
Thesis Supervisor: Dennis M. Freeman Title: Associate Professor
Acknowledgments
Working with Denny has been a joy. I have learned an enormous amount about objective, meticulous and creative scientific research. His passion for understanding our world and openly sharing what he understands will always stay with me.
I'm so grateful to have been in a lab with so many kind people. A.J. has helped me immeasurably. Not only has his amazing ingenuity been a great relief in my times of need but his never-failing humor has lightened my mood numerous times. Michael was wonderful at helping me think more clearly and honestly about research problems. Kinu!!!!!!! :) She never failed to offer compassion and encouragement, two invaluable commodities at MIT. :) I have been so lucky to have Salil as an officemate; we have shared so much laughter and commiseration. This guy is going to go far, mark my words. And everyone else, Andy, Rooz, Stan, Jay, Betty and Abe, it's been
a pleasure to work with everyone.
In the greater MIT community, I am grateful to Dr. Leeb, truly a prince, for teaching me how to fabricate the gels. Kurt Broderick, the wizard behind MTL, never failed to help me out with any problems I had. I am so grateful to Marilyn Pierce for always being so kind and confident in me.
I have to acknowledge a few friends that were simply essential to me. I would never have been at MIT if it weren't for John Wu. I am very grateful to him for encouraging me that I could make it at MIT and I better apply! And although he is far away in start-up land, dear Sri is virtually always reachable via cell for a mental and emotional caffeine boost. Dear Melissa is a true friend and even did her part with this thesis, helping me with grammar and organization. And Lin, Irina, Corina, Aarti and Kim, I am so glad for having these awesome girlfriends! Finally, there is no way I can acknowledge all the people who knowingly and unknowingly strengthened me on this journey. Thank you.
Last, I owe everything to my wonderful family. Thank you so much Mom and Dad for always loving me through the good and the bad times. And thank you to Alister, Olivia, Margaret and Stuart, my utterly adorable nephews and nieces for always being
so excited to see me. And thank you Matt, Michelle, Becky and Elizabeth for the love we have shared thus far and will share.
Contents
1 Background and Motivation 2 Theory and methods
2.1 Estimation of the fixed charge from a gel-bath voltage . . . . 2.1.1 Electroneutrality in the gel . . . . 2.1.2 Electrodiffusive equilibrium . . . .. 2.2 Estimation of the fixed charge when using the two-bath technique . . 2.3 Effect of liquid junction potentials . . . . 2.4 Shorting method to reduce uncontrolled voltage variations in two-bath
technique . . . . . .. . . . . 2.5 Measurement method for the enclosed and air-exposed two-bath
tech-n iqu e . . . .. . . . . .. . . 13 17 17 18 19 20 21 23 23 2.5.1 Apparatus . . . .. . . . . 23 2.5.2 Two-bath Protocol . . . . 26 2.5.3 Three-bath Protocol . . . . 27
2.6 Estimation of geometric changes in the gel . . . . 27
2.6.1 Measurement methods for image acquisition . . . . 27
2.6.2 Estimation of volume changes . . . . 28
2.7 Comparison between air-exposed gel's Cf and normalized volume . . 29
2.8 Fabrication of the gel . . . . 30
2.8.1 Chem istry . . . . 30
2.8.2 Fabrication steps . . . . 31
2.9.1 Chemistry . . . .
2.9.2 Fabrication Steps . . . . 2.10 Fabrication of the Ag/AgCl salt gel Electrode . . . . 3 Measurements of enclosed and air-exposed gels
3.1 Enclosed measurements . . . . 3.1.1 Shorted two-bath voltages . . . .
3.1.2 Potential measurements before perfusion . . . .
3.1.3 Potential measurements after perfusion . . . . . 3.2 Images and potentials measurements of air-exposed gel 3.3 Enclosed potentials vs air-exposed potentials . . . .
4 Analysis of measurements
4.1 Estimating Cf for enclosed measurements . . . . 4.2 Estimating Cf for air-exposed measurements . . . . 4.3 Volume changes compared to Cf changes . . . . 5 Discussion
5.1 Enclosed potential measurements . . . . 5.1.1 Stability and variations in enclosed measurements . . . . 5.1.2 Perfusion in the enclosed measurements . . . . 5.1.3 Transients in the enclosed measurements . . . . 5.1.4 DET model and enclosed results . . . . 5.2 Air-exposed potential measurements . . . . 5.2.1 Stability and variation in potential measurements of air-exposed
gel ... ...
5.2.2 Stability and variation in images of air-exposed gel . . . . 5.2.3 Changes in gel volume compared to changes in estimated Cf . 5.3 Conclusion of work . . . . 33 33 34 37 . . . . 37 . . . . 37 . . . . 39 . . . . 39 . . . . 44 . . . . 47 49 49 51 51 55 55 55 56 56 56 57 57 58 58 59
List of Figures
1 -1
. . . . 1 5 1 -2 . . . .. . . . 1 5 2 -1 . . . . 2 2 2 -2 . . . . 2 4 2 -3 . . . . 2 4 2 -4 . . . .. . . . 2 5 2 -5 . . . . 2 6 2 -6 . . . . 2 9 3 -1 . . . . 3 8 3 -2 . . . .. . . . 3 8 3 -3 . . . . 4 0 3 -4 . . . . 4 0 3 -5 . . . . 4 1 3 -6 . . . . 4 1 3 -7 . . . .. . . . 4 2 3 -8 . . . . 4 3 3 -9 . . . . 4 3 3 -1 0 . . . . 4 4 3 -1 1 . . . . 4 5 3 -1 2 . . . . 4 6 3 -1 3 . . . . 4 74-1 . 50 4-2 . 50 4-350 4-451 4-552 4-6... 52 4-754
List of Tables
2.1 Compositions of solutions. Solutions are adjusted with KOH and HCl for 9.5<pH<10.5. Chemicals obtained from Aldrich Chemicals,
Mil-w aukee, W I. . . . . 18 2.2 Liquid junction potentials between test bath solutions and reference
Chapter 1
Background and Motivation
Gels have been described as a "form of matter intermediate between a solid and liquid, (Tanaka, 1981)." Gels are mostly fluid with a matrix of polymer strands immersed in the fluid that gives the gel structure and form. The consistency of gels ranges from viscous fluids to somewhat rigid solids but typically they are soft and resilient, similar to the dessert Jello, which is perhaps the most familiar gel. Gel's have the notable characteristic of changing drastically in volume in response to infinitesimal changes in the surrounding environment.
Gels are of interest in a variety of fields. Gels are used as intermediates in manu-facturing polymers such as rubber, plastics, glues and membranes. Many new applica-tions are currently being investigated. Gels may also be useful for soft actuators and valves (Mitwalli, 1998). Gels are being modeled as artificial muscles (Woojin, 1996).
Many natural gels can be found in the human body as well. The vitreous humor that fills the interior of the eye, the material of the cornea, cartilage and the synovial fluid are all gels. Biological gels control the diffusion of oxygen, nutrients and other charged and uncharged molecules.
The tectorial membrane (TM) is a natural gel in the inner ear, overlying the sensory hair cells. The hair cells are the sensory receptors of the hearing process. The TM is in a strategic position to directly affect the sensitivity and frequency selectivity of hair cells.
of the genes TECTA and COL11A2 in mice are associated with an abnormal TM (Legan et al., 2000; McGuirt et al., 1999). Mutations of these same genes in humans are associated with hearing impairments (McGuirt et al., 1999; Verhoeven et al., 1998).
Although genetic research indicates the TM is crucial for hearing, there is little knowledge of how or why it is important. Many different models of the TM have been developed that are contradictory to each other. These models propose the TM is a rigid linkage (Davis, 1958), or a resonant mass (Zwislocki, 1979; Allen, 1980), or a completely isolated mass atop the hair bundles (Mammano and Nobili, 1993). These models are based on sparse experimental data (von B k sy, 1947; von Bekesy, 1953; Zwislocki and Cefaratti, 1989; Abnet and Freeman, 2000). Since the TM is microscopic and 97% water, it has been difficult to perform experiments to characterize the TM.
By developing new experimental methods, our lab is measuring the TM's mechan-ical and electrmechan-ical properties to develop a physmechan-ically realistic model that relates the TM's function to the other hearing processes in the inner ear. Experiments to date fit well with a simple polyelectrolyte model for the gel (Freeman and Weiss, 1997). This model is characterized by two material constitutive relations - a stress-strain relation and a charge-concentration relation. These two relations are inherently interrelated.
The charge-concentration relation describes the interaction between fixed charges and mobile ions. The fixed charge concentration (Cf) is the quantity of ionizable non-mobile charge groups on the polymer network per unit volume of fluid in the gel. Mobile ions diffuse in and out of the gel. Because of the fixed charge, there is an electrical attraction for ions with the opposite charge and electrical repulsion for ions with the same charge. In addition, there are osmotic, mechanic and chemical forces acting on the mobile ions. Because of these forces, the concentration of each ion in a gel is different from that ion's concentration outside the gel, in the surrounding bath. This difference in ionic concentration causes a junction potential (EP) to develop between the gel and the surrounding bath as illustrated in figure 1-1.
(i. e e e , 0 e * - e e -oGel e e+ e) $ e e Bathe
Fixed ionizable groups El positive B negative O neutral Mobile solutes @cations eanions o uncharged
Figure 1-1: Polyelectrolyte gel and surrounding bath, adapted from (Freeman and Weiss, 1997). The gel's matrix has ionizable molecules (the squares) permanently attached to it. Mobile solutes (the circles) diffuse into the gel. Interactions between the mobile and fixed charged groups re-sult in a junction potential, EP, at the gel-bath boundary.
Fixed ionizable groups Elpositive E negative O neutral Mobile solutes ® cations ganions o uncharged
Figure 1-2: Two bath tech-nique for measuring electrical properties of a gel as adapted from (McAllister, 1998). The gel contacts two baths sepa-rated by a barrier. Three po-tentials develop: E1 at the gel interface with Bath 1, E2 at the gel interface with Bath 2 and ELJp through the gel. using a model to relate Cf to EP, the Cf can be estimated. A number of technical difficulties complicate measurement of the EP between the gel and the bath. Because the TM is microscopic and is 97% water, it is very fragile and tears easily. It is difficult to insert an electrode into the center of the TM and not pierce completely through it and/or introduce tiny tears into the membrane.
To surmount these difficulties a two-bath method was developed in our lab (McAllister, 1998). The TM was positioned as the electrical connection between two baths (fig-ure 1-2). The electrical potential between the baths is the difference between two gel-bath EPs plus a liquid junction potential. The gel-bath EPs are between the TM and bath 1 and between the TM and bath 2; the liquid junction potential is through the gel. Estimates of the Cf of the TM from this two-bath method using the Donnan Equilibrium Theory are roughly a factor of ten larger than any other Cf estimates (Freeman and Weiss, 1997).
a number of factors. The Cf is dependent on a number of experimental conditions: pH of the surrounding bath, pressure on the gel, molecular binding within the gel and hydration of the gel. Alternatively, the discrepancy may be an artifact of the two-bath method. With the two-bath method, the majority of the TM is exposed to air between the two fluids. This is significantly different from its natural fluid environment. It is conceivable that the fluid in the TM evaporates during the experiment causing dehydration and shrinking. The reduction in volume will result in a larger Cf.
In this thesis, I investigated this theory of shrinking due to air exposure with an artificial polyelectrolytic gel. The principle advantage of using the artificial gel was that it could be custom fabricated with a known upper limit to its Cf. Additionally, the artificial gel can be fabricated reliably and repeatably.
The artificial gel's Cf was estimated using the two-bath method and the Donnan Equilibrium Theory. The size of the gel was measured throughout the experiment to correlate geometric changes with changes in Cf.
As a control experiment, the gel's Cf was estimated using the same two-bath method but with the gel insulated from the air by glass. This prevents the gel's Cf from changing due to exposure to air. The Cf estimates from the air-exposed two-bath experiment and the enclosed two-bath experiment were compared to the theoretical upper limit of the Cf.
Chapter 2
Theory and methods
This chapter describes the theory and methods used in this thesis. First, the Donnan Equilibrium Theory (DET) (Freeman and Weiss, 1997) used to estimate the artificial gel's Cf from its potential is described. Second, the two bath experimental technique is described. Because the artificial gel potential is small (less than 10 mV) and is measured in ionic solutions, special methods were used. These methods include using Ag/AgCl-salt gel electrodes and referencing the measured artificial gel potential to a potential measured with the two baths shorted by a salt gel bridge. Last, the fabrication steps of the artificial gel, the Ag/AgCl electrodes and the salt gel bridge are described.
2.1
Estimation of the fixed charge from a gel-bath
voltage
The two-bath experimental setup for this thesis replicated the experimental setup in which the TM's Cf was estimated. The TM's normal environment is endolymph, a solution that predominantly contains K+ and Cl- ions. In the previous TM exper-iment, the ionic solutions in the baths were artificial endolymph (AE), K21, K43, K87 and K696. The solutions used to test this artificial gel were artificial endolymph (AE), K21, K43, K348 and K696. See table 2.1 for solution recipes. AE was an
approximation to endolymph. K21, K43, K348 and K696 were also endolymph ap-proximations with varying KCL concentrations. Additionally, a NH4Cl buffer, was added to all solutions to maintain a high (> 9.5) pH.
In this thesis the artificial gel's fixed charge concentration was estimated using the DET. The DET describes the relationship between 1) the concentrations of diffusable ions inside a gel, 2) the concentration of diffusable ions outside a gel in a surrounding ionic bath, 3) the fixed charge within the gel and 4) the junction potential created by all of these ions. Since the bath solutions are endolymph approximations, the only significant ions are assumed to be K+ and Cl- ions. The DET assumes a gel is in equilibrium and the concentrations of ions are unchanging inside and outside the gel. The DET consists of a set of fundamental relations which are described next.
Substance AE K21 I K43 IK87 K348 _K696 K3000 KCl mmol 174 21 43 87 348 696 3000 NaCl mmol 2 2 2 2 2 2 2 CaCl mmot 0.02 0.02 0.02 0.02 0.02 0.02 0.02 NH4C1 mM 0o 5 5 5 5 5 5 5 Dextrose mdo 3 3 3 3 3 3 3
Table 2.1: Compositions of solutions. Solutions are adjusted with KOH and HCl for 9.5<pH<10.5. Chemicals obtained from Aldrich Chemicals, Milwaukee, WI.
2.1.1
Electroneutrality in the gel
Electroneutrality states that the electrical charges in the bulk of a solution sum to zero. This principle holds both inside and outside the gel,
C -- CS = 0, outside the gel, (2.1)
and
CK - Ci - Cf = 0, inside the gel. (2.2)
where Cf represents the fixed charge concentration of the gel, C' and CN1 represent the concentration of potassium and chlorine in the gel, respectively and C' and Co1
represent the concentration of potassium and chlorine in the bath, respectively. Cf is subtracted in equation 2.2 because although, Cf is positive, the fixed charge is known to be negative.
2.1.2
Electrodiffusive equilibrium
When measured in a single bath, electrodiffusive equilibrium exists across the gel-bath interface. The fixed charge in the artificial gel exerts an electro-motive force on the mobile ions in the bath solution, attracting ions of opposite charge and repelling ions of similar charge. This flux is opposed by a diffusive flux down the concentration gradients. This equilibrium condition relates the concentration of K+ ions and
C-ions inside and outside the gel. These ionic concentratC-ions have a specific ratio and cause a junction potential which is expressed as
kT CO kT CI
V = -In - -In (2.3)
q CC,
where k is Boltzmann's constant, T is the absolute temperature, and q is the charge of one proton. The relationship can be manipulated and generalized for the nth ionic species as,
Cn = Cn(e k)T) = Cdzn, (2.4)
where zn is the valence of the nth ionic species and dzn - e k. Since the only ions
being accounted for are K+ and Cl-, zn = ±1.
Equation 2.2 and equation 2.4 are combined to give the quadratic function
CO CyC = 0. (2.5)
Solving equation 2.5 yields,
d
C (C- C + C2 . (2.6)2C \ 2CO CO
be positive. The voltage at the gel-bath interface is now expressed as a function of Cf, C', and C'<, kT C EP = x ln( ( C )21 I Cf (2.7) q 2 Cbath 2Cbath where Cbath = CK' = C&.
Equation 2.7 shows that a gel's Cf could be estimated by measuring the gel-bath EP. However, in the case of the TM, it is very difficult to reliably measure this EP with microelectrodes. To overcome this problem, the two-bath technique was developed.
2.2
Estimation of the fixed charge when using the
two-bath technique
In the two-bath method, a gel is used as the electrical connection between two baths (figure 1-2). Two gel-bath EPs develop; one EP between the gel and bath 1 and an-other EP between the gel and bath 2. By assuming the DET, the measured potential, Vd, is assumed to be the difference between the two gel-bath EPs and is given by,
kT b2c$h -+l- 2Cbath,
Vdz= x ln( ). (2.8)
q
V2
cbath + 2Cbath2
Cbath1 was a reference bath and contained artificial endolymph (AE). Cbath2 was
the test bath. It was alternately K21, K43, K348 and K696. There are two methods for determining Cf. The first method estimates Cf directly from equation 2.8 by substituting the measured Vd, Cbath, and Cbath2. In the second method, the potential difference for each test bath concentration was measured. The value of Cf that minimized the difference between the measured potentials and equation 2.8 in a least squares sense was chosen.
2.3
Effect of liquid junction potentials
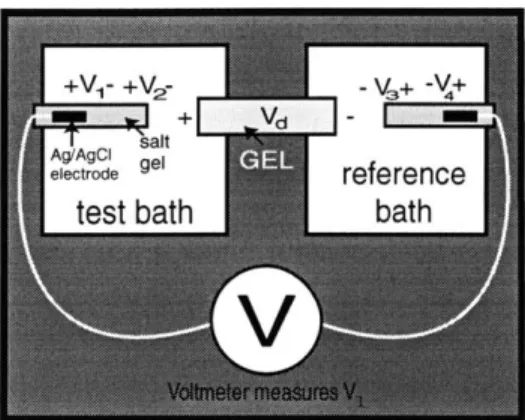
The voltage measured by the voltmeter is the sum of Vd and all other solid and liquid junction potentials. Solid and liquid junction potentials occur anywhere there is a junction of dissimilar materials. A better assumption of the measured voltage is not only Vd as given in equation 2.8. Instead, the measured potential, V, is expressed as,
V =V1+V 2 +Vd -V 3 -V 4, (2.9)
where V1 and V4 are the solid junction potentials between the Ag/AgCl electrodes
and surrounding salt gel. V2 is the liquid junction potential between the salt gel and
test bath. V3 is the liquid junction potential between the salt gel and reference bath
(AE). Vd is as defined in equation 2.8. Figure 2-1 illustrates the loop measured by the voltmeter.
V1 and V4 have been found empirically to be (Ives and Janz, 1961)
kT
V1 = V4 = VAg/Agcl - TIn CC, (2.10)
where Cc, is the concentration of Cl- ions in the salt gel. V^g/90c is the "standard electrode potential," and is a function of the electrode. It should theoretically subtract out when using two Ag/AgCl electrodes of identical composition. This equation shows that the potential created is theoretically non-polarizable and reversible. Non-polarizable means the potential is unaffected by the current flow. Reversible means that the v-i characteristic is ohmic with no hysteresis. Both Ag/AgCl electrodes are made with the same salt gel, K3000 (see table 2.1). Thus, the same concentration of chlorine is used in equation 2.10 for estimating V1 and V4 and the two potentials
theoretically cancel each other.
The potential for V2 is defined as (Weiss, 1996),
V2 =
(
- PC C testbathq pK + pci Csaltgel
Figure 2-1: Schematic diagram illustrating ad-ditional junction potentials occurring in mea-surement of gel voltage. The voltmeter is rep-resented by a "V." The large white squares
+ V - m represent the test bath and reference bath
AI reference dishes. The gray rectangle in the center
rep-test bath h resents the gel; it produces a voltage, the-oretically modeled as Vd from equation 2.8. The smaller black rectangles within larger gray
V
rectangles represent Ag/AgCl electrodes andthe surrounding salt gel, respectively. The white lines represent the connection between the voltmeter and the electrodes. The addi-tional junction potentials, V1, V2, V3 and V4 are indicated.
the potential for V3 is defined as,
V3 = kT (K - /l9) In Creferencebath (2.12)
q PK + /CI Csaltgel
V2 and V3 do not cancel each other since Ctestbath
$
Creferencebath. The values forV2 - V3 for the four solutions are shown in table 2.3. Thus, in the results, the
measured gel voltages are assumed to be,
V = Vd + V2 - V3, (2.13)
where Vd is defined in equation 2.8.
Solutions [V2 - V3 [my]
K21-AE 1.02
K43-AE 0.68
K348-AE -0.33
K696-AE -0.67
Table 2.2: Liquid junction potentials between test bath solutions and reference bath
2.4
Shorting method to reduce uncontrolled
volt-age variations in two-bath technique
A number of uncontrolled factors (such as temperature) can also affect the voltage measured in the two-bath method. We represent the effect of these factors as a voltage Vextra(t) that is added to V, (equation 2.13) as follows,
V1 2(t) = V + Vextra(t ). (2.14)
To estimate Vextra(t), the baths are shorted together with a salt gel shorting bridge
with the same KCl concentration (K3000) used in the salt gel electrodes. When the baths are shorted, all junction potentials defined in section 2.3 theoretically cancel each other thus the resulting voltage is, V(t) = Vextra(t). Ideally, V12(t) and V, (t)
would be measured at the same time so the extraneous voltages could be subtracted out perfectly. The following voltage difference was the experimental voltage compared with the theoretical voltage defined in equation 2.13.
Vg(t) = V12(t) - V(t + 6), (2.15)
where 6 was the time between measuring the gel and the short.
2.5
Measurement method for the enclosed and
air-exposed two-bath technique
2.5.1 Apparatus
The 4 major components of the experimental setup were the two-bath chamber, the perfusion system, the voltage acquisition system, and the gel. The two-bath chamber (figure 2-2) consists of two plastic tissue culture dishes (Becton Dickinson, Franklin Lake, NJ) each with a diameter of 35 mm and a depth of 10 mm. They are placed a distance of 1.15 mm from each other. The gel bridged this gap. One dish contained
Figure 2-2: The chamber consisted of two dishes placed a distance of 1.15 mm from each other. The left dish contained AE, the reference fluid. The right dish con-tained one of the test solutions, K21, K43, K348 or K696. The gel straddled the two dishes such that each end of the gel dan-gled in one of the two baths.
peristaltic pump
Figure 2-3: The chamber with
pump the perfusion system connected
to the test bath. A peristaltic pump, shown on the left, was used for the outflow. The inflow was controlled by a motorized sy-ringe pump (right).
the reference solution, AE. The other dish contained one of the test solutions: K21, K43, K348 or K696.
The test bath was perfused to eliminate an ionic stagnation layer at the gel-bath interface. Syringes mounted on a pumping system (Razel, Stanford, CT) were used for inflow and peristaltic pumps (Rainin Instrument Co., Woburn, MA) were used for outflow. A large chunk of polydimethylsiloxane, PDMS, (Sylguard 184, Dow Corning, Midland, MI) was fixed in the test bath to force the solution to flow very close by the gel and not through the center of the dish. The reference bath was not perfused. The two-bath chamber with the perfusion system is shown in figure 2-3.
The voltage acquistion system consisted of a Tektronix TX3 voltmeter (Beaverton, OR), amplifier (DAM 60, World Precision Instruments, Sarasota, FL) and Ag/AgCl electrodes in a highly conductive (K3000) salt gel solution. A computer acquired and saved the voltages from the amplifier. The amplifier was needed because the
Figure 2-4: The voltage acquisition system is shown with the perfused two-bath cham-ber. Ag/AgCl electrodes in salt gel con-tacted each bath. The voltage across the two baths was amplified, then read by the voltmeter and sent via the serial port to an IBM compatible computer.
elcrodes
gel-bath potential ranged from 1 mV to 8.5 mV and was close to the noise floor of the voltmeter. The two-bath system with the perfusion system and the voltage acquisition system is shown in figure 2-4.
The gel was a solid cylinder with a diameter of about 340 pm. The gel was balanced on the edge of the two dishes contacting AE on one side and the test solution on the other side. Thus, the gel provided the only electrical connection from the reference bath to the test bath.
There were two sets of experiments performed, one in which the gel was enclosed and one in which the gel was exposed to air. For the enclosed measurements, none of the gel was exposed to air. A middle section of the gel was entirely enclosed by a glass cylinder. The gel protruded on each side from this middle glass section. The glass cylinder rested so one end of it was on the edge of the test bath and the other glass end rested on the edge of the reference bath. The gel that protruded from the glass dangled in one of the baths. The enclosed gel with the two-bath chamber is shown in figure 2-5.
For the air-exposed measurements, the gel straddled the test bath and the refer-ence bath similar to the enclosed measurements. Although the majority of the gel was in solution the middle section was not enclosed within a glass cylinder. This left approximately 1.15 mm exposed to air.
- Figure 2-5: The glass-enclosed gel
recording perfusion straddled the test bath and the
ref-electrodes tubes erence bath. A Ag/AgCl/salt gel
electrode was in each bath to mea-sure the potential. Inflow and out-flow perfusion tubes were in the test bath. A large chunk of PDMS was inserted into the test bath to force the fluid to flow past the gel. test gel
2.5.2
Two-bath Protocol
The first step was to prepare the baths. The reference bath dish was filled with AE until there was a convex meniscus of AE above the dish edges. The test bath was filled the same way with one of the 4 test solutions.
The next step was to get steady inflow and outflow of the test solution with the perfusion system. The inflow and outflow tubes are threaded through epoxied rubber rings on the dishes so that the tubes stay fixed during an experiment. Typical perfusion rates were 27 mL/hour for both inflow and outflow.
Following this, the voltage acquisition system was added to the setup. The volt-meter was hooked up to the serial port of the computer. The voltvolt-meter and the amplifier were also connected together. The amplifier's gain was set to ten and the DC offset was adjusted to zero. The silver wires extending from the electrodes were each wrapped around the amplifier leads. The glass-enclosed electrodes were inserted into epoxied rubber rings on the dishes to keep them fixed during the experiment. The voltage acquisiton computer program was started.
Last the gel was placed between the two dishes. In the case of the enclosed gel, the gel was placed carefully on the dish edges such that the gel extending out of the glass was not exposed to air. Following placement of the gel, the gel's potential would be monitored. For acquistion of the shorted potential, the shorting bridge would be
placed in parallel with the gel.
2.5.3
Three-bath Protocol
A three-bath method was initially used to measure artificial gels with a 1.0 mm diameter. Because this diameter is equal to that of the shorting bridge, when the shorting bridge was placed in parallel with the gel, the voltmeter did not record a short. Empirically determined, for the shorting bridge to short out the gel when placed in parallel, the shorting bridge needed to have a cross-sectional area at least
12.5 times larger than the gel's cross-sectional area.
The protocol for the three-bath method is the same as the protocol for the two-bath method except three two-baths are used. In the three-two-bath method, the test solution filled two of the baths. The third bath had the reference solution. The electrodes were in test bath 1 and the reference bath. The gel was across test bath 2 and the reference bath. Test bath 2 was perfused. For the gel potential measurement, the shorting bridge was placed across test bath 1 and test bath 2. For the shorted potential, the shorting bridge was placed across test bath 1 and the reference bath. Because of this method, during the switching of the shorting bridge, the voltmeter recorded an open circuit potential.
2.6
Estimation of geometric changes in the gel
In the air-exposed two-bath technique, gel images and gel voltages were acquired simultaneously. Section 2.6.1 describes the equipment and methods used to acquire the images. Section 2.6.2 describes how images of the gel were used to estimate changes in the volume of the gel.
2.6.1
Measurement methods for image acquisition
The gel was imaged with a 6.3x objective (Zeiss, Oberkochen, Germany) on a com-pound microscope (Zeiss WL, Oberkochen, Germany). Brightfield images were
ob-tained with transillumination. A piezoelectric focusing device (PIFoc P-721, Physik Instrumente, Waldbronn, Germany) brought different planes of the gel into focus. The PIFoc moved a depth of 100 pm and images were collected every Pm with a sci-entific grade CCD camera (TM1010, PULNiX, Sunnyvale, CA). The time-stamped 1000x1016 pixel images were stored on an IBM-PC compatible computer running custom software for the Linux operating system.
During an experiment, each time the image acquisition program was run, 100 images of the gel at different focal planes were acquired. Of these images, there was a subset of the images where the gel was the most clearly in focus. Of this subset, the one that appeared the most clear was selected for measurements.
2.6.2
Estimation of volume changes
The method used to estimate changes in the gel's volume was based on the shape to which it typically shrunk. The shrunken volume was estimated as being two partial cylindrical cones with a small cylinder between the two cones, as shown in figure 2-6. For this calculation, 4 dimensions were measured: ro, the outer radius, ri, the inner radius, L1, the length of the conic sections and L2, the length of the cylinder. The
distances were measured in pixels using a custom software program. The pixel units were converted to pim based on the magnification. The equation for the gel volume was
22
Vn = 7T (r + r2 + rori)Li + 7rrL 2. (2.16)
The non-shrunken volume was
V = wr (2L1 + L2). (2.17)
The shrunken volume was normalized by the non-shrunken volume, vn
(2.18)
i gel 7
test L1I'L -I-L-
AE
bath I
2.7
Comparison between air-exposed gel's Cf and
normalized volume
In comparing the air-exposed gel's C1 with the normalized volume, the data from each test bath were analyzed individually. Thus, instead of doing a least squares fit, equation 2.15 was manipulated to find the estimated Cf from a measured potential difference.
Initially, Cf, L, where Cf, was the unexposed fixed charge concentration, Nf was the number of fixed charges in the gel and V, was the unshrunken volume defined in 2.6.2. For the gels used in this thesis, it was assumed that N1 remained constant.
After the gel was exposed, Cf = L, where Cf1 was the air-exposed estimated fixed
charge concentration and V, was the shrunken volume defined in 2.6.2. These two relations were combined as
C = C, (2.19)
where / was as defined in equation 2.18.
The estimates of Cf, and were plotted and a straight line was fit to the data. The slope of this line was defined as Cexperimental. The data were compared to another
line that had a slope equal to the enclosed gel's median estimated Cf and an intercept equal to zero. The slope of this line was defined as Cm,"lsed
Figure 2-6: Approximation of shrunken gel vol-ume during two-bath experiment. The gray boxes represent the reference and test bath dish edges. The shrunken gel is represented in the middle. The 4 dimensions that are measured are indi-cated.
2.8
Fabrication of the gel
2.8.1
Chemistry
The gel used in this thesis is a mesh of long-chain polyacrylamide formed from two monomers (acrylamide and bisacrylamide), sodium acrylate, ammonium persulfate (APS) and tetramethyl ethylene diamine (TEMED) (Tanaka, 1981). Acrylamide is a small organic molecule that terminates in an aminocarbonyl (-CONH2) group. Bisacrylamide consists of two acrylamide monomers linked through their aminocar-bonyl group. Each molecule of sodium acrylate has a dangling carboxyl (-COOH) group. This carboxyl group can ionize and form -COO-, giving the gel a fixed charge. Acrylamide, bisacrylamide and sodium acrylate are dissolved in AE. The addition of APS and TEMED to the solution causes a chain reaction which forms the long-chain molecules.
The gel formation process begins with a reaction between APS and TEMED leaves the TEMED molecule with an unpaired electron. The activated TEMED molecule combines with an acrylamide or bisacrylamide monomer. Because of this, the unpaired electron is transferred to the acrylamide unit making it reactive. Another monomer or a sodium acrylate molecule can then be attached and activated in the same way. By shifting the active site to the end of the chain, the polymer continues to grow indefinitely until the supply of monomers and sodium acrylate is exhausted. Acrylamide and bisacrylamide combine to produce a cross-linked matrix of long-chains. Acrylamide monomers can only combine to one active site at a time and hence they can only form long, unbranched chains. But bisacrylamide can combine to two chains at once, creating cross-links.
Bisacrylamide is also needed to give stiffness to the gel. Stiffness helps decrease swelling of the gel. A number of methods were optimized to prevent the gel from changing size due to factors not related to air exposure. As the amount of bisacry-lamide is increased, the polymers are more tightly bound together and more strongly resist any force that pulls them apart.
of the sodium acrylate will ionize depending on the pH of the gel. If all the sodium acrylate ionized, the fixed charge concentration would be -31.5 " j".
Cf was chosen to be less than 31.5 mol for two reasons. First and most important, this value is close to previously estimated values for the TM, which are in the range 6.4 m'To to 18 m'T" (Freeman and Weiss, 1997). Second, to decrease osmotic swelling, Cf should be as small as possible. Because of the gel's Cf, the concentration of the mobile ions will always be greater within the gel than the surrounding bath. As Cf increases, the mobile ion concentration difference increases from inside to outside the gel; this results in the gel swelling more.
The chemistry of the gel was further defined with AE of pH > 9 as the solvent. During the two-bath experiment, one of the two baths was always AE with a pH > 9. When a gel made with DI water is placed between AE and another high pH ionic solution, the equilibration of the gel with the baths causes a change in the gel size. To prevent this, the gel was made with AE.
2.8.2
Fabrication steps
The fabrication steps were adapted for this thesis (Mitwalli, 1998). The first step was to start with the correct protective equipment. No chemical in this preparation was without its warning. "Cancer suspect agent! Toxic! Irritant! Neurologic hazard! Mutagen! Possible Teratogen! Readily absorbed through skin! Avoid contact and inhalation!" This was the warning on the label for just one of the chemicals, acry-lamide. Non-disposable rubber gloves, lab coat, goggles and a functioning hood were necessary safety precautions.
The second step was to start with clean equipment. The consistency and repeata-bility of the gels was very sensitive to the fabricating conditions. All glassware were washed with Pex, rinsed with DI water, and let dry.
The last step before mixing the chemicals was to prepare the container in which the gel will solidify. The gel solution could have been poured into any container and it would solidify in that form. For this thesis, the gel solution was poured into 16 x 100 mm test tubes. Before pouring the gel solution into the test tube, 5 pL glass pipets
(Drummond Scientific, Broomall, PA) were inserted into the test tube. When the gel solution was poured into the test tube, capillary action drew the solution up the 5 pL pipets. From these glass pipets, the pieces of gel used in the test were obtained.
There were two mixtures prepared. In the first mixture, 0.2 g APS (Aldrich Chemicals, Milwaukee, WI) was dissolved in 5 mL AE. The solution was mixed well and then deoxygenized using either of the following two methods. One method was to place the entire solution in an enclosed space and apply a vacuum to the enclosed space. Another method was to blow a small stream of nitrogen gas (less than 40 psi) into the base of the solution's container for at least a minute. This saturated the solution with nitrogen. Because nitrogen is heavier than oxygen, it pushed all the oxygen out of the solution. Following this, the solution was covered with parafilm and set aside.
In the second mixture, 0.75 g acrylamide, 0.03 g sodium acrylate, and 0.078 g bisacrylamide (Aldrich Chemicals, Milwaukee, WI) were dissolved in 9.9mL AE. The solution is mixed well and deoxygenized after adding 0.1 mL plain (uncharged) fluo-rescent beads (Polysciences, Inc., Warrington, PA) to it.
To initiate the reaction, 24 ptL TEMED and 100 pL of the first APS solution were added to the second solution. The solution was then gently mixed for ten seconds. The solution was poured into the prepared test tube, parafilm was wrapped around top of test tube and the tube was set in a dark location for 20 hours.
If the steps were followed correctly, the gel solidified after 20 hours. The solid gel was no longer chemically hazardous. If it had not solidified, it was hazardous waste and needed to be treated accordingly. In case the reaction did not reach full completion, the gel was rinsed well with AE and handled carefully.
To remove the gel from the test tube, water was forced into the bottom of the test tube and the entire gel was pushed out. To begin, a long sharp metal object was carefully inserted to the bottom of the test tube. It was inserted near the perimeter of the tube. The metal object was moved around to slightly dislodge the gel from the test tube and removed. A 60 mL syringe was filled with AE or DI water and a long disposable glass pipette was attached to it. The tip of the pipette was inserted
into the gel where the metal object had been. Fluid was carefully pumped into the test tube. If the resistance to pumping was too large, the glass pipette was removed, and the metal object was reinserted to loosen the gel a little more. This process was repeated until the gel began to loosen from the tube and could be pushed out of the test tube. The gel was then rinsed well with AE.
After rinsing, the gel was covered and stored in the refrigerator. The gel could not be placed in any solution because then it would tend to slide out of the small glass capillary tubes. With these fabrication steps, the gel was consistent in its electrical and handling properties for at least a month.
2.9
Fabrication of the shorting salt-gel bridge
2.9.1
Chemistry
The salt gel was a highly concentrated solution of KCl mixed with agarose. Upon heating the solution, it thickened and formed a substance with the consistency of soft margarine. The salt gel could not bridge and short the two dishes without falling apart. It was fabricated inside curved glass capillary tubes to bridge the two dishes.
2.9.2
Fabrication Steps
The first step was to prepare the glass capillary tubes. Glass capillary tubes with a 1.15 mm inner diameter and roughly 15 mm long were used (GC200-15, Warner Instrument Co., Hamden, CT). The tubes were curved by bending them while holding them over a bunsen flame. Each glass tube was held with two rubber handled pliers spaced roughly 5 mm apart on the tube. The tube between the two pliers was placed in the flame. When the glass started glowing, it was bent into a half moon shape. This process was repeated for the next 5 mm of the glass tube and then again for the last 5 mm of the glass tube. After the glass tube cooled down, it was broken into 3 pieces for 3 bridges. This process was repeated until 6 to 9 bridges were fabricated.
Mil-waukee, WI) dissolved into 50 mL K3000. See table 2.1 for K3000 solution recipe. The solution was heated on a hot plate with a magnetic stirrer. To test if the solution was heated enough, small quantities of the solution were poured on a glass plate every 5 minutes or so (more often when the solution began steaming). When ready, the solution would gel quickly on the glass plate.
Once the solution was ready, it was important to work quickly before the solu-tion had gelled in the container in which it was heated. A 60 mL syringe (Becton-Dickinson, Franklin Lakes, NJ) had a piece of rubber tubing (96429-34 Tygon, Cole-Parmer, Vernon Hills, IL) fit to its tip. The other end of the tubing was alternately fit to each glass piece. When the glass piece was inserted into the hot agarose-KCl solution, the syringe was used to suck the hot solution up into the glass. The syringe and rubber tubing were then carefully removed from this bridge and the process was repeated for all bridges. The solution solidified inside the glass bridges upon cooling. After sucking up the solution into all the tubes, the tubes should be wiped off and stored in K3000 in the refrigerator. When correctly fabricated and refrigerated, the bridges would last 3-4 weeks before dissolving.
2.10
Fabrication of the Ag/AgCl salt gel Electrode
The fabrication of the Ag/AgCl salt gel electrodes was similar to the fabrication of the shorting salt gel bridges. The first step was to prepare the glass capillary tubes with the Ag/AgCl electrodes. Glass capillary tubes with a 1.15 mm inner diameter and roughly 15 mm long were used. The tubes were broken into 3 pieces, each roughly 5 mm long. Ag/AgCl electrodes with a diameter of 1.0 mm (550010, A-M Systems, Carlsborg, WA) were inserted halfway down the tubes so that the electrode lead was sticking out of one glass tube end. This lead was folded over the glass tube end. A piece of tubing (96429-34 Tygon, Cole-Parmer, Vernon Hills, IL) was fitted over this folded lead and the glass tube end.
The same agarose-KCl solution used for the shorting bridges was used for the electrodes. Similar to making the shorting salt gel bridges, a 60 mL syringe was used
to suck the hot agarose-KCl solution up into the prepared glass tubes. The only difference from the shorting bridges was that each tube for the electrodes had its own piece of tubing whereas when making the shorting bridges, one piece of tubing could be reused.
Chapter 3
Measurements of enclosed and
air-exposed gels
3.1
Enclosed measurements
3.1.1
Shorted two-bath voltages
Figure 3-1 shows voltages acquired when two baths, K696 and AE were shorted together. This voltage was not zero and was not constant. For over an hour, it was increasing at a steady rate of 5 mV/hour. As described in section 2.4, this voltage is due to potentials other than the gel's potential. This voltage was different from one experiment to the next. These potentials were caused by numerous things, convection in the fluid, temperature variations, diffusion of contamination ions, etc. In the case of this experiment, if the gel was measured without referencing it to this shorted value then it would appear that the gel's voltage was increasing at a rate of 5 mV/hour in addition to the actual gel voltage. Figure 3-2 shows the shorted voltage plus the gel voltage below it. By looking at the difference between the gel potential and the shorted potential in this experiment and in all experiments, the voltage is much more reliable, repeatable and accurate.
5.8 16 16.2 16.4 16.6 16.8 17 time [hour] I I I I I I I I I I 1 1 -15.8 16 16.2 16.4 16.6 16.8 time [hour] -1.015 a) 0D-0.01 a) 0 .005 ,_Q.015 -a) C-0.01 -CD a>) :2 0.005 -17
Figure 3-1: Measurement of poten-tial as a function of time. The potential is due to shorting a test bath of K696 and a reference bath of AE with a 3 M KCl salt gel shorting bridge. Because the poten-tial wasn't measured continuously, there are breaks in the measure-ments.
Figure 3-2: Measurement of poten-tial as a function of time. The two-bath potential of the artificial gel was measured alternately with the potential of the two-baths shorted. The potential measurements con-sisting of the top sequence are the shorted two-bath potentials and also the same measurements as in figure 3-1. The potential measure-ments that consist of the bottom se-quence are the gel's potential.
L
- -- ...
-. - . .
U- ,,.
. W
Shorted potential on top Gel potential on bottom
3.1.2
Potential measurements before perfusion
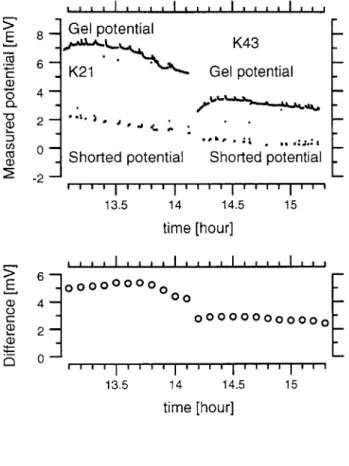
Figure 3-3 shows data taken with the three-bath technique before perfusion was incor-porated into the technique. At 14.15 hours, the test solution was changed from K21 to K43. When the test solution was K21, the voltage difference increased to about 5.5 mV and then began decreasing. For a test bath of K43, the voltage averaged a little less than 3 mV. The test bath of K21 elicited a larger potential than the potential elicited with the test bath of K43. This is consistent with the qualitative notion that the increase in KCl concentration shields the fixed charges in the gel to reduce the potential. The gel's potential also had a positive polarity which is consistent with the gel having a negative fixed charge.
The potential measured for the gel exhibited a transient immediately after switch-ing to it and removswitch-ing the short. This transient was attributed to a stagnation layer that developed at the junction between the gel and bath when the switching and movement of the solutions ceased. A stagnation layer decreases the sharp concen-tration difference from gel to bath, and hence decreases the junction potential, as theorized in equation 2.3. When the test bath was perfused the voltage difference increased as seen in the next subsection.
3.1.3
Potential measurements after perfusion
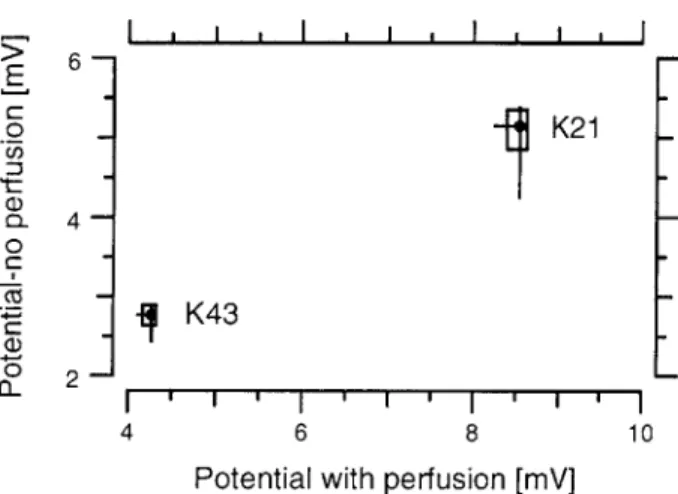
Figure 3-4 shows the voltages acquired for a two-bath experiment with a perfused test bath. Similar to figure 3-3, the gel's potential difference was measured for K21 and K43. A comparison of perfused and non-perfused potential differences for both K21 and K43 is shown in figure 3-5. For both test bath solutions, K21 and K43, a larger potential difference was measured when the test bath was perfused and the perfused potential differences vary less.
A second perfused experiment for K21 and K43 is shown in figure 3-6. Although there is more voltage drift, the voltage differences are relatively constant and similar to the differences in figure 3-4. The differences remained relatively constant for each test bath for more than 2 hours.
I . . I I I I I I I I I a I
Gel potential
K43
K21 Gel potential
Shorted potential Shorted potential
13.5 14 14.5 15 time [hour] C a) 0. =3 E a) 0-C a) a) 0 13.5 14 14.5 15 time [hour]
- Figure 3-3: Measurements of the three-bath potential as a function
- of time for different concentrations
of KCl in the test bath. The refer-- ence bath contained AE. At 14.15 hours, the test bath was switched
- from K21 to K43. The larger
po-tential, measured when the gel was across the two baths is labeled 'gel potential.' The smaller potential, close to zero and labeled 'shorted potential,' was measured when the two baths were shorted. The lower
- graph shows the corresponding
cal-culated differences between these
- measured shorted and gel poten-tials.
I I I I I I I I II I I I I II I I I I I a I I I I I I I I
Gel potenia ,4
K21 Gel potential
Shorted potential Shorted pote
.,
, I , I " , , 9.6 10 10.4 10.8 tial 11.2 11.6 12 Time [hours] ~000000000 9.2 9.6 10 10.4 10.8 11.2 11.6 12 Time [hours]Figure 3-4: Measurements of the two-bath potential as a function of time for different concentrations of KCl in the test bath. The refer-ence bath contained AE. At 11.0 hours, the test bath was switched from K21 to K43. The larger po-tential, measured when the gel was across the two baths is labeled 'gel potential.' The smaller po-tential, close to zero and labeled 'shorted potential,' was measured when the two baths were shorted. The lower graph shows the cor-responding calculated differences between these measured shorted and gel potentials.
4~~ 2 0
j
-2 6 4-2 0 -00000000 0 00 000 00000000 E 0. a)_ _0 a) 9 8 7 6 5 4 3 2 1 0 9.2 E C) a) a) 10 8 6 4 2 0 r6 8
Potential with perfusion [mV]
10
,asalaImmmlmml ml mama.~nInlama amlmIll inalnin
Gel potential K43 K21 Gel potentiAl Shorted potential Shorted potential 6.5 7 7.5 8 8.5 9 9.5 10 10.5 11 11.5 time [hour]
Lla 1111 i I I lU a111a1m lam lm ,
Figure 3-5: Comparison of mea-sured potential differences for a per-fused and a non-perper-fused test bath. The data for the perfused and the non-perfused are represented as box and whisker plots. The box indi-cates the interquartile range, the
- circles represent the medians and - the vertical and horizontal lines - span the entire non-perfused and
perfused data, respectively. The test bath solution for each compar-ison is indicated next to the box.
: Figure 3-6: Measurements of the - three-bath potential as a function - of time for different concentrations of KCl in the test bath. The ref-erence bath contained AE. At 8.8
- hours, the test bath was switched
from K21 to K43. The larger po-tential, measured when the gel was across the two baths is labeled 'gel potential.' The smaller potential, close to zero and labeled 'shorted
- potential,' was measured when the - two baths were shorted. The lower
graph shows the corresponding
cal-- culated differences between these - measured shorted and gel
poten-tials. E 0: 0 U, 0 0 0- 4-I , a I I a I , I K21 K43 4 10 - 5- 0-E 0Z E a, 10 8 6 -4-J 2] 0 6.5 7 7.5 8 8.5 9 9.5 10 10.5 11 11.5 time [hour] QVAV=q9MW=XV
E 7Z, C: CD U) 6 0.5 0 -0.5--1 I . I a a I . . I Shorted potential K348 Gel potential 1.4 11.8 12.2 12. time [hour] replaced with fresh AE 0 o 0 0 00 00 / 1.4 11.8 12.2 12. time [hour]
Figure 3-7 and figure 3-8 show results from two-bath and three-bath experiments respectively. K348 was the test bath. The referenced gel potential, the difference, is negative. This switch from a positive potential to a negative potential was consistent with the test bath switching from having a smaller KCl concentration than the refer-ence bath to having a greater KCl concentration than the referrefer-ence bath. In figure 3-7 the drop in voltage at 12.2 hours was due to getting new AE for the reference bath. Figure 3-8 shows the voltage difference decreasing over the course of the experiment.
Figure 3-9 shows data taken during a three-bath experiment when K696 was the test bath. As seen in figure 3-9, the shorted potential measurements exhibited some transients after switching. The drop in the potential measured for the gel at 10.0 hours is due to replacing the AE in the reference bath with new AE.
6
Figure 3-7: Measurements of the two-bath potential as a function of time with the test and refer-ence bath as K348 and AE, re-spectively. The negative potential, measured when the gel was across the two baths is labeled 'gel po-tential.' The positive potential, close to zero and labeled 'shorted potential,' was measured when the two baths were shorted. The lower graph shows the corresponding cal-culated differences between these measured shorted and gel poten-tials. > ... E -0.2 --0.4 -a)-0.6 ..1 0 .
3- 10 -18 18.5 19 19.5 20 time [hours] E 1.5 a) -C 0.5- -0-c -0.5 --0.25 -0.75 -1.2 5 0-1.75 20.5 o00020.oooooooooooooo 5 18 18.5 19 19.5 20 20.5 time [hours] I . I . I . . I I I . I Shorted potential K696 G- p Gel potential er r-I r-I I I I I I I , 7.6 8 8.4 8.8 9.2 9.6 10 10.4 10.8 time [hour] I .* I .* I I I I I I replaced with fresh AE 00000000 0 00***** 000*0 7.6 8 8.4 8.8 9.2 9.6 10 10.4 10.8 time [hour] E 0 an C)
- Figure 3-9: Measurements of the - three-bath potential as a function
of time with the test and
refer-- ence bath as K696 and AE re-~ spectively. The measurements al-ternate between the gel's potential (the bottom sequence of measure-ments) and the potential of the two baths shorted (the top measure-ment sequence). The lower graph shows the corresponding calculated differences between these measured shorted and gel potentials.
K348
Shorted potentia ' ,
Gel potential
- Figure 3-8: The upper graph shows - measurements of the three-bath
po-* tential as a function of time with
- K348 in the test bath and AE in the
reference bath. The measurements alternate between the gel's poten-tial (the bottom sequence of mea-surements) and the potential of the two baths shorted (the top measure-ment sequence). The lower graph shows the corresponding calculated differences between these measured shorted and gel potentials.
E a) a) 0 -0.2 -0.4 -0.6 -0.8 -1