Publisher’s version / Version de l'éditeur:
Vous avez des questions? Nous pouvons vous aider. Pour communiquer directement avec un auteur, consultez la
première page de la revue dans laquelle son article a été publié afin de trouver ses coordonnées. Si vous n’arrivez pas à les repérer, communiquez avec nous à PublicationsArchive-ArchivesPublications@nrc-cnrc.gc.ca.
Questions? Contact the NRC Publications Archive team at
PublicationsArchive-ArchivesPublications@nrc-cnrc.gc.ca. If you wish to email the authors directly, please see the first page of the publication for their contact information.
https://publications-cnrc.canada.ca/fra/droits
L’accès à ce site Web et l’utilisation de son contenu sont assujettis aux conditions présentées dans le site LISEZ CES CONDITIONS ATTENTIVEMENT AVANT D’UTILISER CE SITE WEB.
Research Report (National Research Council of Canada. Institute for Research in
Construction), 2004-02-01
READ THESE TERMS AND CONDITIONS CAREFULLY BEFORE USING THIS WEBSITE.
https://nrc-publications.canada.ca/eng/copyright
NRC Publications Archive Record / Notice des Archives des publications du CNRC : https://nrc-publications.canada.ca/eng/view/object/?id=8c0f3fa3-6fe2-4b56-8562-9dc2dfc4b56d https://publications-cnrc.canada.ca/fra/voir/objet/?id=8c0f3fa3-6fe2-4b56-8562-9dc2dfc4b56d
NRC Publications Archive
Archives des publications du CNRC
For the publisher’s version, please access the DOI link below./ Pour consulter la version de l’éditeur, utilisez le lien DOI ci-dessous.
https://doi.org/10.4224/20377368
Access and use of this website and the material on it are subject to the Terms and Conditions set forth at
Measurements of Screen Insertion Loss in an Anechoic Chamber
Warnock, A. C. C.
Measurements of Screen Insertion Loss in an Anechoic Chamber
Warnock, A.C.C.
IRC-RR-157
February 2004
INTRODUCTION
INTRODUCTION
This report presents measurements of sound attenuation due to a barrier placed between a source and four receiving positions in the anechoic chamber at IRC. The measurements were made on behalf of Public Works and Government Services Canada (PWGSC). This report is the fourth in a series. The first report1 presents
measurements of sound propagation made in nine offices. The second report2 presents measurements of speech levels in the offices. Background and some design information for open offices can be found in the third report3. The fifth report4 presents results of a study on the effect of speaker orientation and reflectivity of vertical surfaces in open ‘team-style’ offices in a simulated office in the laboratory. The sixth report5 presents measurements of the average sound field around the heads of human talkers.
Sound attenuation by an open-office barrier depends on factors other than the height and width of the barrier. To provide more reliable information for modeling open offices, measurements were needed to establish the magnitude of the variations due to factors such as the construction of the screen edge and reflections from the floor.
The measurement team comprised Jean-Charles Guy†, Wing Chu and Alf Warnock of the Institute for Research in Construction, National Research Council of Canada (NRC).
†
A guest student from INSA de Lyon, France.
SUMMARY OF FINDINGS
SUMMARY OF FINDINGS
Algorithms given in the literature for calculating screen insertion loss are usually for screens with a thin edge 6,7. The algorithms do not usually include sound paths that involve reflections from other surfaces such as the floor. These reflected sound rays interfere with the diffracted rays so that measured screen insertion losses in real situations do not agree precisely with calculations made using simple algorithms.
The width of the top edge of the screen and its absorptive properties introduce further departures from the simple algorithms. Given a well-defined laboratory situation, it is possible to compensate for these effects to some extent. In practice, variations in the work environment due to activities of the occupants will make any predictions of screen insertion losses at specific frequencies inaccurate.
Empirical algorithms were developed for calculating screen insertion loss for different screen conditions. These are described in the main body of the report. These algorithm are based on a regression fit to the data collected in this project. They give results that are close to but different from those calculated using the expressions commonly used for calculating screen insertion loss 6,7.
While the effects of interference are easily visible, there is no practical way to take account of these effects. The conclusion drawn from this work is that the weighting and averaging process
necessary to calculate speech intelligibility ratings will make the influence of interference small enough to be ignored.
BACKGROUND
BACKGROUND
In the absence of any barriers to sound propagation, sound in an open office can travel directly from speakers to listeners. The attenuation that occurs for this direct wave is due to the spreading of the energy over an expanding surface as the sound propagates away from the source. This leads to an attenuation of 6 dB for each doubling of the distance from the source. In addition to this direct path, sound may reflect from the ceiling, the floor, and vertical surfaces. With materials normally found in offices, each reflection results in some loss of energy but the net effect of these reflections is to increase the sound energy arriving at the receiver.
When there is a barrier between occupants, sound must bend around the barrier (diffraction) to reach listener locations on the other side. The attenuation during this diffraction process depends on the angle through which the sound has to bend — the greater the angle, the greater the attenuation. Thus higher and wider barriers give more attenuation (It should not be forgotten that diffraction occurs at vertical edges of barriers too).
d A B
S
R
θ
Figure 1: Diffraction over a semi-infinite screen from source, S to receiver, R.
In Figure 1, the greater the angle
θ
, the more sound is attenuated
when propagating from the source, S, to the receiving point R. The difference in sound pressure level at the point R with and without theBACKGROUND
screen is called the insertion loss. The insertion loss is usually related to the Fresnel number,
N
, which is defined asλ
−
+
=
2
(
A
B
d
)
/
N
where the distances
A
,B
, and are shown in Figure 1 and is the wavelength of sound at the frequency of interest. Because the Fresnel number combines distances and wavelength, two different arrangements of source and receiver can have the same value of N at different wavelengths or frequencies. In many of the charts in this report, small values of N correspond to low frequencies but this is not always so.d
λ
The work done by Maekawa6 is most often referred to and used as the basis for calculating the insertion loss due to a screen. Rather than read insertion loss values from the chart presented by Maekawa, it is common to use some formula that gives the same values as the best-fit line in the Maekawa chart. Yamamoto and Takagi7 examined four formulas of different complexity that fit the Maekawa chart data with different precision. In this report, the second formula is used and referred to in charts as Yam2. It is
10 log N +13
forN
>1IL =
5+8N |N|
-0.55-0.143|N|for –0.3<
N
<1 ( 1 )0
forN
<-0.3The data presented in Maekawa’s paper showed a significant degree of scatter about the best-fit curve. In view of this scatter and the uncertainty relating to barrier edge details, a set of
measurements was made in the anechoic room to determine how well the Yamamoto curve fitted the experimental data in simulated office situations.
While there has been a great deal of work done on attenuation of sound by barriers near highways, there is not very much information about barriers in open plan offices. One aspect of highway barriers that has received considerable attention is the design of the edge of
BACKGROUND
the barrier. There are considerable gains in attenuation to be had by reshaping the edge of the barrier without increasing its height8,9. Theory predicts that the impedance of the edge can also affect the insertion loss of a barrier10,11. Thus there was a need to measure the effect of such variables for edges likely to be found in open offices.
MEASUREMENT PROCEDURES
MEASUREMENT PROCEDURES
The sound source for the measurements was a Bruel and Kjaer omnidirectional source oriented with its long axis horizontal (See Figure 2 and Figure 3). On the shielded side of the barrier, four 13-mm diameter condenser microphones measured the received sound (Figure 4).
After some initial measurements, there was always a floor in place on the receiving side of the barrier. This eliminated the diffracted path around its bottom edge. The barrier filled the whole width of the anechoic chamber so diffraction around the vertical edges did not need to be considered.
Rather than repeatedly changing the height of the 1.2 m high barrier, the measurement axis was moved up and down to simulate changes in barrier height. The measuring axis was set at four heights: 1.0, 1.1, 1.2, and 1.4 m. Assuming a height of 1.2 m for the mouth or ears of a seated human, these axis heights correspond to barrier heights of 1.4, 1.3, 1.2 and 1.0 m respectively in normal offices. One disadvantage of this approach is that reflections from the floor are not correctly simulated. However, these reflections were expected to be of minor significance.
The effects of the width of the screen edge, sound absorbing material on the screen edge, sound absorbing material on the vertical surfaces of the barrier and on the floor on the receiving side were measured.
The reference condition for these measurements was the case where there was no barrier and no floor in the anechoic chamber, only the source and the microphones (Figure 3). Screen insertion losses were calculated as the difference between the levels measured for the reference case and the levels measured for each experimental condition.
The barrier and floor layers were constructed from 13 mm thick oriented strand board (Figure 4). Sound transmitted through the body of the barrier was negligible relative to that diffracted over the top.
MEASUREMENT PROCEDURES 1 .2 0 m B&K omni source .8 m 1.4 m 1.2 m 1 2 3 4
Figure 2: Sketch of experimental layout.
Figure 3: View of experimental layout showing Bruel and Kjaer omnidirectional source and the four receiving microphones.
Figure 4: Barrier in place with hard upper edge installed.
RESULTS
RESULTS
Ideal case
In the ideal theoretical case, the barrier extends to infinity below the source and the microphones and laterally. The presence of a floor on the microphone side allows diffracted sound to reflect from the floor and interfere with sound diffracting directly to the microphone. Sound diffracted down to the floor will be significantly more
attenuated than sound that is only diffracted enough to strike the microphones. Reflections from the floor can be further attenuated by covering it with a layer of sound absorbing material. This
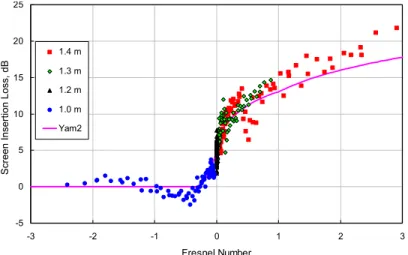
arrangement comes closest to the ideal case and should most closely agree with Maekawa’s data. Measurements made for this configuration are shown in Figure 5. In this and similar charts that follow, a single point represents a measurement at one frequency band and at one microphone position and height. There were four microphones and four measurement heights. Data for each measurement height are identified by a different color and symbol. Negative values of the Fresnel number mean that the screen edge was below the axis of measurement. The effective height of the screen is shown in the legend.
Two features of this chart should be noted:
• There is a great deal of scatter in the data – small changes in Fresnel number give rise to quite large changes in insertion loss. This scatter can not be attributed entirely to experimental
uncertainty.
• Even for a nominal Fresnel number of zero, where the screen height and the height of the axis of measurement are the same, there is attenuation due to the presence of the screen, as predicted by equation ( 1 ). But instead of a single value of 5, the attenuation ranges from about 2 to 8 dB.
Some of the reasons for the scatter in the data are examined in the sections that follow.
RESULTS -5 0 5 10 15 20 25 -3 -2 -1 0 1 2 3 Fresnel Number
Screen Insertion Loss, dB
1.4 m 1.3 m 1.2 m 1.0 m Yam2
Figure 5: Measured screen insertion loss plotted against Fresnel number. Reflections from the floor on the microphone side were reduced by covering the floor with 25 mm of glass fibre. The top of the screen was capped with a 100 mm wide piece of oriented strand board. Yam2 is the insertion loss calculated using equation (1).
Effect of floor reflections
In the test setup depicted in Figure 2 there is a path on each side of the barrier that involves a reflection from the floor as well as the direct, non-reflected path over the top of the barrier to the microphone. These reflected paths are shown in Figure 6. The combination of all these paths gives four paths for transmission from the source to the receiver. Sound waves traveling along each of the paths interfere constructively and destructively with each other when they arrive at the measurement point. The interference causes the screen insertion loss to differ from that predicted by the expression for the path directly to the top of the barrier and then directly to the receiving microphone.
Sound reflecting from the floor bends through much greater angles at the top of the barrier to reach the microphone than does sound following the non-reflected path. So, sound reflected from the floor will be subject to greater attenuation due to diffraction. This greater attenuation should reduce the effects of interference to some extent.
RESULTS
Figure 6: Diffracted and reflected paths over the barrier.
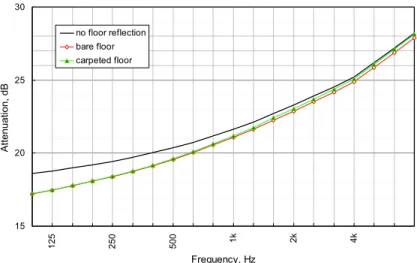
The probable effect of floor reflections only on the microphone side of the screen can be calculated using equation ( 1 ) and ignoring interference effects. The results of the calculation are shown in Figure 7. The effects of a carpet on the floor are included in one case. The differences in insertion loss are less than 1 dB for all frequencies above 250 Hz. These calculations take no account of interference effects but suggest nevertheless that the effects of floor reflections, even for an omnidirectional source should be small and mostly at low frequencies. For office occupants seated at a desk, floor reflections will not be important because there is no direct path down to the floor.
15 20 25 30 125 250 500 1k 2k 4k Frequency, Hz Attenuation, dB no floor reflection bare floor carpeted floor
Figure 7: Calculated insertion loss for a screen with and without reflections from the floor on the receiving side.
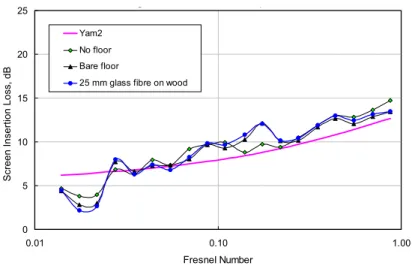
The effects of reflections from the floor on each side of the screen were measured separately. Figure 8 shows the effect of adding a bare floor on the source side of the barrier and then covering it with 25 mm of glass fibre. The differences among the three cases are
RESULTS
generally quite small except at a few points. As the effects were small, all subsequent measurements were made with no floor installed on the source side for convenience.
g p 0 5 10 15 20 25 0.01 0.10 1.00 Fresnel Number Sc reen Ins e rtion Los s , dB Yam2 No floor Bare floor
25 mm glass fibre on wood
Figure 8: Influence of reflections from the floor on the source side of the screen. Mic 1 only, effective screen height 1.3 m, both screen surfaces and upper edge bare. The floor on the microphone side was covered with a 25 mm thick layer of glass fibre.
Figure 9 shows the results of measurements for a single microphone where a floor was added on the microphone side of the screen and then covered with three different materials. In this figure, the greatest change occurs when the floor is added. The location of the peaks and valleys due to interference shift markedly due to the elimination of the diffracted path around the bottom edge of the screen. (There was no floor on the source side for this measurement set.) Changes when the floor is covered with carpet or sound-absorbing material are smaller.
The effect of a carpet on the floor for all four microphones can be seen by comparing Figure 10 and Figure 11. There is still
considerable scatter in the data and, surprisingly perhaps, the insertion loss values for Fresnel numbers greater than 2 are slightly greater when the floor is bare. This may just be experimental error.
RESULTS 0 5 10 15 20 25 0.0 0.1 1.0 Fresnel Number Sc reen Ins e rtion Los s , dB Yam2 None Bare 25 mm glass fibre Carpet 90 mm glass fibre
Figure 9: Influence of reflections from the floor on the microphone side of the screen. The three floor coverings used are listed in the chart legend. Mic 1 only, effective screen height 1.3 m. No floor on the source side.
-5 0 5 10 15 20 25 -3 -2 -1 0 1 2 3 Fresnel Number Sc reen Ins e rtion Los s , dB 1.4 m 1.3 m 1.2 m 1.0 m Yam2
Figure 10: Measured screen insertion loss for all four microphones and a carpeted floor on the microphone side of the screen. The top of the screen was capped with a 100 mm wide piece of oriented strand board.
RESULTS -5 0 5 10 15 20 25 -3 -2 -1 0 1 2 3 Fresnel Number Sc reen Ins e rtion Los s , dB 1.4 m 1.3 m 1.2 m 1.0 m Yam2
Figure 11: Measured screen insertion loss for all four microphones and a bare wood floor on the microphone side of the screen. The top of the screen was capped with a 100 mm wide piece of oriented strand board.
To verify that the variations seen are due to interference between the sound reflected from the floor and the sound traveling directly from the top of the screen to the microphone, a simple calculation was made that included interference effects. The floor was assumed to be perfectly reflecting. Figure 12 compares the calculated values with measured values. The agreement in the lower frequency bands is good enough to confirm that interference is the cause of the variations in the attenuation curves and some of the scatter in plots of insertion loss versus Fresnel number.
These data permit a conclusion at this point. Ignoring interference effects when calculating attenuations in open offices will inevitably lead to inaccurate results. Unfortunately including interference requires much more elaborate calculations and more information than is commonly available about materials used in open offices. The important question then is, “How serious are these
inaccuracies?” Not all frequencies contribute equally to speech intelligibility. When the appropriate weighting functions are used, it will be shown later that estimates of speech intelligibility made while ignoring interference are good enough for practical purposes.
RESULTS 0 2 4 6 8 10 12 14 160 200 250 315 400 500 630 800 1000 1250 1600 2000 2500 3150 Frequency (Hz) Inser ti on Loss ( d B) calculated measured
Figure 12: Comparison of calculated screen insertion loss, including interference effects, with measured insertion loss.
Effect of changes to screen edge
The measured insertion losses in Figure 9 are noticeably greater than those predicted by equation ( 1 ). Part of this departure from theory is due to the form of the screen edge. Figure 13 shows the changes in screen insertion loss when a 100 mm wide board is placed on top of the barrier forming a T. The 100 mm wide board was used during most of the measurements since office screens typically have such edges. The effect of 300-mm boards was also measured. These were meant to simulate bookshelves that are sometimes used at the top of a screen. They were positioned with the whole width on the source or the receiving side of the mid-plane of the screen as noted in the chart. These changes to the edge of the screen significantly increase the insertion loss .
The boards were further modified by adding a layer of 25 mm glass fibre on top. The insertion loss values for these cases are shown in Figure 14. Clearly the insertion loss can be significantly increased by modifying the configuration of the screen edge.
In practice, the edge configuration will be changed by the actions of the occupants. A row of books on a bookshelf at the top of a screen will increase the effective height of the screen, which is an acoustical benefit. Alternatively, an absorptive screen edge might be covered
RESULTS
by objects lying flat on top; the benefit of the sound absorbing material would be lost.
0 5 10 15 20 25 0.01 0.10 1.00 Fresnel Number Sc reen Ins e rtion Los s , dB Yam2 None 100 mm 300 mm, source side 300 mm, mic side
Figure 13: Effect of adding horizontal plates on top of the screen. Mic 1 only, effective screen height 1.3 m.
0 5 10 15 20 25 0.01 0.10 1.00 Fresnel Number Sc reen Ins e rtion Los s , dB Yam2 100 mm 300 mm, source side 300 mm, mic side
Figure 14: Effect of adding horizontal plates covered with 25 mm glass fibre on top of the screen. Mic 1 only, effective screen height 1.3 m.
RESULTS -5 0 5 10 15 20 25 -3 -2 -1 0 1 2 3 Fresnel Number Sc reen Ins e rtion Los s , dB 1.4 m 1.3 m 1.2 m 1.0 m Yam2
Figure 15: Effects of adding sound absorbing material on top of the 100 mm wide screen edge. Carpeted floor on receiving side.
Effect of sound absorbing material on vertical surfaces of screen
Screens in open offices usually have sound absorbing material on each face. The primary and very important purpose of this material is to reduce reflections from the screen faces. Measurements of the screen insertion loss with and without sound absorbing material on the screen faces showed that the insertion loss was not changed significantly by the addition of the material. The results of these measurements are shown in Figure 16.
0 5 10 15 20 25 0.01 0.10 1.00 Fresnel Number Sc reen Ins e rtion Los s , dB Yam2 None Source Face Mic Face Both faces
Figure 16: Effects of adding sound absorbing material on each face of the screen. Microphone 1 only, effective screen height 1.3 m.
RESULTS
Conclusion from the measurements
The form of the screen edge is important. For best attenuation, the edge should be covered with sound-absorbing material. Having a wide bookshelf incorporated at the top of the screen increases the attenuation. If books and binders are placed on the shelf, these increase the height of the screen and so the attenuation.
Reflections introduce significant variations from predicted insertion loss values because of constructive and destructive interference between sound waves. Reflections can occur from the floor, furniture and walls as long as there is an unobstructed path from the source to the reflecting surface. Covering reflecting surfaces with sound-absorbing material reduces the effects of these reflections.
Revised algorithms
In most of the preceding charts the screen insertion loss calculated using equation ( 1 ) is displayed along with measured results. It is clear that this equation does not always give acceptable predictions. To address this point, the data were used to generate revised algorithms.
Expressions of the form IL = a*Nb were fitted to the measurements for N > 0. For N ≤ 0, equation ( 1 ) works well enough and insertion losses for such values of N are so small as to be of no practical importance.
The analysis showed that the same equations could be used to fit the 300 mm shelf data no matter which side of the screen it was on — source or microphone. The a and b coefficients for the four cases needed are given in the following table together with the square of the correlation coefficient for the fit. The four curves generated by these equations are shown in Figure 17. The interference effects seen in the measurements make these equations somewhat
imprecise. The table shows the root mean square error for the fitting process ranges from 1.3 to 2.0 dB. The table also shows the mean square errors arising when attenuations were calculated using equation ( 1 ). Where screen edges are hard, the mean square
RESULTS
errors are only slightly worse than those from the modified equations. When the screen edge is soft, the modified equations give better estimates of the attenuations.
Table 1: Coefficients and root mean square errors for regression fits to measured screen insertion loss values.
Normal width screen Screen with bookshelf Edge
conditions Soft Hard Hard Soft
a 15.95 13.95 14.7 17.93 b 0.277 0.245 0.212 0.266 r2 0.811 0.785 0.842 0.845 rms error 1.8 1.5 1.3 2.0 0.01 0.1 1 0 5 10 15 20 25 Inse rtion Lo ss, dB Fresnel Number Yam2 Soft edge Hard edge Hard Shelf Soft Shelf
Figure 17: Algorithms for estimating insertion loss for screens. These new algorithms were used to calculate the screen insertion losses for most of the arrangements measured. These insertion losses were then used to calculate the articulation class rating12 (AC). The AC is based on articulation index13 and so correlates very well with it and with speech intelligibility index14 (SII). For the sample used, the mean difference between the measured and calculated AC values was 3 with a standard deviation of 6. This corresponds to a weighted level difference of 0.3 dB with a standard deviation of 0.6 dB.
RESULTS
Articulation class takes no account of background noise so as a further check values of SII were calculated for measured and calculated insertion losses using typical voice and background noise levels. Equation (1) was used to calculate insertion loss for all cases whether the edge of the screen was reflective or absorptive.
Insertion losses were also calculated using the expressions in Table 1. The resulting SII values are displayed in Figure 18. It is clear that values calculated using equation (1) are generally too high. The agreement between the NRC empirical equations and the measured values is satisfactory, apart from one or two points. Thus, as
expected, interference effects can be ignored for practical calculations. 0.05 0.10 0.15 0.20 0.25 0.05 0.10 0.15 0.20 0.25 Measured SII Calc ulated SII Yam2 NRC, Hard NRC, soft
Figure 18: Speech intelligibility calculated using equation (1) and the equations developed in this report for hard and soft screen edges. The continuous line is a reference for perfect agreement.
SUMMARY
SUMMARY
The commonly used algorithm for screen insertion loss
under-predicted the data in these measurements. A wider screen edge and the presence of sound-absorbing material on it increase the insertion loss of the screen.
Interference between the wave traveling directly from the top of the screen to the microphone and the wave reflecting from the floor causes further differences between measured and calculated
insertion losses in some frequency bands. These interference effects can be ignored if only global ratings such as speech intelligibility index are required.
New algorithms were developed that fitted the data better.
REFERENCES
REFERENCES
1
Measurements of Sound Propagation in Open Offices, A.C.C. Warnock and W.T. Chu. Internal Report IR-836. Institute for Research in Construction. NRCC. August 2000.
2
Voice and Background Noise Levels Measured in Open Offices, W.T. Chu and A.C.C. Warnock. Internal Report IR-837. Institute for Research in Construction. NRCC. August 2000.
3
Guide To Open Office Acoustics, A.C.C. Warnock. Research Report B3144.3. Institute for Research in Construction. NRCC. August 2000.
4
Sound Propagation in a Simulated ‘Team-style’ Open Office, W.T. Chu and A.C.C. Warnock. Research Report RR-156, Institute for Research in Construction. NRCC. September 2001..
5
Detailed Directivity of Sound Fields around Human Talkers, W.T. Chu and A.C.C. Warnock. Research Report RR-104, Institute for Research in Construction. NRCC. September 2001.
6
Noise Reduction by Screens. Z. Maekawa. Appl. Acoustics, 1, p.157, 1968.
7
Expressions of Maekawa’s Chart for Computation. K. Yamamoto and K. Takagi. Appl. Acoustics, 37, p75, 1992.
8
Study on noise reduction by T-profile barrier. M. Hasebe. Proc. InterNoise 94, vol 1, p 591, 1994.
9
Highway Noise Barriers: New Shapes. D. N. May and M.M. Osman. Journal of Sound and Vibration, vol 71, p73, 1980.
10
A note on improving the attenuation given by a noise barrier., G.F.Butler. Journal of Sound and Vibration, 32(3), p367, 1974.
11
Influences of covering materials on the noise-reducing efficiency of a barrier with an absorbing edge. M. Fujiwara, Proc. InterNoise 89, p 353, 1989.
REFERENCES
12
ASTM E1110 Standard Classification for determination of articulation class.
13
ASTM E1130 Standard Test method for objective measurement of speech privacy in open offices using articulation index.
14
ANSI S3.5. American National Standard Methods for the Calculation of the Speech Intelligibility Index.