Publisher’s version / Version de l'éditeur:
Vous avez des questions? Nous pouvons vous aider. Pour communiquer directement avec un auteur, consultez la première page de la revue dans laquelle son article a été publié afin de trouver ses coordonnées. Si vous n’arrivez pas à les repérer, communiquez avec nous à [email protected].
Questions? Contact the NRC Publications Archive team at
[email protected]. If you wish to email the authors directly, please see the first page of the publication for their contact information.
https://publications-cnrc.canada.ca/fra/droits
L’accès à ce site Web et l’utilisation de son contenu sont assujettis aux conditions présentées dans le site LISEZ CES CONDITIONS ATTENTIVEMENT AVANT D’UTILISER CE SITE WEB.
Journal of Cellular Plastics, 24, 4, pp. 327-347, 1988-07
READ THESE TERMS AND CONDITIONS CAREFULLY BEFORE USING THIS WEBSITE. https://nrc-publications.canada.ca/eng/copyright
NRC Publications Archive Record / Notice des Archives des publications du CNRC : https://nrc-publications.canada.ca/eng/view/object/?id=8f030d6a-3e5a-43be-83d5-516f766a755f https://publications-cnrc.canada.ca/fra/voir/objet/?id=8f030d6a-3e5a-43be-83d5-516f766a755f
NRC Publications Archive
Archives des publications du CNRC
This publication could be one of several versions: author’s original, accepted manuscript or the publisher’s version. / La version de cette publication peut être l’une des suivantes : la version prépublication de l’auteur, la version acceptée du manuscrit ou la version de l’éditeur.
Access and use of this website and the material on it are subject to the Terms and Conditions set forth at
A Model of aging for gas-filled cellular plastics
Ser
TH1
TJ2ld National Research Conseil national
no. 1572
k
1
Council Canada de lacherches Canada c . 2BLDG Institute for Research in lnstitut de recherche en - - - - . Construction construction
A Model of Aging for Gas-Filled
Cellular Plastics
by M. Bomberg
Reprinted from
Journal of Cellular Plastics Vol. 24, No. 4, July 1988 p. 327
-
347(IRC Paper No. 1572)
NRCC 29770 NRC
-
clsnI R C
L I B R A R Y
FEB
1 G 1989
B ~ B L ~ O T H ~ Q U E
IIIIIIII
II
~ ~ I ~ I ~ I I
9 02 ~~ 75IIIII~~
~IIIII
--ABSTRACT'
During the service life of gas-filled cellular plastics (GFCP), air diffuses into the foam cells and the gaseous blowing agent diffuses out, each at a rate that depends on type of polymer and temperature. This process, which reduces the effectiveness of insulation. is known as aging.
This paper presents a model for calculating the thermal resistance of the GFCP slab as a function of time. It incorporates the effect of phase changes (condensation a n d evaporation) in the gaseous blowing agent and the use of material characteristics (diffusion coefficient) varying in the cross-section of the GFCP slab. The results are compared with measurements.
Pendant la durie de service des plastiques ceHuluires cmplis de gaz (PCEG), I'air se repand dans les cellules de mousse et l'agent poroghne gazeux s'echappe par diffusion, chacun 4 un taux qui depend du type de polymkre et de la temperature. Ce processus, qui diminue I'efficacitd de l'isolanr, est connu sous le nom de "viellissement".
Ce document presente un modkle servant i calculer la resistance thermique du panneau de PCEG en fonction &I temnr 11 tient rmmnte A= I'pffpt &P ~h~nrn-nts de phase
(condensation et ~ i n s i que de
I'utilisation de: nt dans la
A Model of
Aging
for
Gas-Filled Cellular Plastics
M.
BOMBERGNational Research Council Canada Institute fir Research in Construction
Ottawa, Ontario
KEY WORDS
Aging, cellular plastics, gas-filled foams, long-term thermal resistance, model of aging, polyurethane, thermal conductivity.
A
previous paper [I] introduced the necessity of integrating experi- ments and modelling in predicting long-term thermal resistance of gas-filled cellular plastics (GFCP). The present paper concentrates on the modelling aspect of integrated evaluation, reviewing the equations used in the model and the method of their solution. The results of calculations for one GFPC product are compared with measured values. -During the service life of GFCP insulation air components diffise into the cells and CFC gas diffises out, modifying the cell-gas composi- tion. Moreover, a fraction of the CFC enters and saturates the polymer matrix, depending on the polymer type and temperature The net effect is a gradual loss of thermal resistivity of the foam.
As the inward diffusion of nitrogen and oxygen is much faster than that of CFC outward, the aging process comprises two stages:
1. A thermal drift stage when composition of the cell gas changes a t a significant rate, mainly by the influx of air
2. A plateau stage when air diffusion is almost complete and the Reprinted from JOURNAL OF CELLULAR PLASTICS Volume 24-July 1988
lower-rate efflux of CFC causes a very slow decrease in thermal resistivity with time
Norton [21 was the first to propose a model of isothermal, multi- component diffusion for calculating thermal resistance changes with time. This model, however,
1. Required knowledge of thermal resistance a t the final stage of air- filled foam (information usually not available)
2. Approximated thermal conductivity of a gas mixture as linearly de- pendent on molar fraction of chlorofluorocarbon (CFC) gas
3. Did not relate to the material structure
Such drawbacks were partly eliminated in a subsequent model devel-
oped a t MIT [3-61. The MIT model assumed the following:
1. Heat transfer by radiation is separate from and independent of heat conduction.
2. Radiative heat transfer is described by the Rosselund approxima-
tion [71.
3. Solid phase conduction depends on material porosity, conduction of
the polymer film and distribution of polymer between material in the cell-walls (membranes or windows) and material deposited a t in- terstices of cells (struts).
4. Conduction of a gas mixture may be calculated when viscosity, ther- mal conductivity, and the relative amounts of each component are known.
Although a n improvement on Norton's linear approximation, the MIT model failed to observe that the composition of cell-gas and there- fore its thermal conductivity are strongly affected by the phase change of CFC (condensation and evaporation). Moreover, heat release and ex- traction involved in condensation and the evaporation process may affect the apparent thermal conductivity of the foam.
The present paper presents a model of aging of GFCP incorporating the effect of CFC condensation and evaporation. Its application (as that of other models) is, however, limited by the lack of proper input parame-
ters (initial CFC pressure and diffusion coefficients) [ll. An attempt to
I
determine these properties is therefore included in the methodology I
discussed.
2. MODEL OF AGING FOR GAS-FILLED CELLULAR PLASTICS
The objective is to calculate, a t any given time, the heat flux through
, A Model of Aging fir Gas-Filled Cellular Plastics 329 this calculation, time is divided into a number of steps and the slab is divided into a number of layers. For each time and space step four sepa- rate equations are evolved that calculate temperature and partial pressures of oxygen, nitrogen, and CFC, all necessary in determining the composition of the cell-gas.
The ability to calculate the cell-gas composition a t selected locations in the GFCP product as a function of time is the most important aspect of the model. As other components of heat transfer (solid phase conduc- tion, radiation, interaction between radiation and solid phase conduc- t tion) may be assumed constant, the addition of the variable contribu- tion of cell-gas conduction gives the total conduction for a given layer. Unless, however, phase changes for CFC gas have been taken into consideration, the cell-gas composition is not correct. Phase change of CFC (evaporation and condensation) affects the calculation of heat flux in two ways:
1. It modifies the composition of the cell-gas, thus directly affecting its thermal conductivity.
2. It extracts or releases heat (during phase change) thus affecting the heat flux through the foam slab.
At any given time step the model calculates
1. Temperature
I
2. Partial pressures of oxygen, nitrogen, and CFC
! 3. Saturation partial pressure of CFC and mass of CFC condensing or evaporating to maintain equilibrium
1
4. Thermal conductivity of the foam1
5. Heat flux caused by evaporation, diffusion, and condensation of CFCSeveral simplifying assumptions are made. The most important is, perhaps, the assumption that boundary conditions and material prop-- erties remain unchanged during a time step. Moreover, all material properties used in a given time step are those calculated in the previ- ous time step. This simplification is necessary because all the (dis- cussed) heat and mass transfer phenomena are interrelated. A change in temperature may cause a change in the partial pressure of any gas
1
or a change in equilibrium between condensed and gaseous CFC. A change in partial pressures affects thermal conductivity of cell-gas and alters the heat flux. The assumption therefore simplifies the calcula-, tions but imposes limitations on the time steps used.
Another simplification incorporated in the model is the assumption
energy or mass conservation equation is separate from the other equa- tions. 'Ib account for the coupling between heat and mass transfer, the heat flux caused by mass transfer is calculated in a n approximate manner for each time step. This simplified calculation is permissible because, in applying later calculations over a wide range of tempera- tures (140-320 K), the maximum mass transfer contribution to heat transfer was found to be less than 6% of the total heat transfer in PUR slabs.
2.1 Temperature Distribution
A one-dimensional energy conservation equation can be expressed in a finite difference form [41 as:
TI" - T; 1
C~~
At L(~:f: - 2T:+'+
T:::)+
- 2 (T:-, - 2 T :+
Tz.)where indices n and i relate to steps in time and space (layer number), respectively; T is temperature (K); Ax is the distance between two adjacent positions in space (space step) (m); At is the time step used for calculations (s);
Cp
is the specific heat of the foam as the whole (J/kg-K);e
is density (kg/m3); and X is the thermal conductivity of the foam (W1m.K). Equation (1) gives the temperature a t each node a t time n+
1, using the values of X and T from the previous time step.2.2 Gas Pressure Distribution
i
The one-dimensional mass conservation equations are written in a finite difference form and relate to the partial pressure of each compo-
]
nent. The equations for partial pressure of oxygen, nitrogen, and CFC Itake the form:
where indices n and i relate to steps in time and space, respectively. P
is the partial pressure of a gas (Pa); D is the effective d f i s i v i t y of the foam (cmz/s), Ax is the distance between two adjacent position in space (space step) and At is the time step used for calculations.
A Model of Aging fir Gas-Filled Cellular Plastics 331
The effective diffision coefficient for each layer is assumed to be con- stant and independent of concentration for a given gas. Moreover, to simplify calculations [I], one may assume a constant ratio between ox- ygen and nitrogen diffusion. In this work the effective diffusion coefficient for oxygen is assumed to be six times higher than the nitro- gen diffusion coefficient [4,8,91.
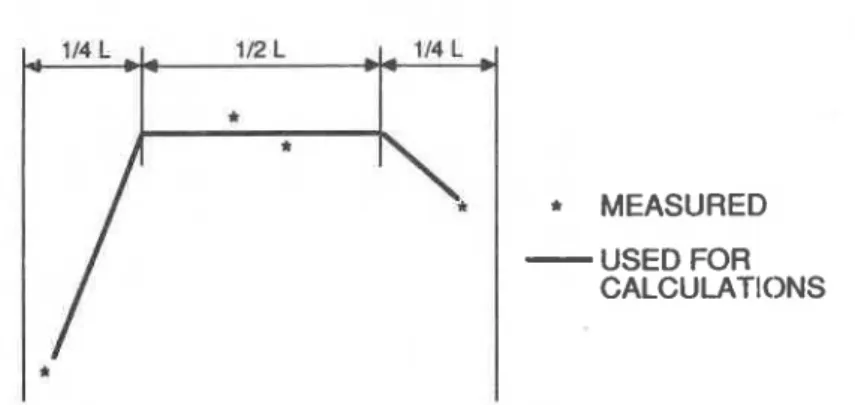
The model allows the effective diffusion coefficients to vary in the cross-section of the foam. Nitrogen diffusion was estimated for each surface layer and for the middle of the material. The calculation assumed:
1. Effective nitrogen diffusion coefficient for the middle (i.e., one half material thickness) may be taken as the average of two estimates of core material; a linear transition is then applied between this level and those a t each surface (Figure 1).
2. The effective CFC diffision coefficient is assumed to vary across the material in the same manner as the effective nitrogen coefficient. Equation (2) gives the pressure changes caused by diffision through the foam. For CFC gas, however, one must also consider another phe- nomenon affecting pressure changes: condensation or evaporation of CFC. Thus, CFC pressure calculated with Equation (2) will be corrected for phase changes.
2.3 Correcting Partial Pressure for Condensation of CFC
If the partial pressure of CFC exceeds the vapour-liquid equilibrium pressure for a given temperature, condensation will occur. The equi-
MEASURED
-
USED FOR CALCULATIONSI
*
I
Figure 1. Measured and assumed variation of effective diffision coefficients across slab thickness.
librium pressure of CFC is calculated from a n appropriate form of Clapeyron's equation [lo]
PAT) = 101325.0 exp
(
Coi b T b )
where p, is the equilibrium partial pressure of CFC in Pa; T is the tem- perature in K; Tb is the normal boiling temperature (at one atmo- sphere); and Co = 10.0. Compared with the process of diffusion through the polymeric material of cell-walls, the process of phase change may be considered instantaneous. Thus, the model assumes that vapour pressure above the condensed CFC is always in equilib- rium. If the actual CFC pressure calculated from Equation (2) exceeds the equilibrium pressure, CFC will condense until equilibrium pres- sure is reached. Conversely, if there is liquid CFC and the CFC partial , pressure is below that calculated from Equation (3), a n evaporation of CFC will continue until the actual pressure reaches a n equilibrium pressure.2.4 Thermal Conductivity of Foam
Thermal conductivity of the foam is calculated from the equation introduced by Schuetz and Glicksman [31:
where A, is thermal conductivity of a gas mixture (W1m.K); f , is the fraction of struts in the foam; 6 is the foam porosity; a is the Steffan- Boltzman constant 5.67 x W/(m2K4); K is the mass extinction coefficient (m2/kg); T,,, is the mean temperature of the foam layer (K). Some of the parameters used in Equation (4) were modified, namely: 1. The coefficient of thermal conductivity of a gas mixture, A,, is calculated from the equations developed by Mason and Saxena [ I l l for a mixture of polyatomic gases;
A Model of Aging fir Gas-Filled Cellular Plastics 333 where
- - - -- -
Gjk = 0.3765 [ I
+
(MilMk)l-"' [l+
N'Az)"' (M,JMk)'1412 @?A:) = (7liMJ~kMi)f;: = mole fraction of ith component Mi = molecular weight of ith component
Xi, qi = thermal conductivity and dynamic viscosity of ith com- ponent
Properties of each gas such as thermal conductivity and viscosity, taken from handbooks and general property tables [12,131 were expressed a s linear functions of temperature. Two temperature ranges were used: construction applications (240-340 K), cryogenic applications (170-240 K).
2. Instead of the extinction coefficient, a mass extinction coefficient (i.e., the former divided by density of the foam) is used. It does not include the effects of porosity variation and provides better means of polymer characterization. Moreover, if a broad range of tempera- tures is examined, the mass extinction coefficient is approximated by linear temperature dependence [141:
- -
- -- . -
K = KO
+
C(T - 273.2) (6)where KO is the extinction coefficient a t 0°C and C is the tempera- ture dependence of the extinction coefficient.
Having calculated thermal conductivity of each of n layers, Xi, one may calculate thermal resistance of the slab
where hi is the thickness of each layer. If a particular temperature dif- ference, AT, is imposed on the slab, the heat flux under steady-state conditions becomes
-
The heat flux calculated from Equation (8) does not include the effect of mass transfer.
2.5 Heat Flux Approximation for
Evaporation, Diffision, and Condensation of CFC
In addition to affecting thermal conductivity of cell-gas by modifying its composition, the phase change of CFC affects heat flux by extracting I or releasing heat. An appropriate method of calculating a limiting case of heat flux due to latent heat release or extraction is introduced below. This heat flux is assumed to be the product of two components: !
1. Maximum amount of latent heat transfer under the effect of actual boundary conditions, assuming that all CFC is on the hot side, dif- fused, and condensed on the cold side of each pore
2. Reduction of the efficiency of the liquid flow rate to return the con- densed CFC to the hot side of the cell if only a part of CFC is con- densed
Component 1: A maximum heat flux caused by diffusion of CFC through the cell gas,
&,
under conditions imposed by the boundary sur- faces is calculated. It is assumed that air diffusion in the foam is already complete and that the whole mass of CFC evaporates, diffuses, and condenses, and then is transferred in the opposite direction by the liquid flow. It may be calculated from the following equation:where He, is the latent heat of CFC evaporation, D; is the coefficient of CFC diffusion in air, R is the gas constant, L is the thickness of the slab, P1 and P, are the saturation partial pressures a t respective sur- faces, and TI and T2 are temperatures.
Component 2: This component describes the reduction of the efficiency of the liquid flow rate that returns condensed CFC to the hot side of the cell in relation to degree of saturation with liquid CFC. It may be calculated as follows:
where Sf is the degree of saturation with liquid CFC. This degree of sat- uration is assumed to be 1 when all fluorocarbon initially introduced to the foam is condensed. Equation (10) is derived from study of the relative permeability of the wetting phase a s a function of degree of sat- uration [15-171.
A Model of Aging for Gas-Filled Cellular Plastics 335 The heat flux caused by evaporation, diffusion, and condensation of CFC may be calculated as:
Thus heat flux caused by evaporation, diffusion, and condensation
can be calculated from Equation (11) and added to the heat flux
calculated from Equation (8). This aggregate heat flux may then be
used to compare results of calculations with actual measurements. 3. METHOD
3.1 Input: Material Characteristics and Initial and Boundary Conditions
To solve a set of differential equations such as Equation (1) and Equa-
tion (2) one must define boundary and initial conditions. While the boundary conditions (temperature and pressure of oxygen, nitrogen, and CFC in the environment) are known, this is not the case for the initial conditions of cell-gas composition.
CFC partial pressure, equal to approximately one atmosphere during the foaming process, is reduced owing to two phenomena:
1. Foam cools from the high temperature caused by exothermic reac-
tion.
2. Part of CFC gas enters and saturates the polymer matrix.
As has been indicated [I], variability in the CFC solubility of dif- ferent polymers coupled with large differences in the initial CFC pres- sure caused by cooling of foam makes it necessary to determine initial
partial CFC pressure for each GFCP tested.
-
Equation (2) requires values for effective nitrogen and CFC diffusion coefficients. One possible method of determination is as follows. Several thin layers 40-80 mean cell-diameters thick are cut from different loca- tions in the cross-section of the foam and placed in a Heat Flow Meter
(HFM) apparatus immediately after slicing. Their thermal resistivity
is continuously recorded over a 10- to 14-day period. The layers are then stored in the laboratory and periodically tested to determine the pla- teau stage of the R-value. %sting continues a t less frequent intervals for several months. Thermal resistance changes in these thin speci- mens and the model of aging provide the effective diffusion coefficients. Diffision of air components is calculated from the first stage of aging
(thermal drift) and diffusion of CFC is calculated from the second stage (plateau stage).
Calculation of the effective diffusion coefficients is as precise as the measurement of changes in the thermal resistivity of the specimen will permit. No additional assumptions are introduced. All three gas trans- fer processes are calculated under temperatures and temperature gra- dients used during the laboratory measurement of thermal resistivity. The calculations are performed for small steps in time and space (space increments do not exceed usually ten cell layers). For example, in cal- culating oxygen and nitrogen coefficients one assumes a specific value of CFC diffusion coefficient. If the difference between assumed and esti- mated (from another experiment) CFC diffusion coefficients affects the results of the first calculation, the calculation of nitrogen and oxygen diffusion is repeated, using a modified value of CFC diffusion.
While effective diffusion coefficients may be estimated with a high degree of confidence, this is not possible for initial CFC pressure in the GFCP. It is the most questionable element of the input data. In the present work initial pressure of CFC was estimated by two methods: chemical analyses and thermal conductivity measurements. The chem- ical analysis involved determining chlorine content twice: on undisturbed foam, and after rushing the foam and off-gasing the polymer powder (using a few hours' exposure to both vacuum and increase temperature). Assuming limited losses of CFC (either none or a known amount of chlorine included as the fire retardant agent), the fraction of gaseous CFC was calculated and used in the estimate of the initial CFC pressure. Large scatter of experimental results, uncer- tainty in content of chlorine in the added fire retardants, possible loss of CFC from surfaces of specimens caused low reliability of the chem- ical analysis. This method was used only for control purposes.
Initial CFC pressure was primarily estimated from the measured thermal resistivity a t the end of thermal drift-beginning of the pla- teau aging stage. If other components of thermal conductivity (e.g., radiation and solid conduction) are known, one may estimate the molar fraction of a CFC gas in the cell-gas using the difference between them and the measured total conductivity of the foam. If there is only one type of CFC and if pressure of nitrogen and oxygen can be assumed equal to the atmospheric pressure (thin material layer a t the beginning of plateau region), then one may estimate the "projected initial" CFC pressure.
Other input material characteristics are:
A Model of Aging fir Gas-Filled Cellular Plastics 337
2. Fraction of struts and polymer thermal conductivity coefficient, either determined from a microscopic examination or estimated from the literature.
3.2 Method of Solving Equations
Analytic solutions exist for a number
of
simple isothermal cases. Topermit calculations in more complex cases, ag., involving phase change of CFC, one must use a numeric solution. A s the transport coefficients in Equations (1) and (2) are nonlinear, use of a n average temperature for each layer may cause errors in the calculated pressures of oxygen, nitrogen, and CFC. To establish the magnitude of the errors, a compari- son of the analytic and numeric solutions was made for a 40-mm thick, polyurethane slab aged at constant ambient temperature. As the analytic solution of Crank [I81 is valid for long-term diffusion only, the discrepancy expected in the initial period of diffusion will not be ana- lysed. The numeric calculations were performed by changing both the number of layers and the locations of the nodes, which were placed either in the centre of each layer or a t the interface
of
two adjacent layers.Equations (1) and (2) used a central difference formula, a version of the finite difference method of Ostrogorsky and Glicksmann 141, and
-
2.8
0
a
ANALYTIC: SOLUTION9 EQUlDlSTANT HOOES
2.7
a
9 MASS CENTRE NOMSY @ 15MASSCENTRENOOES E- 2.0 W 0
=
t.5$
3
2.4 (L3
2.3 (L y e.2 I- 2.1 2.0 Q 180 33 TIME, daysFigure 2. Comparison of analytic solution of Crank [18] with numerical solutions for 9 and 15 layers. Nodes placed a t intersections (equidistant) or i n the centre of each layer.
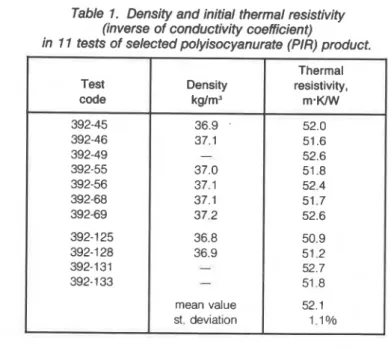
Table 1. Density and initial thermal resistivity (inverse of conductivity coefficient)
in 11 tests of selected polyisocyanurate (PIR) product.
Thermal
Test Density resistivity,
code kglm3
,
m . W 392-45 36.9 . 52.0 392-46 37.1 51.6 392-49 - 52.6 392-55 37.0 51.8 392-56 37.1 52.4 392-68 37.1 51.7 392-69 37,2 52.6 392-1 25 36.8 50.9 392-1 28 36.9 51.2 392-131 - 52.7 392- 1 33 - 51 -8 mean value 52.1 st. deviation 1 .I 010were solved with a n implicit scheme by the matrix inversion technique used by Kumaran and Mitalas [191.
Figure 2 illustrates that a large number of nodal points are necessary if the numeric solution is to agree with the analytic solution. Either fifteen layers with points a t the intersections, or nine layers with points a t the centre of each layer were found to be necessary. These calcula- tions were also performed with different time steps to ensure that the choice of time step did not affect precision.
4. COMPARISON OF MEASURED AND CALCULATED
THERMAL RESISTANCE 4.1 Input Data
Material characteristics of a selected polyisocyanurate (PIN foam were measured a t NRCC. This material was selected because of its small spatial variability as shown in 'lhble 1, displaying initial ther- mal resistivity values of different specimens taken from the same batch. Measurements of attenuation of infrared radiation versus thick- ness of material gave a mass extinction coefficient of 42 m2/kg.
Thermal resistance of a 6-mm thick core layer of PIR at an initial stage of aging was used to estimate the effective nitrogen diffusion
n
--
+
CALCULATED MEASURED0 50 150 200 250
350
TIME, h
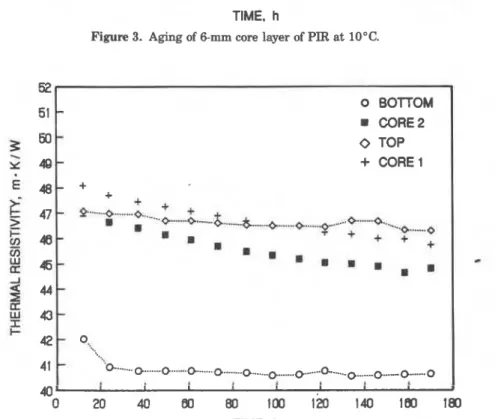
Figure 3. Aging of 6-mm core layer of PIR at 10°C.
52 0 BOrrOM 51
-
CORE2 9 50- 0 TOPh
a -
+
CORE 1+
+
++
1 • a-+--&-.-.& -... a-..-+..-o--...+-+-. I- -r + + + 9--0 + E? 48- V]-
E
6 -3
44- a: w 43-
x+
42-
o... 41-
'G ... 0 ... 0 ... 0 ... 0 ... 0 ...O-... ...* O...""O .-... 0 40- 1 I I 1 I I I 1 0 20 40 80 80 100 120 140 180 180 TIME, hFigure 4. Aging of 6-mm layers cut from year-old PIR. Both storage and laboratory aging
coefficient, at the same time assuming a value of CFC diffusion coeffi- cient from the literature [4,5]. A number of calculations were per- formed with different values of nitrogen diffusion coefficient, and the calculation giving the thermal resistivity curve closest to the measured one was selected. Figure 3 shows thermal resistivity mea- sured a t a mean temperature of 10°C over a period of 13 days and calculations performed with nitrogen diffusion coefficient of 0.2
x
lo-' cm2/s. The effective nitrogen diffusion coefficient was then adjusted to 60°C (temperature a t which the long-term laboratory aging was per- formed).Thermal resistance measurements were repeated on the same batch of PIR product one year later. This time a number of thin slices were cut from the centre of the board and from the layers adjacent to the board surface. Three or four slices were placed together in a stack and measured simultaneously in the HFM apparatus. Figure 4 shows the results of thermal resistivity measurements performed on four slices a t a mean temperature of 24°C. These indicate unexpected and signifi- cant variability in the cross-section of the slab. As the specimens were cut from approximately 15 month old foam, the material layers exposed to air were expected to be at the plateau stage. Indeed, one of the sur- faces (denoted as bottom) does show thermal resistivity a t the plateau stage (41-42 rn-WW), but the other surface layer maintained a high
tE- a MEASURED B
.
5 8 - CALCULATED Y 64L E %*..- ' -.-,- .--.
--.v--"~-=:,.=~-.. W P.:&-(.....
..:%. =.L.:.s'r- l'ri'll..P.P.P..--,
.
I I- 38- TIME, daysI
A Model of Aging fir Gas-Filled Cellular Plastics I I 182: m MEASURED I CALCULATED 3 56J..
+
TEST START Y Ec
2 ..A w I- '..g
5 0 - 'x.. W *.. a.
'.., .-
.._ ;i.
I......
.
-. .._5
@-.-.
._ .._.
w -.---.-.
--, -- W I.
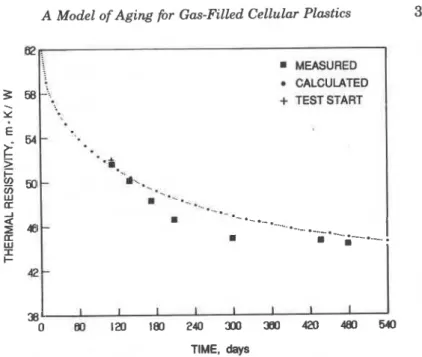
' I- 4- 38 I I I I 1 I 1 I 0 ~ 1 2 O l e O 2 4 0 ~ 3 8 0 4 2 0 ~ ~ TIME, daysFigure 6. Measurements and calculations of full-thickness aging of PIR at 60°C.
thermal resistivity. It is evident that this top layer has a much higher resistance to gas diffusion than the bottom layer.
Comparing calculations to the measurements shown in Figure 4, the
effective nitrogen diffusion coefficients were estimated as 0.3 x
cm2/s and 0.15
x
lo-' cm2/s for respective surfaces. (Nitrogen diffusioncoefficient was estimated at 0.2
x
lo-' cm2/s for the core material.) Theliterature [4,5,8,18,201 also reports large variations in nitrogen diffu-
sion determined on different PUR specimens.
Figure 5 shows thermal resistivity measured and calculated a t 60°C.
(A number of calculations were performed with different values of CFG
diffusion coefficient and the calculation giving thermal resistivity
curve closest to that measured was selected.) Effective CFC diffusion
for the core of the foam was estimated a t 0.1 x cm2/s.
4.2 Thermal Resistance of PIR as a Function of Time
Having determined the material characteristics required as input, the output of the model (thermal resistance of the full board as a func- tion of time) was compared with measured values. The period of mate- rial aging prior to testing must first be estimated. From the initial con-
was calculated (using the model) that it takes 110 days a t warehouse conditions to reach a thermal resistivity of 51.6 m.K/W, which was determined on the f i s t day of the laboratory measurements. A vertical line a t 110 days divides the period of initial aging from measurements performed in the laboratory (Figure 6). The largest difference between calculated and measured thermal resistivity is 4%, which is acceptable for the intended use of the model.
4.3 Thermal Resistance of PUR as a Function of lkmperature
The model permits calculation of thermal resistance as a function of temperature. This is a n important feature, particularly when long- term thermal resistance of GFCP is to be determined a t different tem- peratures. While excellent data on the effect of temperature on thermal conductivity of GFCP exists, lack of characterization of the materials prohibited a direct calculation with the model. Another approach was used.
Thermal conductivity as a function of specimen mean temperature was measured a t the National Bureau of Standards (NBS) by Sparks and Arvidson [211 and a t the Padova University by Bigolaro et al. [221 on 32 kg/m3 aged polyurethane foam. Assuming that both materials reached the plateau stage, and taking one of the material characteris- tics from the literature (e.g., Oak Ridge National Laboratory communi- cation, May 1986), a mass extinction coefficient of 55 m2/kg was taken for the NBS material. Performing calculations with different values of
initial CFC concentrations, a CFC concentration was selected for which
the R-value agreed with the measured R-value a t 24°C. The question remains, however, whether a model calculation of R-value for other temperatures will be corroborated by measurements.
Figure 7 shows the thermal conductivity of the material tested a t NBS calculated in two ways: (1) with a constant mass extinction coeffi-
cient KO = 55 m2/kg, and (2) with a linearly temperature-dependent
mass extinction coefficient identical to that determined for air-filled
polystyrene [KO = 55 m2/kg and C = 0.27 m2/kg "C, Equation (6)l. In
both cases, Figure 7 shows acceptable agreement between calculated and measured values of thermal conductivity as a function of tempera- ture.
For the material tested at Padova University (Figure 81, CFC pres- sure was assumed to be 50 kPa (10% less than that calculated for the NBS material). Inserting this value into the model to match a mea- sured thermal resistivity a t 24"C, the mass extinction coefficient was 28 m2/kg. Agreement in Figure 8 is also acceptable.
r MASURED a3
-
a CALCUIATED C-
0.27 CALCULRTED C-
0.0 20 - 24 -n -
18" Ii
TEMPERATURE, KFigure 7. Calculated thermal conductivity of PUR measured at NBS [211.
32 A calculated a meaeurcd 30 - 28
-
4
A A A & A A A A i 20-
A 3 A A* A %
24 - A i A !a A 22 - A A !am -
A 18 - I8 1 I 140 180 180 200 220 240 280 280 300 320 Tenperoture. KM. BOMBERG
5. DISCUSSION
To calculate the thermal resistance of a product one must select rep- resentative effective diffusion coefficients. This issue requires more detailed discussion.
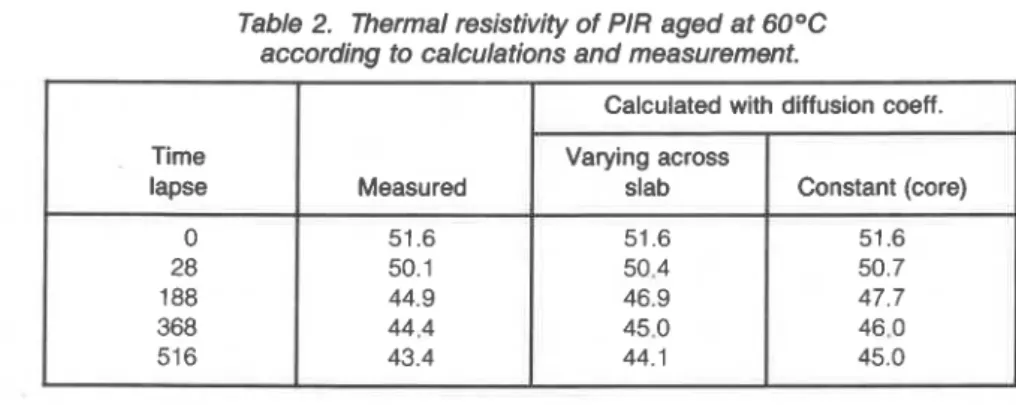
A difference in the level of thermal resistivity and rate of aging for specimens cut from different locations in the material cross-section are important (Figure 3). lhble 2 shows thermal resistivity values using two approaches:
1. Disregarding spatial variability of the material and using constant diffusion coefficient of the core (D core)
2. Including the variation of the diffusion
Agreement of experimental results from the laboratory and calcula- tions based on variable D is acceptable. For the calculation based on constant D, i.a, the core diffusion alone, agreement is not that good. Thus, if the diffusion coefficient is determined correctly, calculated and measured thermal resistivity values show better agreement.
Figure 4 shows significant variability in thermal resistivity of the foam layers. Although similar variability has been observed in sprayed PUR specimens such variability has not been observed in the PUR boards. It is important to emphasize that the results shown in Figure 4 relate only to a specific batch of the GFCP products.
Much more work must be done to establish the usefulness of the model. It should include improvement in methods of determining the material characteristics needed as input to the model, experiments with aging of other types of GFCP with either CFC or HCFC captive blowing agents (particularly if more than one is used), the statistical significance of various elements of product batch, board and cross-
Table 2. Thermal resistivity of PIR aged at 60°C according to calculations and measurement.
Calculated with diffusion coeff.
Time Varying across
lapse Measured slab Constant (core)
51.6 51.6
A Model of Aging fir Gas-Filled Cellular Plastics 345
sectional variability. The thrust of this paper is simply to report the concept and to point out the key elements of future research.
6. CONCLUSIONS
A model developed to calculate changes in thermal resistance of GFCP slab a s a function of time and temperature incorporates the effect of phase changes (condensation and evaporation) within the CFC and use of diffusion coefficients varying in the cross-section of the GFF slab.
The model has been used to calculate aging of PIR foam for which material characteristics and laboratory aging had been determined in the NRCC laboratory. As well, calculations were performed for PUR tested a t NBS or Padova University, for which material characteristics were partly assumed and partly calculated when applying the model to the measured thermal resistance.
The following conclusions can be drawn fi-om this work:
1. Thermal conductivity as a function of specimen mean temperature, calculated from the model, agrees well with the thermal conductiv- ity of CFC-11 blown PUR boards measured by NBS [211 or Padova University [221 over cryogenic to ambient temperatures.
2. Acceptable agreement was obtained for thermal conductivity as a function of time when the effective diffision coefficients of PIR board were carefully estimated. Selection of the effective diffusion coefficients, however, requires further investigation.
3. Comparison of calculated and measured thermal conductivity in relation to either temperature or time for PUR/PIR products indicates that this model may become a good complement to
experimental evaluation of aging.
-
ACKNOWLEDGEMENTS
The author wishes to express deep gratitude to colleagues a t NRCC: Dr. M. K. Kumaran and Dr. N. V. Schwartz, both of whom patiently helped to define material characteristics and develop data for gas equa- tions; Mr. R. G. Marchand and Mr. J. G. Theriault, who built all the instruments and performed all measurements; Mr. A. Gray (co-op student) who wrote some computer codes.
Thanks are due also to Dr. S. Berman, Mr. M. E. Bednas, and Mr. V. Clancy, Division of Chemistry, NRCC, for determination of CFC solu- bility and cell-gas composition; to Dr. N. L. Rowell, Division of Physics,
NRCC, for determination of the extinction coefficient of PUR and PIR
foams.
In addition, and most importantly, two researchers from industry are to be thanked for their interest and encouragement during this work: Dr. Keith Linger, Fiberglas Canada Inc, and Dr. Sunil Vidarthi, Build- ing Products of Canada.
REFERENCES
1. Bomberg, M. and D. A. Brandreth. "Evaluation of Long-%rm Thermal Resistance of Gas-Filled Foams-A State-of-theArt:' ASTM Conference: Insulation Materials, Testing and Applications, Bal Harbour, to be pub- lished a s STP of ASTM (Dec. 6-9, 1987).
2. Norton, F. J. J of Cellular Plastics, pp. 23-37 (Jan. 1967).
3. Schuetz, M. A. and L. R. Glicksman. "A Basic Study of Heat Transfer Through Foam Insulation," 6th Znt. Polyurethane Conference, San Diego, CA., pp. 341-347 (1983); also Advances of Foam Aging, Vol. 1. D. A. Bran- dreth (ed.), Yorklyn, CAISSA editions (1986).
4. Ostrogorsky, A. G. and L. R. Glicksman. Aging of Polyurethane Foams, ths Influence of Gas Diffusion on Thermal Conductivity. ORNLlSUBl84- 900912, pp. 1-98 (1986).
5. Glicksman, L. R., A. G. Ostrogorsky and S Chiapetta. Effective Conductiv- ity of Aging Polyurethane Foam. ORNLlSUBl84-900911, pp. 1-56 (1986). 6. Reitz, D. W. "Heat Transfer and Aging of Closed-Cell Foam Insulation,"
Advances in Foam Aging, Vol. 1. D. A. Brandreth (ed.), Yorklyn, DE:CAISSA editions, pp. 110-130 (1986).
7. Siegel, R. and J. R. Howell. Thermal Radiation Heat Transfer McGraw- Hill Book C a (1972).
8. Brandreth, D. A. and H. G. Ingersoll. European J of Cellular Plastics, 3:134-143 (1980); also Advances in Foam Aging, Vol. 1. D. A. Brandreth (ed.), Yorklyn, CAISSA editions (1986).
9. Norton, F. J. J. of Cellular Plastics, pp. 200-318 (Sept./Oct. 1982). 10. McGlashan, M. L. Chemical Thermodynamics. London:Academic Press
Inc., p. 128 (1979).
11. Mason, E. A. and S. C. Saxena. Physics of Fluids, Vol. 1. p. 361 (1958). 12. Handbook of Chemistry and Physics. 38th ed. Chemical Rubber Publ. Co.
(1956).
13. "Freon" Fluorocarbons, Properties a n d Applications, Bulletin G-1 DuPont. 14. Reiss, H. and B. Ziegenbein. "Temperature-Dependent Extinction Coeffi- cient and Solid Thermal Conductivities of Glass Fibre Insulations," Ther- mal Conductivity 18. Plenum Press, pp. 4 1 2 4 2 4 (1985).
15. Irmay, S. Trans. Amel: Geophys. Un., 35(3):463-467 (1954).
16. Brooks, R. H. and A. T. Corey. J Zrrig. Drain., Div. Am. Soc Civ. Engrs., IR2:61-88 (1966).
A Model of Aging fir Gas-Filled Cellular Plastics 347
Closed Porous System, Ph.D. Thesis at Imp. College of Science and Tech.,
U. of London, pp. 1-224 (1972); see also Palosaari, S. M. and A. R. H.
Cornish. Acta Polytechnica Scandinavica Helsinki, Chapters 125,126 and 128 (1972).
18. Crank, J. The Mathematics of Diffusion. 0xford:Clarendon Press (1975). 19. Kumaran, M. K. and G. P. Mitalas. "Analysis of Simultaneous Heat and
Moisture Transport Through Glass Fibre Insulation," ASMElAIChE 1987 Nat. Heat Transfer Conf., Pittsburgh (Aug. 9-12, 1987).
20. Brandreth, D. A. J of Thermal Insulation, 5:31-39 (July 1981).
21. Sparks, L. L. and J. M. Arvidson. Journal of Thermal Insulation, 8:198-231 (Jan. 1985). (Data taken from original report of NBS No. GRI- 8410086.)
22. Bigolaro, G., F. De Ponte and E. Fornasieri. "Thermal Conductivity of Polyurethane a t Low Temperatures," manuscript from Padova University, pp. 1-9, published in Proceedings oflnt. Institute of Refrigeration, Commis- sion B1, Washington, D.C., pp. 14-17 (1976).
BIOGRAPHY
Mark Bomberg
Mark Bomberg, senior research officer a t the National Research Council, is a member of Committees C-16 on Thermal Insulation and E-6 on Performance of Building Constructions. Bomberg was born and educated in Warsaw, Poland. He obtained a n M.Sc. in civil engineering, and a D.Sc. at the Warsaw Institute of Technology. Between 1967 and 1975, Bomberg worked at the Division of Building Technology, Lund Institute of 'Ikhnology. He then emigrated to Canada, joining the National Research Council of Canada in Saskatoon and later in Ottawa. He is responsible for the development of test methods for test- ing thermal insulation.
'This p a p e r i s b e i n g d i s t r i b u t e d i n r e p r i n t forin by t h e I n s t t t r ~ t e f o r R e s e a r c h i n C o n s t r u c t i o n . A l i s t of b u i l d i n g p r a c t i c e a n d r e s e a r c h p u b l i c a t i o n s a v a i l a b l e from t h e I n s t i t u t e may b e o b t a i n e d by w r i t i n g t o t h e P u b l i c a t i o n s S e c t i o n , I n s t i t u t e f o r R e s e a r c h i n C o n s t r u c t i o n , N a t i o n a l R e s e a r c h C o u n c i l o f C a n a d a , O t t a w a , O n t a r i o , KlA 0R6.
Ce documerlt est d i s t r i b d s o u s focvne d e
t i r 6 - 3 - p a r t par 1
![Figure 2. Comparison of analytic solution of Crank [18] with numerical solutions for 9 and 15 layers](https://thumb-eu.123doks.com/thumbv2/123doknet/14276566.491074/14.619.104.534.550.831/figure-comparison-analytic-solution-crank-numerical-solutions-layers.webp)