Publisher’s version / Version de l'éditeur:
Journal of Power Sources, 129, 2004
READ THESE TERMS AND CONDITIONS CAREFULLY BEFORE USING THIS WEBSITE. https://nrc-publications.canada.ca/eng/copyright
Vous avez des questions? Nous pouvons vous aider. Pour communiquer directement avec un auteur, consultez la première page de la revue dans laquelle son article a été publié afin de trouver ses coordonnées. Si vous n’arrivez pas à les repérer, communiquez avec nous à [email protected].
Questions? Contact the NRC Publications Archive team at
[email protected]. If you wish to email the authors directly, please see the first page of the publication for their contact information.
NRC Publications Archive
Archives des publications du CNRC
This publication could be one of several versions: author’s original, accepted manuscript or the publisher’s version. / La version de cette publication peut être l’une des suivantes : la version prépublication de l’auteur, la version acceptée du manuscrit ou la version de l’éditeur.
For the publisher’s version, please access the DOI link below./ Pour consulter la version de l’éditeur, utilisez le lien DOI ci-dessous.
https://doi.org/10.1016/j.jpowsour.2003.11.017
Access and use of this website and the material on it are subject to the Terms and Conditions set forth at
Lithium-ion polymer cells for military applications
Hill, Ian; Andrukaitis, Ed
https://publications-cnrc.canada.ca/fra/droits
L’accès à ce site Web et l’utilisation de son contenu sont assujettis aux conditions présentées dans le site LISEZ CES CONDITIONS ATTENTIVEMENT AVANT D’UTILISER CE SITE WEB.
NRC Publications Record / Notice d'Archives des publications de CNRC:
https://nrc-publications.canada.ca/eng/view/object/?id=93484be6-59ee-47ec-95ab-275219eaf37c https://publications-cnrc.canada.ca/fra/voir/objet/?id=93484be6-59ee-47ec-95ab-275219eaf37c
Lithium-ion polymer cells for military applications
Ian R. Hill
a,∗, Ed E. Andrukaitis
baInstitute for Chemical Process and Environmental Technology, National Research Council of Canada, Ottawa, Ont., Canada K1A 0R6 bDefence Research and Development Branch, National Defence Headquarters, 305 Rideau Street, Ottawa, Ont., Canada K1A 0K2
Abstract
Defence R&D Canada (DRDC) is investigating lithium-ion polymer cells for possible future use in army communications and soldier systems, because of their high specific energy. Military operation requires good performance at −20◦C but the standard commercial lithium-ion polymer cells yield only approximately 30% of their room temperature capacity at this temperature. The standard electrolyte is known to be poorly conducting at −20◦C, so DRDC has been working with a Canadian company to produce a cell containing an electrolyte that gives good low temperature performance. Prototype cells have been built and cycled under various conditions. The performance of these cells and the standard cells is discussed.
© 2003 Elsevier B.V. All rights reserved.
Keywords:Battery; Lithium-ion; Gel-polymer; Low temperature
1. Introduction
Lithium-ion polymer cells are now in commercial pro-duction and their utilisation is likely to expand rapidly. Lithium-ion polymer batteries are a potential replacement for portable sealed nickel–cadmium batteries, which are in widespread use in communications equipment with the Canadian Forces (CF). Although sealed nickel–cadmium batteries are robust and reliable, their future production is in question because of the toxicity of cadmium. A Canadian company, Electrovaya Inc. (previously known as Electrofuel Inc.) manufactures an 11 Ah (nominal) capacity lithium-ion polymer cell, which they market as lithium-ion SuperPolymer. The Electrovaya cells are flat, with dimen-sions of 12.5 cm × 9.5 cm × 0.9 cm and they weigh 230 g. The electrode–electrolyte assembly is contained inside an aluminised plastic pouch. The cells are designed for use with laptop computers and are connected in series to make a flat, 16 V battery that fits underneath the computer. Only individual cells were used in the present work. The cells are rated for charging and discharging at 1.2 A, which is only about the C/10 rate. This low rate is mainly a conse-quence of the electrode materials being highly compacted and, therefore, not very porous. The solid polymer is gel type, with the electrolyte immobilised by pores in the polymer, so it is more conducting than a true solid-state ∗Corresponding author. Tel.: +1-613-996-6814; fax: +1-613-991-2384. E-mail address:[email protected] (I.R. Hill).
electrolyte. The production cells have a very high specific
energy of around 210 Wh kg−1 and an energy density of
450 Wh dm3.
The cells use meso-carbon micro-beads as the negative electrode active material, on a copper foil substrate, plus lithium cobalt oxide for the positive electrode, on an alu-minium substrate. Polyvinylidene fluoride is used as binder in the electrodes and the electrolyte gel is made using
polyethylene oxide. The electrolyte is 1.0 M LiPF6 in 1:1
ethylene carbonate (EC) + ethyl methyl carbonate (EMC), although older cells contained dimethyl carbonate (DMC) instead of EMC. EMC has a lower freezing point than
DMC (−14◦C cf. 3◦C) and yields lower freezing point
electrolytes. The electrolyte also contains 2% of a propri-etary additive that is used to stabilise it. The recommended charging method is a constant current of 1.2 A to a limit of 4.2 V, followed by constant voltage charging until the cur-rent falls to 0.3 A. Discharging is recommended at 1.2 A to a cut-off voltage of 2.75 V. For cycle life studies, we define the life as the number of cycles until the capacity has fallen to 80% of the initial value. However, the cycling experi-ments carried out in this study were continued beyond 80% capacity in most cases, and the number of cycles to 60% capacity is reported for many of the cells. In practice, fresh cells were usually found to have capacities close to 12.0 Ah. The data presented in this report involve cells from several different batches, received over a 2-year period. The cell capacity data, plus the cycle lives, were variable between batches: this was because earlier samples of cells were
0378-7753/$ – see front matter © 2003 Elsevier B.V. All rights reserved. doi:10.1016/j.jpowsour.2003.11.017
hand-assembled in non-ideal conditions during a period when the company was in the process of building a new plant with automated assembly. The cells made at the new plant have proven to have higher capacity and longer cycle life, possibly because of lower moisture contamination.
2. Experimental
Cells that were received for studies were first weighed and their voltage and internal resistance measured. A milliohm-meter operating at 1 kHz was used for the latter. Cycling studies were carried out using an 8-channel Arbin BT2000 that has limits of ±10 A and 40 V. Experiments at reduced temperatures were performed using a Thermotron S-8 envi-ronmental chamber. The majority of cell cycling was carried out at ambient room temperature, so any small perturbations to the capacity during cycling may be attributable to changes in the room temperature. Infrared spectra of gasses were measured in a 10 cm path length cell using a Perkin-Elmer 2000 spectrometer. EV #873753 0 2 4 6 8 10 12 14 0 50 100 150 200 250 300 350 400 450 500 CYCLE NUMBER DISCHARGE CAP. / Ah EV #873755 0 2 4 6 8 10 12 14 0 50 100 150 200 250 300 350 400 450 500 CYCLE NUMBER DISCHARGE CAP. / Ah (A) (B)
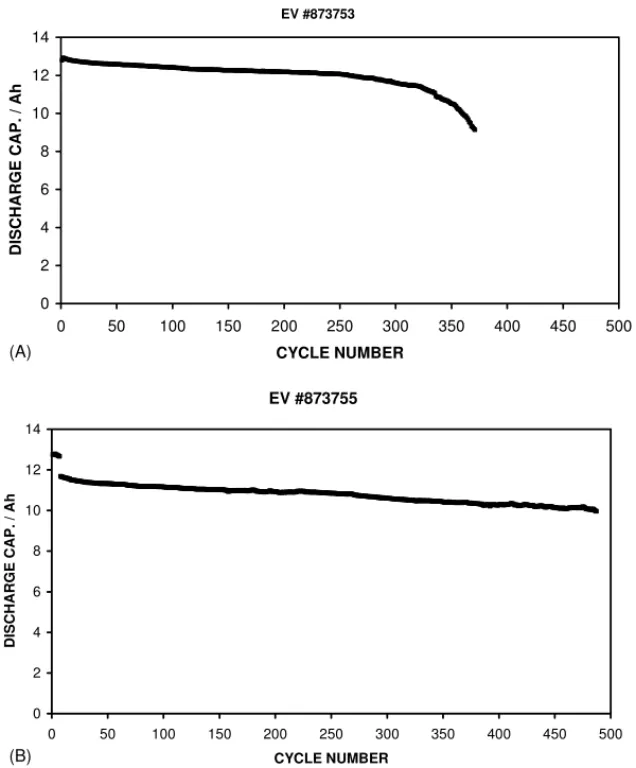
Fig. 1. Comparison of the cycle lives of standard cells cycled at room temperature using 1.2 A. (A) The charging limit was 4.2 V. (B) The charging limit was reduced to 4.1 V after the first seven cycles.
3. Cell cycling results
3.1. Standard production cells 3.1.1. Cycling limits
Cells were normally cycled using the manufacturer’s rec-ommended rate and limits (1.2 A discharging to 2.75 and 1.2 A charging to 4.2 V, then constant 4.2 V to 0.3 A). The older hand-assembled cells were found to have specific
en-ergies in the range of 190–200 Wh kg−1, whilst the
auto-mated production cells (January 2002 onwards) have been in
the range of 204–214 Wh kg−1. The automated production
cells have yielded cycle lives (to 80% of initial capacity) in the region of 250–350 cycles, for full discharges to 2.75 V. The capacity tended to fall away faster after 200–300
cy-cles as degradation increased.Fig. 1Ashows the cycle life
data of a typical cell from the automated production line, which was cycled only at room temperature, using the rec-ommended parameters. Because there is the possibility that electrolyte degradation may proceed at a low level at 4.2 V, two cells were cycled using a charging limit of 4.1 V, instead
of 4.2 V.Fig. 1Bshows the cycle life data for one of those cells. Note that the cell was charged to 4.2 V during the first seven cycles, in order to establish its capacity, before lower-ing the limit to 4.1 V. For these cells, the available capacity was 8% lower than at 4.2 V, but the cycle life was extended to over 500 cycles (the cells are still cycling) in terms of an end-of-life of 80% of the initial capacity obtained from charging to 4.1 V. In terms of the capacity obtained from
charging to the 4.2 V limit, the cell inFig. 1Byielded 438
cycles to 80% capacity, which translates to approximately
10% more total lifetime capacity than the cell in Fig. 1A
that was charged to 4.2 V. Therefore, from the limited num-ber of samples studied, it appears that the total numnum-ber of ampere-hours that can be extracted from the cells during their lifetime is higher for cells charged to only 4.1 V.
Some other variations on the constant voltage portion of the charging were also investigated for charging at room temperature, such as charging at 4.2 V until the current fell to 0.1 A and also for 6 h at 4.2 V. There was no apparent change in the capacity fade rate from using such extended charging and, because the extra discharge capacity obtained was marginal, the company recommended cut-off of 4.2 V and 0.3 A was maintained.
3.1.2. Low temperature discharging
Most of the cells used in this work were not cycled con-tinuously at room temperature but were subjected to occa-sional discharges at reduced temperatures, at higher currents, or using pulsed currents. Although the Electrovaya cells are only recommended for discharging at 1.2 A, it was found that they could be discharged at 2.5 A at room temperature
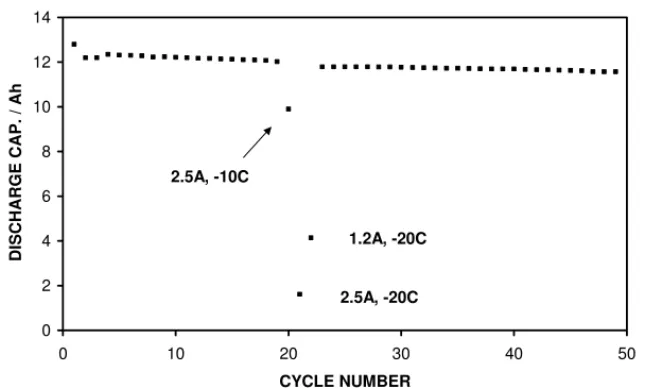
with only a 3% loss in capacity.Fig. 2shows a cell that was
nominally cycling at room temperature using 1.2 A, but was also subjected to discharging at higher currents and lower temperatures. Using a current of 2.5 A, the capacity dropped
to 82% at −10◦C and to 13% at −20◦C (recharging was
EV #873751 0 2 4 6 8 10 12 14 0 10 20 30 40 50 CYCLE NUMBER DISCHARGE CAP. / Ah 2.5A, -10C 2.5A, -20C 1.2A, -20C
Fig. 2. Discharge capacity data for a standard cell being cycled nominally at room temperature using 1.2 A. The data show that the capacity is much reduced at −20◦C, especially at 2.5 A (the recommended discharge current is 1.2 A).
carried out at room temperature). With 1.2 A, the capacity
dropped to 34% at −20◦C. Following these low temperature
discharges the cell capacity recovered to close to the previ-ous room temperature value, with a 2% irreversible loss of capacity. Similar behaviour was also seen with other cells,
although the available capacity at −20◦C and 1.2 A varied
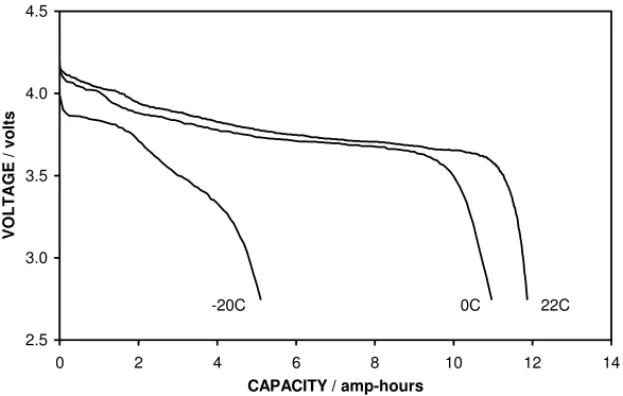
significantly, between 20 and 45%.Fig. 3compares the
volt-age profiles of a cell discharged using 1.2 A at temperatures
of 22, 0 and −20◦C; in this case there was a reduction in
capacity compared with room temperature to 92% at 0◦C
and to 43% at −20◦C. Therefore, the standard cells appear
to be unsuitable for the low temperature applications that are commonplace in the Canadian military.
3.1.3. Pulsed discharging
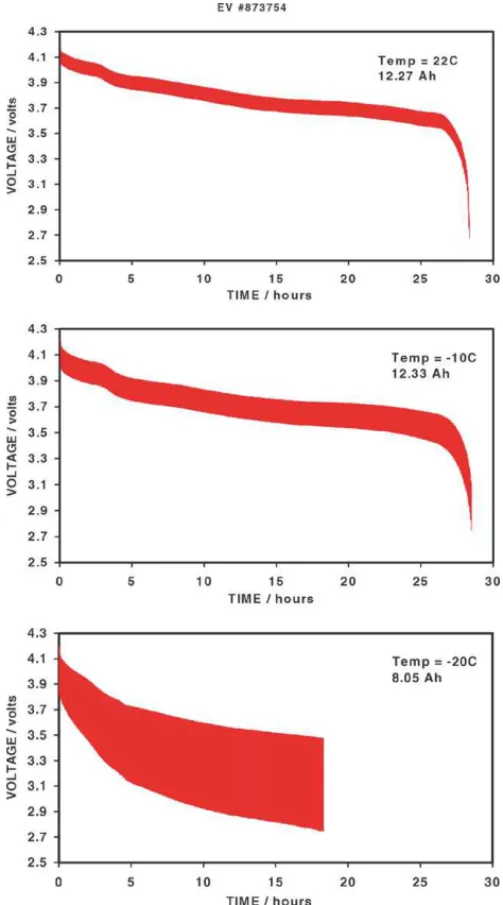
Although the standard cells were not expected to be suit-able for repeated discharging at continuous currents of 2.5 A and higher, the cells were tested for pulsed 2.5 A. High, pulsed currents are encountered in communications radio operation during transmission (TX). Much smaller currents are needed for reception (RX) and, for some radios, standby
mode.Fig. 4compares the discharge curves obtained at 22,
−10 and −20◦C using a duty cycle of 2.5 A for 10 s TX:
0.33 A for 200 s RX. There is very little difference between
the voltage profiles at 22 and −10◦C and the capacity
re-mained the same, whilst there is a large difference between
−10 and −20◦C; in particular a large increase in cell
polar-ization during the 2.5 A pulses. Nevertheless, the fall in
ca-pacity between 22 and −20◦C, to 65%, is smaller for pulse
discharging than for constant current discharging (20–45%), showing that further capacity is available if the cells are given time to recover from the higher current pulses. The experiments were repeated using double the current values: 5 A TX and 0.66 A RX. This did not affect the capacity at
22◦C, but lowered the capacity to 95% at −10◦C and to only
EV #863493 2.5 3.0 3.5 4.0 4.5 0 2 4 6 8 10 12 14 CAPACITY / amp-hours VOL T A GE / vo lts -20C 0C 22C
Fig. 3. A comparison of the discharge curves obtained from a standard cell at room temperature, 0 and −20◦C, using 1.2 A.
at the C/2.5 rate (5 A) down to −10◦C. The same cell was
used for all of these pulse-discharge experiments and this cell still had a cycle life of 250 cycles to 80% of capacity; therefore, the small number of high current discharges that the cell was subjected to did not lead to an obvious drop in cycle life.
3.1.4. Higher rate discharging
Although there was no apparent immediate effect on these lithium-ion polymer cells from using a higher dis-charge current than the recommended value of 1.2 A, it was decided to discharge one cell at 2.4 V repeatedly, while still recharging at 1.2 A. The cell was first cycled at room tem-perature using 1.2 A, then switched to 2.4 A discharging
af-ter 60 cycles. The cell heated up by 5◦C during discharging
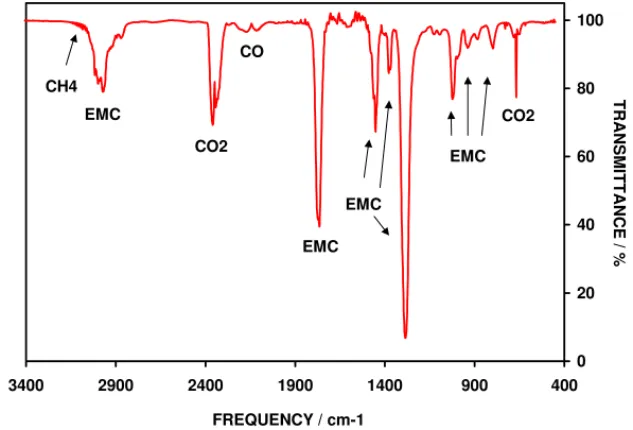
and there was a 1.5% drop in capacity, but the capacity fade rate remained the same. After 50 of these 2.4 A discharges, the fade rate began to increase and it was noticed that the plastic pouch had swelled due to the formation of gas inside the cell. A sample of the gas was extracted from the cell us-ing a syrus-inge and analysed by infrared spectroscopy (which only detects molecules that generate a change in dipole moment during a vibration, so will not detect homonuclear diatomics such as hydrogen). The dominant bands in the
spectrum were identified as arising from EMC and CO2,
plus there were weak bands from CH4and CO, seeFig. 5.
The spectrum cannot be fully interpreted without a detailed quantitative study of the various components, which has not
been done at this time. However, the presence of CO2, CO
and CH4 indicates that decomposition of EMC has taken
place. Ethane should also be a decomposition product of EMC, but the infrared bands of this species would have been obscured by those of EMC, unlike those of methane, which have widely spaced rotational fine structure that stand out over the broader bands of EMC.
Such decomposition products have been reported by other
workers [1]but from electrolyte decomposition that was a
consequence of cell overcharging and thermal runaway. In the present case, the formation of gas was apparently due to using a higher than recommended current during discharg-ing. However, further discharge studies are required in this area before any definite conclusions can be reached.
3.2. Low temperature cells 3.2.1. First batch of cells
Because the standard cells manufactured by Electrovaya do not have an electrolyte that is optimised for low tem-perature operation, work was initiated to develop one. Sev-eral groups have reported on the use of various tertiary and quaternary mixtures of solvents in electrolytes for the low temperature operation of lithium-ion batteries. These
mix-tures usually employ LiPF6in different cyclic and aliphatic
(symmetric and asymmetric) alkyl carbonates [2–5]. Ethyl
methyl carbonate has been reported to be particularly useful because it can be used to make very low freezing point
elec-trolytes (−55◦C) that have good conductivity. Electrovaya
consequently developed a low temperature electrolyte and delivered four 11 Ah (nominal capacity) cells to DRDC for study. These cells were hand-assembled in their old facility.
The electrolyte used was 1.2 M LiPF6in 1:1:1 EC + EMC +
diethyl carbonate (DEC), along with 2% of a proprietary additive to stabilise the electrolyte. All four cells were first cycled at room temperature using 1.2 A and yielded between 12.0 and 12.1 Ah. The second discharges were carried out
at −20◦C: two cells were discharged at 1.2 A and yielded
77 and 82% of their room temperature values. This was a big improvement over the 20–45% obtained from the stan-dard cells. The other two cells were discharged at 2.5 A at
−20◦C and yielded 49 and 55% of the room temperature
capacity. All of the cells had 2–3% less capacity on subse-quent room temperature discharges. Two of the four cells were left to cycle to the 80% end-of-life at room tempera-ture only (one each of the cells that had been discharged at
Fig. 4. A comparison of the pulse discharge data for a standard cell being discharged at room temperature, −0 and −20◦C. The duty cycle was 2.5 A for 10 s (TX) and 0.33 A for 200 s (RX), to simulate a communications radio.
1.2 and 2.4 A at −20◦C), while the other two were cycled
at room temperature, with intermittent discharging and full cycles at lower temperatures.
The two cells that were left to cycle only at room tempera-ture completed 204/240 cycles to 80% capacity and 405/460 cycles to 60% capacity. After the 80% end-of-life, the cells
were discharged at −20◦C/1.2 A and yielded 53 and 60%
of their capacity at room temperature; this compares with 77% achieved on the second cycle for one of the cells (the other was discharged at 2.4 A so it cannot be compared), so it would appear that the low temperature performance may be degrading at a faster rate than that at room temperature. This would be expected where degradation leads to higher resistance at the electrode–electrolyte interface and also be-tween electroactive particles in the electrode. Two complete
cycles were also performed at −20◦C and the cells yielded
36 and 43% capacity, so the cells were still amenable to low temperature cycling after 250 cycles. The cycle life of the
cells is shown inFig. 6, where it can be seen that the cells
took two cycles at room temperature to recover from the low temperature cycling. It should be noted that the low temper-ature cycling did not lead to an increase in the capacity fade rate. The fade rate was the same for both cells over the first 175 cycles (0.07% per cycle) but then quadrupled for one of the cells for about 50 cycles, before slowing down again. The second cell had an accelerated fade rate only after 350 cycles. The origins of this increased fade rate have not yet been investigated.
The other two low temperature cells were subjected to much more extensive low temperature cycling. The first 40 cycles were performed mainly at room temperature using
1.2 A, with discharges intermittently carried out at −25◦C
(61 and 66% capacity), −30◦C (34 and 37%) and −40◦C
(3 and 3%). Therefore, the cells still had significant
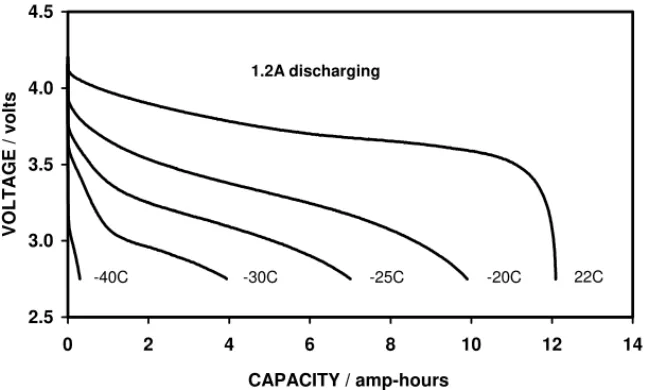
ca-pacity available at −30◦C. Fig. 7compares the discharge
curves at five different temperatures and it can be seen that the running voltage is quite depressed at temperatures
be-low −20◦C. Fig. 8 shows the cycle life data of the two
cells: four complete cycles were performed at −20◦C
be-ginning around cycle 40. InFig. 8A, the first complete cycle
at −20◦C yielded 53% capacity but, on the two subsequent
cycles, this value actually increased, first to 60% then to 66%. Similar behaviour was observed for the other cell and it is interesting that the capacity should rise in this manner. There was no decrease in the cell internal resistance dur-ing this period and the reasons for the increase in capacity are not understood. Following 10 more cycles at room tem-perature, the cells were then subjected to 15 further cycles
at −20◦C. One cell had 7.18 Ah on its first full cycle at
−20◦C, which declined to 6.52 Ah over the 15-cycle period
(9% drop), while the other cell went from 7.61 to 5.74 Ah (a 25% drop). In spite of this variation between the two cells, it is considered that the low temperature cycling performance is good for a solid polymer cell. Upon returning to room
temperature cycling, it was found that the cell in Fig. 8B
had irreversibly lost 16% capacity (relative to its previous room temperature cycle) and its capacity fade rate was now much higher. The other cell had lost 7% of capacity and its fade rate was only slightly increased. Following 10 more cy-cles at room temperature, further cycling was carried out at
−20◦C, which resulted in the same trends in capacity fade
for the two cells. The cell inFig. 8A was relatively stable
at −20◦C for 14 cycles but then had an increased fade rate
at room temperature. This cell delivered 108 cycles to 80% capacity and 176 cycles to 60%, so the prolonged low tem-perature cycling had apparently led to a reduction in cycle life (the two cells that were cycled only at room tempera-ture yielded over 200 cycles to 80% capacity). The cell in
Fig. 8Bcontinued to lose capacity at a high rate and yielded approximately 65 cycles to 80% and approximately 90
0 20 40 60 80 100 400 900 1400 1900 2400 2900 3400 FREQUENCY / cm-1 TRANSMITTANCE / % CH4 EMC CO2 CO EMC EMC EMC CO2
Fig. 5. Infrared spectrum of gas extracted from a cell that had been repeatedly discharged at 2.4 A.
EV #I2881 0 2 4 6 8 10 12 14 0 50 100 150 200 250 300 350 400 450 500 CYCLE NUMBER DI SCHARGE CAP. / Ah -20C, 77% -20C discharge, 60% -20C cycles, 43% RT cycles (A) EV #I2888 0 2 4 6 8 10 12 14 0 50 100 150 200 250 300 350 400 450 500 CYCLE NUMBER DI SCHARGE CAP. / Ah -20C, 2.4A 47% -20C discharge, 53% -20C cycles, 36% RT cycling (B)
EV #I2881 2.5 3.0 3.5 4.0 4.5 0 2 4 6 8 10 12 1 CAPACITY / amp-hours -40C -30C -25C -20C 1.2A discharging 22C 4 VOLTAGE / volts
Fig. 7. A comparison of the discharge curves obtained, at different temperatures, from the first batch of low temperature cells.
EV #I2867 0 2 4 6 8 10 12 14 0 20 40 60 80 100 120 140 160 180 CYCLE NUMBER DISCHARGE CAP. / Ah -20C -25C, 61% -30C, 34% cycling at -20C -40C, 3% 82% 78% EV #I2894 0 2 4 6 8 10 12 14 0 10 20 30 40 50 60 70 80 90 100 110 CYCLE NUMBER DISCHARGE CAP. / Ah -20C, 2.4A 53% -20C, 82% -30C, 37% -25C, 66% -40C, 3% -20C cycling (B) (A)
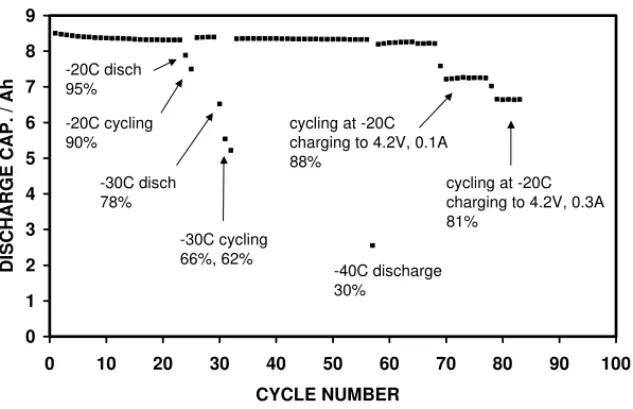
EV #8754 0 1 2 3 4 5 6 7 8 9 0 10 20 30 40 50 60 70 80 90 100 CYCLE NUMBER DISCHARGE CAP. / Ah -20C cycling 90% -30C cycling 66%, 62% -40C discharge 30% -20C disch 95% -30C disch 78% cycling at -20C charging to 4.2V, 0.1A 88% cycling at -20C charging to 4.2V, 0.3A 81%
Fig. 9. Cycle life data from the second batch of low temperature cells.
have exacerbated small differences between the two cells. This could prove problematic for a multicell battery pack, but the present cells were hand-assembled and automated production cells should have more uniform behaviour. This aspect will be borne in mind in the future.
3.2.2. Second batch of cells
A second batch of four low temperature cells is now being investigated. These were assembled as a special small run using automated equipment and were expected to be higher quality than the first batch. These cells have the same chem-ical composition as the first batch, but are thinner and are rated at 8 Ah. Three out of four cells were found to have sim-ilar cycling properties to one another, whilst the fourth cell had a higher capacity fade rate. This cell weighed slightly less than the others and was probably defective during as-sembly, so it will not be discussed.
EV #8754 2.5 3.0 3.5 4.0 4.5 0 1 2 3 4 5 6 7 8 9 10 CAPACITY / amp-hours VOLTAGE / volts -40C -30C -20C 22C
Fig. 10. A comparison of the discharge curves obtained from the second batch of low temperature cells, at different temperatures using 1.2 A.
Fig. 9shows cycle life data typical of the three good cells. Although these cells were lower capacity, they were still cy-cled using 1.2 A (now C/6.6 rate rather than C/10). During recharging at low temperatures, it was noticed that the cur-rent at 4.2 V did not decrease as fast as at room temperature. Therefore, the current cut-off for low temperature charging was extended from 0.3 to 0.1 A. This led to a 7% increase in discharge capacity, albeit increasing the charging time by 3 h. These cells yielded 95% of capacity with discharging
at −20◦C, whilst 90% was obtained following recharging
at −20◦C. This was a major improvement over the first
batch of low temperature cells, which yielded 80% capacity for discharging only and approximately 60% for complete
cycles at −20◦C. After four more cycles at room
temper-ature, the cells were subjected to three complete cycles at
−30◦C. The first discharge yielded between 72 and 78% of
two complete cycles at −30◦C yielded 60–66 and 56–62%
capacity. Again, this was a marked improvement over the previous cells (approximately 35% for discharge only). The capacity fully recovered on subsequent cycles at room tem-perature and, after a further 20 cycles, a discharge was made
at −40◦C: this yielded 24–34% capacity, which compares
with 3% with the previous batch. After about 70 cycles, the
cells were subjected to repeated cycling at −20◦C. Fifteen
cycles have been made so far and the cells have maintained a steady capacity (apart from when the cut-off current for
charging was increased back to 0.3 A from 0.1 A, seeFig. 9).
This contrasts with the first batch of low temperature cells
in which the capacity steadily declined (see Fig. 8) under
the same conditions.
Fig. 10compares the discharge curves obtained from the second batch of cells at four different temperatures. The performance of the cells is seen to be substantially better
than that of the first batch of cells (shown inFig. 7). The
data in Fig. 10 are similar to that reported in Ref.[2] for
lithium-ion cells (non-polymer) in which the electrolyte
used was 1.0 M LiPF6in 1:1:1 EC + EMC + DMC (in the
present work DEC was used in place of DMC). The results obtained from this second batch of cells are very encour-aging and cycling studies are continuing, including low temperature pulsed discharging. Following these studies, safety and abuse testing will be carried out, in particular to determine what measures are necessary to protect these plastic pouch cells from physical and mechanical abuse.
4. Conclusions
Lithium-ion polymer cells of the gel type were found to look promising for military application, provided that they contain an electrolyte that has good low temperature performance. The standard production cells produced by
Electrovaya Inc. were found to have a high specific energy of
around 210 Wh kg−1, plus an energy density of 450 Wh dm3.
The standard cells were found to have a cycle life at room temperature in the region of 250–350 cycles, but the cells
did not have good performance at −20◦C. Substitution of
the electrolyte with 1.2 M LiPF6in 1:1:1 EC + EMC + DEC
led to a substantial increase in performance at low tempera-tures. At the C/10 rate, the low temperature cells have been demonstrated to yield 95% of their room temperature
ca-pacity at −20◦C, 78% at −30◦C, and 30% at −40◦C. The
low temperature cells have also proven to have comparable energy density and cycle life to those of the standard cells. These results are most encouraging and the development of a battery for military applications will continue to be pursued.
Acknowledgements
The authors would like to thank Electrovaya Inc. for pro-viding the cells used in this work and, in particular, Rakesh Bhola for his work in developing the low temperature elec-trolyte. The authors would also like to thank Giulio Torlone of the National Research Council for invaluable technical assistance.
References
[1] E.P. Roth, in: Proceedings of the 40th Power Sources Conference, 2002, p. 44.
[2] M.C. Smart, B.V. Ratnakumar, S. Surampudi, J. Electrochem. Soc. 146 (1999) 486.
[3] E.J. Plichta, W.K. Behl, J. Power Sour. 88 (2000) 192.
[4] M.C. Smart, B.V. Ratnakumar, S. Surampudi, J. Electrochem. Soc. 149 (2002) A361.
[5] Y. Ein-Eli, S.F. McDevitt, R. Laura, J. Electrochem. Soc. 145 (1998) L1.