FOR USE IN PHOTOMETRY
by
Donald Brown Cameron
Submitted in Partial Fulfillment Of the Requirements for the Degree of
BACHELOR OF SCIENCE
From the
MASSACHUSETTS INSTITUTE OF TECHNOLOGY
1941
Signature of the Author
7-,
Signature of ProfessorAcknowledgments
I wish to express my appreciation to Professor A. C. Hardy for his many helpful criticisms and suggestions.
I wish also to express my sincere thanks to
Dr. S. Q. Duntley for his aid during the many hours he spent working with me and also for his numerous helpful suggestions.
I am also very much indebted to the Department of Electrical Engineering for the electrical equipment which was loaned to me.
page Acknowledgments
Introduction
Basic Experimental M ethod 5
Methods of Measuring Modulated Current 8 Detailed Experimental Technique 14
Results 17
Explanation of Results 19
-1-CHAPTER I
Introduction
About two years ago S. Q. Duntley conceived an idea for a new type photometric system-' involving the use of gas filled glow lamps, and reduced it to practice with an experimental model. His method was simple and more
pre-cise than would appear at first glance because all harmonics were eliminated. However, successful operation depended on the characteristics of the lamps. Of these characteristics constancy, reproducibility, and a nearly linear relation be-tween the modulated current input and modulated light output were essential, where here the term "linear relation" is used in a somewhat unusual sense since it refers to the 60 cycle fundamental alone. Since there was no readily available in-formation on these lamps, the author undertook an investiga-tion of their characteristics.
The photometric system, of which one application was a densitometer, used two neon tubes the light from which
entered an integrating sphere. Both lamps were to be sup-plied with the same amount of a unidirectional current upon which was to be superimposed a cyclicly varying current, the
current in one lamp being 180 degrees out of phase with that in the other. The circuit to be employed is shown in figure 1.
If the resistors R, were each about 3000 ohms, the D.C. resistance of the variac could be neglected; and the unidi-rectional current through the lamps would independent of the
Fig. 1. /6LOW LAMPG
S
R,
+-VARIAC
2
setting of the sliding contact B. The resistors R, could then be adjusted to let the same amount of unidirectional current flow through each lamp. Since the two lamps were connected to opposite sides of the variac, the cyclicly varying current in one would be 180 degrees out of phase with that in the other. The light from each lamp would consist of constant glow upon which was superimposed a cyclicly varying glow, and the light in the sphere would be the sum of the light from the two lamps.
If the light intensity entering the sphere from lamp 1 were I: A + L Sin W t, that from lamp 2 would be
I' A C Sin (P t+1Y) , and
I I, + I2 =A t L Sin w t + A + C Sin ('itt-1)
=2A
+- L Sin w t - C Sin W t =2A + (L-C) SinUtor the light in the sphere would consist of a constant glow plus a cyclicly varying glow. If the sliding contact B were
at the center of the variac winding, the amplitude of the cyc-licly varying current would be the same in both tubes, i.e. L = C; and the light in the sphere would consist of a constant glow only. If part of the light from one of the lamps, lamp 1 for instance, were prevented from entering the sphere, as by placing a photographic density in front of the lamp, L would no longer be equal to C; and there would be a flicker in the sphere. The condition of no flicker could be restored by in-creasing the electrical modulation on lamp 1, by dein-creasing the electrical modulation on lamp 2, or by both of these pro-cesses simultaneously, -- where electrical modulation is de-fined as the ratio of the amplitude of the cyclicly varying current to that of the unidirectional current. That is, in figure 2, the electrical modulation equals AC/ 1 .
Fig. 2.
t
Moving the sliding contact B would accomplish just this re-quired change in modulation, for the ratio of the electrical modulation on lamp 1 to that on lamp 2 would be equal to the number of turns in the part SB of the variac divided by the number in the part BH. At least to a first approximation the corresponding ratio of the optical modulation would be equal to that of electrical modulation, and the optical density of
an object placed in front of lamp 1 would be a function of50 The condition of no flicker was determined by plac-ing a phototube at a hole in the integratplac-ing sphere. The phototube was connected to an A.C. amplifier tuned to 60 cycles; and the output of the amplifier was connected to the armature of a universal motor controlling the position of the sliding contact of the variac, Since 60 cycle current from the power mains was used to excite the field of the universal motor, no net torque was exerted by any armature currents
ex-cept those of 60 cycle frequency. Since a reversal of the phase of the amplified phototube current would cause the di-rection of rotation of the motor to change, and since the phase of the phototube current depended on whether L was
greater or less than C, the universal motor could be connected so as to cause the sliding contact to be moved always toward setting for which there was no flicker in the sphere, i.e. toward the point of balance.
The information obtained from the experimental model was very encouraging, and in order to determine the
feasibil-ity of building a highly accurate practical photometric system using these lamps, the author undertook an investigation of the characteristics of gas filled glow lamps. Since the motor mentioned above controlled the balancing of the photometer,
and since such a motor is a highly selective device, affected only by armature currents of the same frequency as its 60 cycle sinusoidal field current, only the 60 cycle fundamental should be considered in the investigation of the lamp characteristics.
-5-CHAPTER II
Basic Experimental Method
The first thing necessary for an investigation of the characteristics of these lamps is some method of
accurate-ly measuring the optical modulation. Fortunateaccurate-ly the pho-tometer from one of Professor Hardy's Recording Spectropho-tometers is admirably suited for this purpose. The second equation on page 307 from Professor Hardy's article "The New Recording Spectrophotometer" 'is:
I - (R, Sin2-c +. R2 Cosh ) -(R, Sinao( - R2Cosi )Cos2w t
where c is the Rochon-Wollaston angle, W
=27x30, and R, and
R2 are the reflectances against which the beams impinge. If we let R,=
R2, then f or some value of o(I R (Sinzo( + Cosas) -(Sin 2o - Cos%() Cos2w t)
::R l (Sin'ZX - Cos I() CosZwt}
Since the photometer is calibrated in terms of transmission and obeys the tangent-squared law that is common to many polar-ization photometers
T
tanao( then t an c( = fi~ Co s o( = ;Sinaoc=----and I=
R l -( T 77 Co0s2tdt or I = R 1 4P
CosZWtpossible to plot a curve of transmission versus fractional modulation and use the photometer as a generator of accurately
known modulated light against which to measure the light from the glow lamp.
If a circuit such as that shown in figure 3 is em-ployed Fig. 3.
LIGHT
FROM
SPECTROPHOTOMETERI
GLOW LAM P D.C.6orv
A.cVARIAC
and if the modulated light from the glow lamp is adjusted, by some means, so that it is 180 degrees out of phase with the light from the spectrophotometer, the modulation of this latter light will be automatically changed by the spectropho-tometer until a condition of no flicker exists in the inte-grating sphere. The optical modulation of the glow lamp is
then equal to that of the photometer beam, and its value can be determined from the transmission reading of the photometer.
The A.C. and the D.C. instruments shown in figure 3 are not necessarily ammeters, but are any electrical circuit used to measure respectively the cyclicly varying and the unidirectional components of the current flowing in the lamp circuit; and from these the electrical modulation may be cal-culated.
Since the currents to be measured are of the order of a few milliamperes, and since an accuracy of one or two
tenths of one percent is desired, the usual engineering methods may be questioned; and a consideration of possible ways of
CHAPTER III
Methods of Measurin Modulated Current
It was shown in the previous chapter that the
measurement of the A.C. and D.C. components of the lamp cur-rent is necessary. There are, in general, two methods of measuring superimposed alternating and direct current. The
first is measurement without separating the two components; and the second, measurement after separating the alternating from direct current. A number of possible methods falling
under these two main divisions will be considered and the relative merits of each will be discussed.
The most obvious way of measuring the currents without separating them is shown in figure 4.
Fig. 4.
-9-A direct current and also an alternating current ammeter are placed in series in the lamp circuit. Since the D.C. instru-ment measures the average value of the total current, a
sinus-oidally varying alternating current will not affect it; and the meter will read only the value of the direct current com-ponent. The A.C. amraeter, on the contrary, reads the root mean square value of the total current. If the total current is expressed by the equation
I= IVC IAC IDC + I Sin
w
t thenIL? Ic + 21, I, Sin w t + I* x Sin'<d t and the average value of I is then
I-2 -- Iz }
ff
=
V Ice + * = IMwhere Ip is the reading of the A.C. meter; I* , the amplitude of the alternating current; and Ic , the reading of the D.C. meter (see figure 5).
Fig. 5.
.Pc
t
By transposing the above equation we obtain
I, I_2 -I,
Since the electrical modulation equals * its value can now be calculated.
Consequently, when the percent modulation is small, Im and Ivc must be known very accurately to obtain I* with even reasonable accuracy, because Io depends on the dif-ference of the squares of two very nearly equal numbers. Because of the difficulty in determining Im and Ipcwith suf-ficient precision, experimental errors in Io as great as t 15% are obtained when the modulation is small. Obviously this method is unsatisfactory.
Other Dossible circuits use the method of separation of the alternating and direct currents. The first of these
circuits is shown in figure 6.
Fig. 6.
1T~ANFORMIA
D.C.C
As has already been shown, the D.C. ammeter is unaffected by the alternating current and consequently will satisfactorily measure the direct current if merely placed in series with the lamp. The transformer shown has induced in its secondary an alternating voltage which is measured by the A.C.voltmeter. From a knowledge of the electrical constants of the transformer it would be possible to calculate the amount of alternating current in the lamp circuit. However, transformer character-istics, especially when the primary carries both alternating and direct current, are usually linear to only i 1%.
Al-though this method is better than the previous one, it too is not sufficiently accurate.
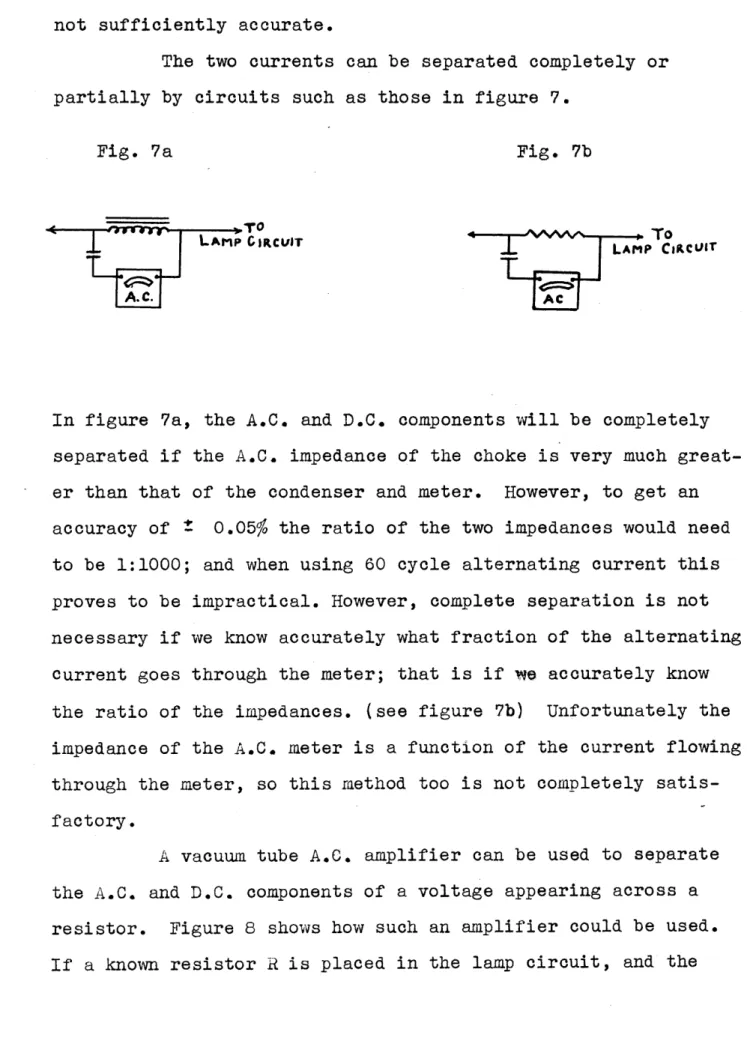
The two currents can be separated completely or partially by circuits such as those in figure 7.
Fig. 7a Fig. 7b
To
LAMP CIRCUIT LAMp C:RCVT
A.C. AC
In figure 7a, the A.C. and D.C. components will be completely separated if the A.C. impedance of the choke is very much great-er than that of the condensgreat-er and metgreat-er. Howevgreat-er, to get an accuracy of 2 0.05% the ratio of the two impedances would need to be 1:1000; and when using 60 cycle alternating current this proves to be impractical. However, complete separation is not necessary if we know accurately what fraction of the alternating
current goes through the meter; that is if we accurately know the ratio of the impedances. (see figure 7b) Unfortunately the impedance of the A.C. meter is a function of the current flowing through the meter, so this method too is not completely satis-factory.
A vacuum tube A.C. amplifier can be used to separate the A.C. and D.C. components of a voltage appearing across a resistor. Figure 8 shows how such an amplifier could be used. If a known resistor R is placed in the lamp circuit, and the
Fig. 8.
LAMP Clacut R ~cm
grid of a vacuum tube is connected across it, the A.C. voltage across R will be amplified and appear at the load resistor L L where it is rectified and read on a D.C. voltmeter. However, since the rectifier and the vacuum tube characteristics are not strictly constant, the best results obtainable with such a circuit have an error of plus or minus one or two percent. The circuit shown in figure 9 measures the unknown voltage by
comparing it with a known voltage.
Fig. 9. SPi
SWITCH
TO
LArMP CIRCUIT
R
vOS2iLAJ
2IIERjWith the snap switch in position 1 the height of the wave on
the oscillograph is noted. Then with the snap switch in position 2 the variac is adjusted until the wave on the oscillograph is the same height as before. If the impedance of the oscillograph is very much greater than that of R, the voltage on the A.C.
-13-meter will be the same as the A.C. voltage across the known resistor R. The results obtained in this way are accurate to about ± 1%, greater accuracy being impossible because of the difficulty in observing a small difference in the height of the two waves on the oscillograph.
If, however, we substitute an amplifier and volt-meter for the oscillograph above, it is possible, using the
same method, to obtain results which have an accuracy limited only by the precision of the voltmeter. Since at the balance point the same voltage is applied to the amplifier with the snap switch in position I as is applied with it in position 2 this is a null method; and the characteristics of the amplifier do not affect the results. If Weston Dynamometer instruments are used, it is possible to measure the alternating and direct
current components to an accuracy of 0.1%. Of course we
could measure the direct current component more accurately with a D.C. potentiometer, but this additional accuracy would be of no value without a corresponding increase in the accuracy of the A.C. measurements.
Of the above methods for measuring the direct and the alternating current components in the lamp circuit, the last is the only one which gives the desired accuracy, although there may be other circuits which would work equally well.
CHAPTER IV
Detailed Experimental Technique
The circuit finally used to obtain the data employs the basic ideas expressed in Chapter II and uses the amplifier voltmeter comparison method of measuring voltages as discussed in Chapter III.
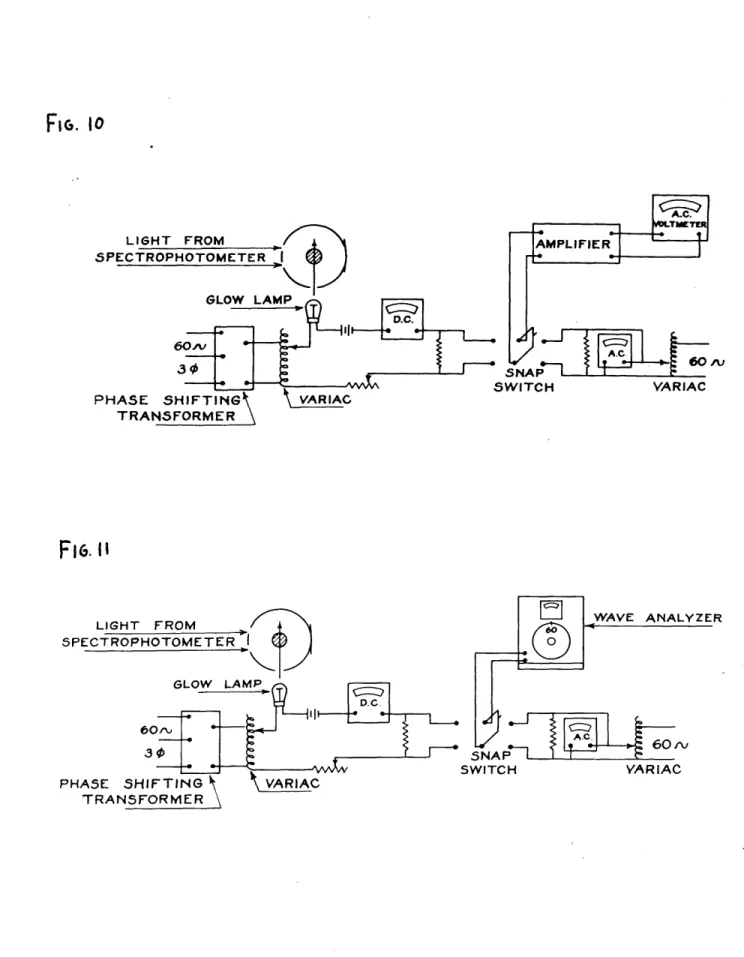
The light from the glow lamp (see figure 10) is first adjusted by means of the phase shifting transformer until it is 1800 out of phase with the light from the photometer. The ad-justment is roughly determined by means of an oscilloscope a-cross the output of the amplifier in the spectrophotometer. When the oscilloscope shows the normal strays of the amplifier, the two lights are very nearly 180 out of phase. The critical adjustment is made by adjusting the phase until the spectropho-tometer is most sensitive.
The photometer is next adjusted for 50% optical modu-lation; and the glow lamp, for 50% electrical modulation. The spectrophotometer is now made to balance at this point by adjust-ing the amount of light from the glow lamp that is allowed to enter the integrating sphere. If the electrical modulation is now changed, the spectrophotometer will automatically balance at
some new point; and the optical modulation at this new point can be determined from the reading of the transmission dial. In
this way we can get the optical and corresponding electrical modulation at any desired number of points.
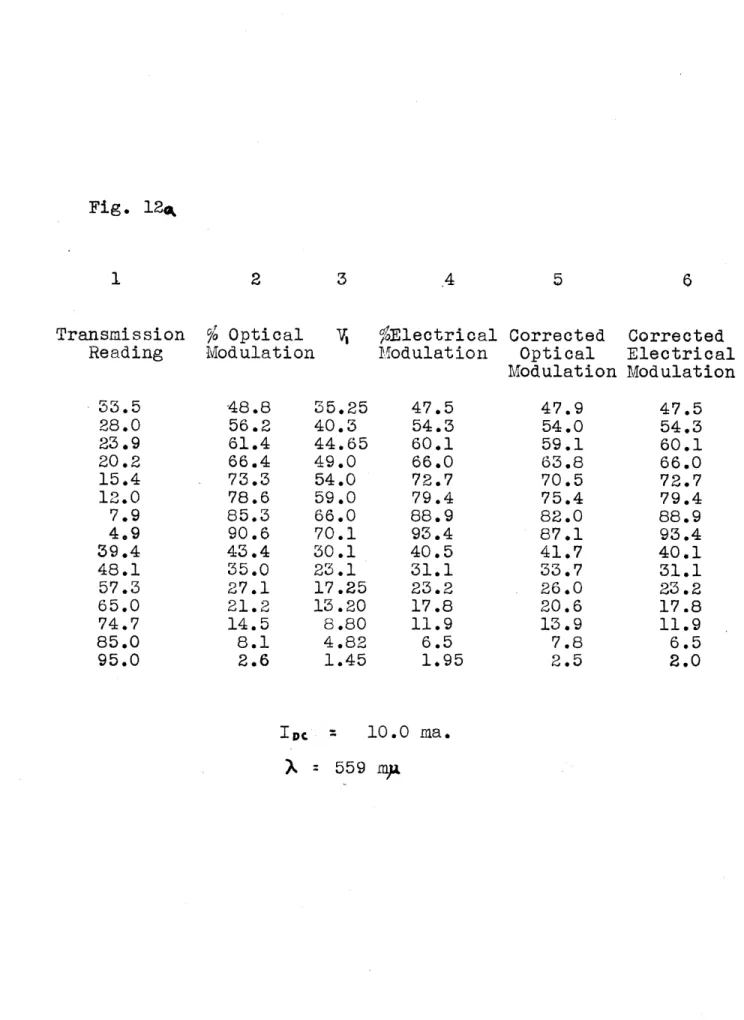
A typical data and calculation sheet is shown in fig-ure 12&. The data in columns 1 and 3 are obtained respectively
FiG.
to
LIGHT FROM ? z L i GH T FROMAMPLIFIE R ra SPECTROPHOTOMETER | GLOW LAMP .1xSWITCH VARIACPHASE SHIFTING VARIAG TRANSFORMER
FiG.
U
ANALYZER
SNAP
Fig. 12* Transmission Reading 33.5 28.0 23*9 20.2 15.4 12.0 7.9 4.9 39.4 48.1 57.3 65.0 74.7 85.0 95.0
%
Optical Modulation 48.8 56.2 61.4 66.4 73.3 78.6 85.3 90.6 43.4 35.0 27.1 21.2 14.5 8.1 2.6 V, 5Electrical Corrected Modulation Optical Modulation 55.25 40.3 44.65 49.0 54.0 59.0 66.0 70.1 30.1 23.1 L7.25 13.20 8.80 4.82 1.45 47.5 54.3 60.1 66.0 72.7 79.4 88.9 93.4 40.5 31.1 23.2 17.8 11.9 6.5 1.95 47.9 54.0 59.1 63.8 70.5 75.4 82.0 87.1 41.7 33.7 26.0 20.6 13.9 7.8 2.5 Corrected Electrical Modulation 47.5 54.3 60.1 66.0 72.7 79.4 88.9 93.4 40.1 31.1 23.2 17.8 11.9 6.5 2.0 I DC 10.0 ma. X = 559 mgxfrom the transmission dial of the photometer and from the A.C. voltmeter. The figures in column 2 are the percent optical modulation corresponding to the various transmission readings
and are obtained by referring to the previously mentioned plot of modulation versus transmission. The percent electrical modu-lation in column 4 is calculated by multiplying the figures in
column 3 by the correct factor (in this case 1.346), the factor being determined by IDc and by the circuit constants. In order to facilitate the comparison of the curves, the slope of each curve is adjusted to make the curve pass through the point 50% Electrical Modulation and 50% Optical Modulation. This proced-ure is justified because the slope was originally determined by the purely arbitrary adjustment of the amount of light from the glow lamp that was allowed to enter the integrating spheres. This adjustment of slope is made by multiplying the figures in columns 2 and 4 by the appropriate factor (in this case 50/5-2 ), the figures in columns 5 and 6 being the final corrected values of optical and electrical modulation.
If the data obtained, using the circuit shown in fig-ure 10, are to be relied upon, there is, in particular, one possible source of error which bears further investigation. The comparison method of measuring voltage gives reliable re-sults only if the wave form of the current in the lamp circuit is the same as the wave form of the current with which it is be-ing compared. The circuit shown in figure 11 can be used to check the date obtained with the Drevious circuit and thus determine whether any error is introduced because of the possible differ-ence in wave form. In figure 11 the wave analyzer, substituted
-16-for the amplifier and voltmeter of figure 10, measures A.C. voltage of any particular frequency desired. It was adIjusted to measure the voltage of the 60 cycle fundamental alone; and data was obtained using the same procedure as with the previous circuit. Since the wave analyzer is not affected by any har-monic content of the voltages, we will have proved that the
lamp and the comparison voltages have the same wave form, if the data obtained using the wave analyzer is the same as that ob-tained using the amplifier and voltmeter. It was found that the data obtained was the same for either circuit, showing that
there is no difference in wave form in the lamp and comparison voltages.
Only two special precautions were found necessary. The lamp in the spectrophotometer had to be operated by storage batteries in order to avoid the effect of variations in D.C. line voltage, and the load resistor in the lamp circuit had to be large enough so that the voltage across it was very much greater than any strays picked up by the system.
The characteristics of a number of lamps were obtained using the method described in this chapter, and a discussion of typical results follows.
Results
The following data for the two type lamps studied, neon and argon, were obtained by the method discussed in the previous chapter. Figure 12 shows the curve of a typical neon
lamp. .s can be seen, the curve is very nearly linear over a rather large range. Figure 13 is a comparison of two different neon lamps and the curve shows that, up to 60 percent modulation there is no measurable difference in the two lamps. If these lamps are to be useful, the characteristics must not change with time. Figure 14 shows the results of an ageing test. The crosses are the points obtained when the lamp was new; and the circled points, those obtained after 100 hours of operation. As can be seen there was so little change in the characteristic after 100 hours of operation that only one line could be drawn through both sets of points. Figure 15 is the curve of a typic-al argon lamp and it too is nearly linear over a large range.
From these curves we can draw a number of conclusions regarding the suitability of these lamps for use in a photomet-ric system such as that conceived by Dr. Duntley. The first requirement that the lamps must satisfy is that the character-istics be constant over a reasonable period of operation. As we have already seen this is the case at least up to 100 hours of operation. Secondly, since such a photometric device can be made to operate over any desired portion of the characteristic,
- - - _______
40 60
COMPARISON CF NEON LAMPS
Fi6.
14
-18-mathematical rather than emperical calibration of the instrument. Finally, the similarity of the characteristics of different
lamps should allow a lamp to be replaced without affecting the calibration.
Since the characteristics of all the lamps tested show the same general curvature, the question of the cause of this curvature bears consideration.
CHAPTER VI
Explanation of Results
The curvature of the data of the previous chapter shows that the optical modulation of these gas filled lamps increases more slowly than the electrical modulation. It is a well known fact in spectroscopy that the intensity of a spec-trum line is not a linear function of the current flowing
through the gas, and upon this fact can be based a probable ex-planation of the results. This non-linearity means that high frequency harmonics would be present in the light emitted by a gas excited by a modulated current. However, since the data in this paper were obtained when the fundamental alone was consid-ered, the curvature of the characteristics must be caused by an increasing harmonic content of the light from the glow lamp.
-20-Bibliography
1. "The Use of Modulated Lamps in Photometry"
S.
Q.
Duntley to appear in an early issueof J.0.S.A.
2. "A New Recording Spectrophotometer" A. C. Hardy J.O.S.A. 25, 305, (1935)