Publisher’s version / Version de l'éditeur:
Vous avez des questions? Nous pouvons vous aider. Pour communiquer directement avec un auteur, consultez la
première page de la revue dans laquelle son article a été publié afin de trouver ses coordonnées. Si vous n’arrivez
Questions? Contact the NRC Publications Archive team at
[email protected]. If you wish to email the authors directly, please see the first page of the publication for their contact information.
https://publications-cnrc.canada.ca/fra/droits
L’accès à ce site Web et l’utilisation de son contenu sont assujettis aux conditions présentées dans le site
LISEZ CES CONDITIONS ATTENTIVEMENT AVANT D’UTILISER CE SITE WEB.
Student Report (National Research Council of Canada. Institute for Ocean Technology); no. SR-2005-03, 2005
READ THESE TERMS AND CONDITIONS CAREFULLY BEFORE USING THIS WEBSITE. https://nrc-publications.canada.ca/eng/copyright
NRC Publications Archive Record / Notice des Archives des publications du CNRC : https://nrc-publications.canada.ca/eng/view/object/?id=c9f263c3-e8d2-408a-a7dc-749f11b062cc https://publications-cnrc.canada.ca/fra/voir/objet/?id=c9f263c3-e8d2-408a-a7dc-749f11b062cc
NRC Publications Archive
Archives des publications du CNRC
For the publisher’s version, please access the DOI link below./ Pour consulter la version de l’éditeur, utilisez le lien DOI ci-dessous.
https://doi.org/10.4224/8895949
Access and use of this website and the material on it are subject to the Terms and Conditions set forth at Testing and evaluation of a buoyancy engine for an underwater glider
DOCUMENTATION PAGE REPORT NUMBER SR-2005-03 NRC REPORT NUMBER --- DATE April 2005 REPORT SECURITY CLASSIFICATION
Unclassified
DISTRIBUTION Unlimited TITLE
TESTING AND EVALUATION OF A BUOYANCY ENGINE FOR AN UNDERWATER GLIDER
AUTHOR(S)
Christopher Warren
CORPORATE AUTHOR(S)/PERFORMING AGENCY(S)
Institute for Ocean Technology, National Research Council, St. John’s, NL PUBLICATION
---
SPONSORING AGENCY(S)
Institute for Ocean Technology, National Research Council, St. John’s, NL IOT PROJECT NUMBER
42_2088_10
NRC FILE NUMBER ---
KEY WORDS
buoyancy engine, underwater glider, autonomous underwater vehicle, AUV
PAGES vii, 41 App. A-E FIGS. 25 TABLES 4 SUMMARY
This report details the implementation and testing of a buoyancy engine for an underwater glider. The introduction of the report discusses underwater glider principles, and buoyancy engines. The following section presents the project design challenge, and the design constraints. An overall description of the vehicle and all of its major subsystems is presented. To commence testing fabrication had to be completed for the electronics section of the Buoyancy Engine. A mounting system was designed and fabricated for the electronic systems. To deal with power requirements a linear voltage regulator was designed. Then the standard assembly procedure is discussed. Section 4 describes software routines written to provide interfacing and control of all the subsystems. Some issues identified during programming are highlighted along with methods to correct them. Once all fabrication and programming was complete tests were run on individual subsystems, and finally in tank testing of the vehicle. The various testing procedures are detailed along with the results of the tests. Finally this memorandum closes with conclusions of the results of the project and
recommendations for future work.
ADDRESS National Research Council
Institute for Ocean Technology Arctic Avenue, P. O. Box 12093 St. John's, NL A1B 3T5
National Research Council Conseil national de recherches Canada Canada Institute for Ocean Institut des technologies
Technology océaniques
TESTING AND EVALUATION OF A BUOYANCY ENGINE FOR AN
UNDERWATER GLIDER
SR-2005-03
Christopher Warren
SUMMARY
This report details the implementation and testing of a buoyancy engine for an underwater glider. The introduction of the report discusses underwater glider principles, and buoyancy engines. The following section presents the project design challenge, and the design constraints. An overall description of the vehicle and all of its major subsystems is presented. To commence testing fabrication had to be completed for the electronics section of the Buoyancy Engine. A mounting system was designed and fabricated for the electronic systems. To deal with power requirements a linear voltage regulator was designed. Then the standard assembly procedure is discussed. Section 4 describes software routines written to provide interfacing and control of all the subsystems. Some issues identified during programming are highlighted along with methods to correct them. Once all fabrication and programming was complete tests were run on
individual subsystems, and finally in tank testing of the vehicle. The various testing procedures are detailed along with the results of the tests. Finally this memorandum closes with conclusions of the results of the project and recommendations for future work.
TABLE OF CONTENTS 1.0 INTRODUCTION 1 1.1 Buoyancy Engine 1 2.0 DESIGN CHALLENGE 3 1.1 Design Constraints 3 2.2 Vehicle Description 4 3.0 CONSTRUCTION 15 3.1 Assembly 19
3.1.1 Assembly Steps Diaphragm Section 19
3.1.2 Assembly Procedure 19
3.2 Assembly Steps Electronics Section 20
3.2.1 Electronics Assembly 20
3.2.2 Assembly Procedure 21
4.0 SOFTWARE 23
4.1 Programming/SmartCat 24
4.1.1 Function Libraries 24
5.0 IMPLEMENTATION AND TESTING 28
5.1 Leak Tests 28
5.1.1 Vacuum Test 28
5.1.2 Pressure Test 29
5.1.3 Test Application 30
5.2 Analog to Digital Converter Test 31
5.2.1 Pressure Sensor Depth Test 31
5.3 Noise Test 32
5.4 Tow Tank Test 33
6.0 CONCLUSIONS AND RECOMMENDATIONS 38
REFERENCES 42
APPENDIX A - PURCHASE ORDERS APPENDIX B – DATASHEETS
APPENDIX C - CAD DRAWINGS APPENDIX D - SYSTEM SCHEMATIC
LIST OF TABLES
Table 1: Buoyancy Engine Voltage and Current Specification 7
Table 2: DB9 - RS-232 pin definitions 12
Table 3: Command Set Summary 23
LIST OF FIGURES
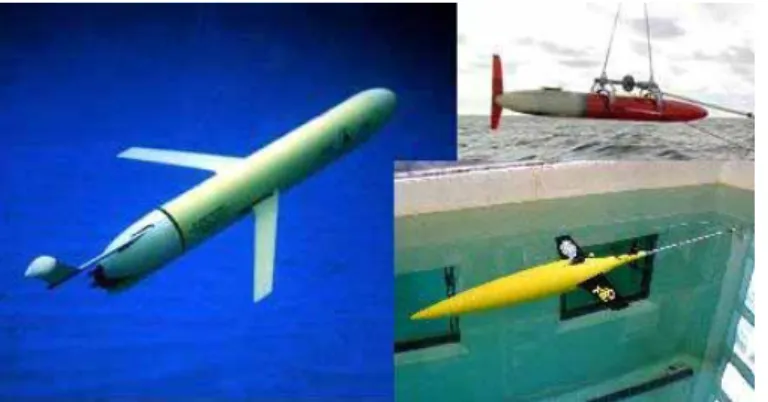
Figure 1: Left Slocum Glider, Top Right Spray Glider, Bottom Right Seaglider 1
Figure 2: Buoyant forces acting on a blunt cylinder in water 2
Figure 3: Linear Actuator and Rolling Diaphragm Type Buoyancy Engine 2
Figure 4: Rolling Diaphragm 3
Figure 5: Dissasembled Buoyancy Engine 4
Figure 6: 3540M Stepper Motor Driver 5
Figure 7: SmartCat Single Board Computer 6
Figure 8: Buoyancy Engine Voltage Regulator 8
Figure 9: Power Supply Module 8
Figure 10: DB9 connector pinout 12
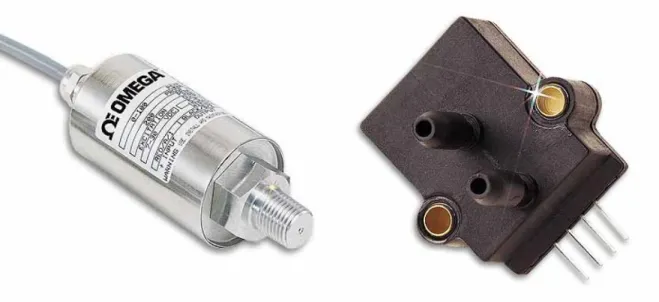
Figure 11: Pressure Sensors left PX303, right PX138 13
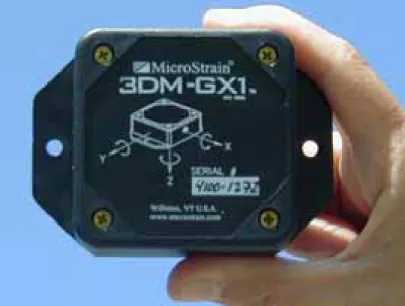
Figure 12: 3DM-GX1 Orientation Sensor 14
Figure 13: O-ring Seal 15
Figure 14: Electronics Tray in Mounts 16
Figure 15: Buoyancy Engine chambers and end caps 19
Figure 16: Buoyancy Engine Electronics 21
Figure 17: Vacuum Test Setup 28
Figure 18: Vacuum Test Apparatus 29
Figure 19: Plot of Vacuum Monitored Overnight 30
Figure 20: Plot Comparing Measured Depth to Actual Depth 32
Figure 21: Plot of the PX303 Input Voltage and Output Voltage 33
Figure 22: Buoyancy Engine Dive Profile and Volume Change 34
Figure 23: Orientation of the Buoyancy Engine 35
Figure 24: 3DM-GX1 Accelerations 36
LIST OF ABBREVIATIONS AND SYMBOLS
ADC ...Analog to Digital Converter AUV...Autonomous Underwater Vehicle ABS...acrylonitrile butadiene styrene EMI ...Electromagnetic Interference GPS ...Global Positioning System ID ...Inner Diameter
IO ...Input/Output
LVR...Linear Voltage Regulator NPT ...National Pipe Taper
NRC-IOT ...National Research Council Institute for Ocean Technology PVC...polyvinyl chloride
RAM ...Random Access Memory RF...Radio Frequency
OD...Outer Diameter
SBC ...Single Board Computer VBD ...Variable Buoyancy Device
1.0 INTRODUCTION
Autonomous Underwater Vehicles (AUVs) have been widely used for data-gathering missions in marine science. A recent development in Underwater Vehicle Design is the Underwater Glider. The Underwater Glider is a highly efficient, low speed underwater vehicle capable of missions as long as six months in duration. Their efficiency and range owes to their buoyancy engine
propulsion systems and gliding ability. These are the key features that identify the Underwater Glider. All gliders additionally possess data acquisition and communications electronics making them mobile sensory platforms capable of a variety of measurements. Some such measurements would include measuring plankton levels, or level of salinity. They could also be used for taking soundings or for naval reconnaissance. They navigate by the Global Positioning System (GPS) and ded reckoning. When at the surface a glider can use a satellite or radio frequency (RF) communication system to upload its acquired data and download new instructions.
Some underwater gliders in use today are the Slocum Glider (figure 1 left), Spray Glider, and Seaglider. The Slocum glider is built by Webb Research Corporation in East Falmouth, Massachusetts. It has been involved in numerous missions from data-gathering, tracking red tides to Mine Countermeasures experiments [1]. Spray Glider (figure 1 top-right) (named after the boat Joshua Slocum used for the first solo circumnavigation of the globe) was developed by Breck Owens of the Woods Hole Oceanographic Institute, and Russ Davis and Jeff Sherman of the Scripps Institution of Oceanography. It was the first AUV to cross the Gulf Stream on its own [2]. Seaglider (figure 1 bottom-right) was built at the Applied Physics Laboratory of the University of Washington. The glider has a highly streamlined hull to optimize efficiency, and it possesses the unique characteristic that the compressibility of the pressure h matches the compressibility of water. Seagliders have been used for data-gathering missions in marine science and oceanography, and have also been experimented with for naval
reconnaissance and surveillance [3]. A common feature of these and all underwater gliders is that they can change their volume (and thus their displaced mass) by using a buoyancy engine.
Figure 1: Left Slocum Glider, Top Right Spray Glider, Bottom Right Seaglider
ull
1.1 Buoyancy Engine:
The Buoyancy Engine is the key component in the efficient design of an Underwater Glider. It is a variable buoyancy device, which enables it to ascend and descend through the water column by changes in buoyancy (figure 2). Essentially two methods exist to vary the buoyancy of an object in a fluid. One method changes the mass of the vehicle by dropping mass. The other varies the buoyancy of the vehicle by changing its volume. There are many designs for variable volume buoyancy engines most variations either use a pump to move fluid between internal and external bladders, or use a piston/diaphragm assembly driven by a linear actuator to change the volume of
the vehicle (figure 3); the latter is the concept behind the current design. There are other variations of these designs, which are discussed in a previous study [4].
Figure 2: Buoyant forces acting on a blunt cylinder in water
2.0 DESIGN CHALLENGE:
The National Research Council Canada is currently developing a laboratory scale Underwater Glider (the IOT-Glider Project) at its Institute for Ocean Technology. The prototype will be used for research into glider hydrodynamics and performance, as well as a test bed for new sensors
and actuators such as the Flexfin1. A part of this project is to develop a buoyancy engine capable
of vertical translation to a depth of 20 m in the water column. The design uses a linear actuator and rolling diaphragm to vary the volume of the vehicle. This type of engine design was chosen in an earlier study (Janes 2004), for properties of good efficiency and quick response. This chapter presents a brief overview of the project in its current state as well as changes made for this report.
2.1 Design Constraints 1) Size
• The vehicle fits a 1 m long, 10 cm ID (11.5 cm OD) ABS Pipe. It consists of two sections, one section 54 cm long containing the mechanical components, and a 46 cm long section for the electronics.
The device has an approximate 10:1 length to diameter ratio scaled from the Slocum Glider.
2) Depth
• The vehicle is designed to a maximum operational depth of 20 m.
3) Power Supply
• The system main supply will be 24 Volts, likely consisting of batteries.
• The control and instrumentation consists of several modules using off the shelf components. Each component requires a supply at different voltage (some require multiple supplies), and power levels.
• Additionally to ensure system stability, and reliable instrumentation, electrical isolation of the supplies for the motor and electronics is recommended.
4) Vacuum
• A partial vacuum of 70% must be
maintained inside the Buoyancy Engine. This is necessary to ensure that the rolling
diaphragm maintains a 180o convolution
between the piston skirt and the cylinder walls (see image).
All components must be able to operate normally inside this vacuum.
must s
able penetrators, and air inlets).
Figure 4: Rolling Diaphragm Seals to the outside of the vehicle
be airtight, watertight and able to withstand more than 4 atmosphere pressure differential across them (c
1 The Flexfin is a new actuator concept in which the fin is composed of a rigid tip and a soft body. The fin is rigidly
attached to the body of the vehicle at its base. One benefit of such a device is to provide a surface for dynamic control without the need for a shaft seal.
2.2 Vehicle Description
The Buoyancy Engine consists of a two-section pressure hull constructed of Acrylonitrile Butadiene Styrene (ABS) (figure 5). The two sections are mated using a custom machined aluminum center section. The center section also serves as the mounting base for the linear actuator. The end of the electronics section is closed with a custom machined cap made of polyvinyl chloride (PVC). The cap also contains ports for the external pressure sensor, a cord grip, and a quick connect air valve. The actuator end of the engine is enclosed using a custom machined PVC cylinder for the diaphragm mount. The Rolling Diaphragm itself completes the seal, and is fastened using a custom machined nut made of PVC. On the current model the ends of the cylinder are left blunt. Future versions will be fitted with a noise and tail fairing to improve hydrodynamic drag, and wings will be attached allowing the vehicle to glide. Purchase orders for parts and materials bought during the time of this project are found in appendix A.
Figure 5: Dissasembled Buoyancy Engine
Variable Buoyancy Device (VBD):
As stated before the apparatus used for varying buoyancy in this buoyancy engine consists of a rolling diaphragm driven by a linear actuator (figure 2). The diaphragm used is a custom made Dia•Com® Type D-300-300 Rolling Diaphragm. The diaphragm is made using EPDM as the
convolution width of 3.9 mm give it a rated pressure of 1470 psi. The Type D diaphragm is molded with a bead on the flange for easy sealing, and additionally allows for a smaller hardware diameter than other diaphragm types. A key feature of a rolling diaphragm is that it maintains a constant area as long as it is positioned within its recommended half-stroke. This allows for precise control of volume when position feedback is used. To move the diaphragm an Ultra Motion® Digit 8 inch stroke Linear Actuator with NEMA HT23-401 size Stepper Motor is used. To obtain position feedback the linear actuator is fitted with a 10 kΩ ±30% Precision Linear Potentiometer. With this setup precise volume control is possible.
Motor Driver:
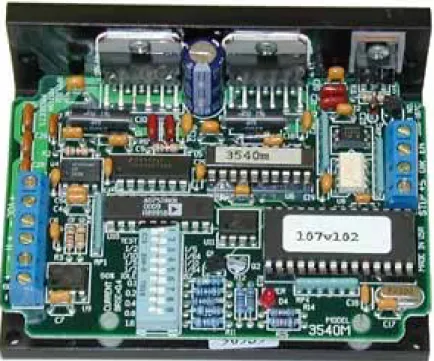
For motor control the system uses an Applied Motion Products® 3540M Stepper Motor Driver (figure 6). The controller has microstepping capability, and idle current reduction. Idle current reduction reduces the phase current to 50% of normal when the motor is not moving. This can improve system efficiency by reducing the current while still maintaining holding torque to keep the motor in position. Inputs to the drive are optically isolated signals for step, direction, and enable. Control of the drive is done on the control board through the application of step pulses to make the motor turn, and a direction signal for controlling the direction of motor rotation.
Figure 6: 3540M Stepper Motor Driver
Control Module:
For this development we desired a control module which would suit the need of the current application, but also we wanted a module that would be suitable for use in other projects. The controller needed to have lots of analog and digital input/output (IO). Since it would be interfacing with a number of other modules as well as a computer for monitoring purposes, a number of serial communications ports would be needed. The controller would also have to be fast enough and possess enough memory to handle the various control tasks assigned to it.
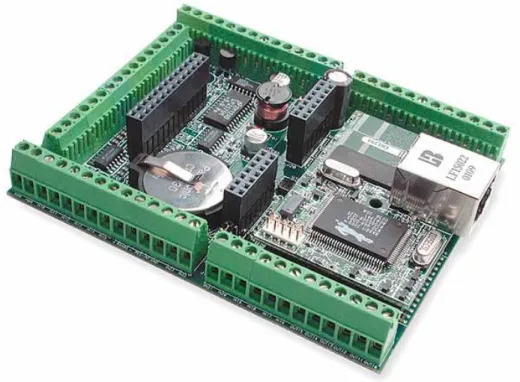
Figure 7: SmartCat Single Board Computer
Additionally the unit had to be small enough to fit into the 4” diameter pipe used to hold the electronics. The controller is a BL2100 SmartCat Single Board Computer (SBC) from
Z·World® (figure 7). A datasheet for the SmartCat can be found in appendix B. The SmartCat runs on a Rabbit 2000™ microprocessor at 22.1 MHz, with 128K SRAM and 256K Flash. This leaves lots of space for both program and data, which was a reason for choosing this controller since we wanted to be able to extend its use to other prototypes. The SBC has 24 digital inputs protected to ±36 VDC. It has 16 digital outputs capable of sinking or sourcing up to 200 mA with I/O voltages up to 36 VDC. The computer has 11 Analog to Digital (A/D) converter channels with a ±10 V input range. There are four digital to analog channels that can output from a range of 0-10 V at up to 10 mA depending on the supply voltage applied to the controller. For communications the SmartCat also has two RS-232 serial ports (software-configurable to one serial port with flow control), one RS-485 half-duplex serial port, and one Ethernet port. Another useful feature of the SmartCat is its multithreading capability using Z·World’s Dynamic C® Software Development Environment with its costate library.
Power Supply:
A requirement for the power supply is for electrical isolation between the control and
instrumentation electronics, and the motor and drive electronics. To accommodate this, separate supplies will be used for the above-mentioned systems. This simplified the overall design of the power supply since each supply can be tailored to its specific application. The power supply design is therefore separated into two sections: Design of Power Supply 1 (PS1) for the Control and Instrumentation Electronics, and Design of Power Supply 2 (PS2) for the Motor and Drive Electronics.
PS1 Design:
The control and instrumentation of the Buoyancy Engine uses several off-the-shelf modules. Each component has its own supply requirement (some require multiple supplies as with the SmartCat). Below is a table showing the supply requirements for the components used in the Buoyancy Engine.
Table 1: Buoyancy Engine Voltage and Current Specification
Voltage Power Current Input Voltage Output Voltage Input Voltage Output Voltage
Part Description MIN/MAX [VDC] [W] [mA] MIN/MAX [VDC] MIN/MAX [VDC] MIN/MAX [VDC] MIN/MAX [VDC] PX303 Pressure Sensor 10/30 15 N/A N/A N/A 0.5/5.5
PX138 Pressure Sensor 7/16 3 N/A N/A N/A 1/6*
3DM-GX1Attitude Sensor 5.2/12 65 N/A** N/A** N/A N/A BL2100 SmartCat 9/36 1.5 -36/+36 0/36 -10/+10 0/10 3540m Stepper Motor Driver 12/42 6000*** 5/24 N/A N/A N/A
HT23-401 Stepper Motor 3 3000 N/A N/A N/A N/A
Component Supply Specification for Underwater Glider
*Output proportional to supply voltage. Output shown for 8Vdc supply **Interface via rs232/rs485
***2X Motor Current
Supply Digital I/O Analog I/O
As the table above shows, the supply requirement for the Electronics of the Buoyancy Engine cannot be satisfied using a single supply. Power supply design was restricted primarily by the supply requirements of the PX138 Pressure Sensor, and the 3DM-GX1 Attitude Sensor since they are rated to a maximum supply voltage of 16 V and 12 V respectively. At first glance it would appear that the supply requirement would be satisfied with a supply voltage in the range of 10–12 V. However the SmartCat requires a minimum input supply of 13 V to attain the maximum output voltage of 10 V. This is due to the SmartCat’s internal analog supply, which is linearly regulated and has a dropout voltage of 3 V; additionally the output power dissipation of the D/A converter drops off for supplies above 15 V (2). From a previous study the supply voltage was specified to be 24 V (1). To obtain supplies suitable for the other components a regulator was designed. NOTE: The most efficient solution would have been to use a switching regulator to produce the needed voltages, and electrical isolation. However due to time
constraints and parts availability, linear voltage regulators (LVR) were used. To power the PX138, and 3DM-GX1, 8 V was chosen as the supply level (higher voltages could have been used, but this would have increased the heat dissipation inside the modules. As well since the PX138 output is proportional to the input, this would also amplify the noise from this sensor.). For I/O a standard 5 V supply was chosen. To attain 8 V the Micrel® MIC29303BT Low-Dropout Adjustable Regulator was used, and a standard MC7805BT LVR was used to produce 5 V. A requirement for this design was that the power module should have a low profile since it was to be mounted on the underside of the electronics tray where the maximum clearance to the pipe is 1.5 inches. This meant that when coupled with the mounted IC height of approximately 1 inch, a suitable heat sink would be difficult to fit in the space.
On the following page is the schematic for the finished Power Module (figure 8), following that is the fully constructed power supply (figure 9).
Figure 8: Buoyancy Engine Voltage Regulator
Supply Design:
The MIC29303 is an adjustable regulator, and the manufacturer’s datasheet provides the following equation for setting the Output Voltage:
VOUT = 1.240 V × [1 + (R1 / R2)]
∴R2 = R1 / [(VOUT / 1.240 V) – 1]
R1 = 1 MΩ, VOUT = 8 V
R2 = 1 MΩ / [(8 V / 1.240 V) – 1] = 183.432 kΩ
Nearest Standard Resistor values with 1% tolerance are R1 = 1 MΩ, and R2 = 182 kΩ
Verification:
VOUT = 1.240 V × [1 + (1 MΩ / 182 kΩ)] = 8.05 V
The above calculation confirms the resistor selections are suitable for this application. The 5 V supply to be used for I/O is the MC7805BT Linear Voltage Regulator. The input supply to the regulator is taken off the output of the 8 V regulator. The primary reason for taking 5 V off of 8 V was to limit heating in the IC so that the use of a heat sink could be avoided. To avoid the use of a heat sink on the 8 V regulator, a series voltage-dropping resistor is used.
Thermal Calculations:
The data sheet for the MC7805BT linear voltage regulator shows the junction to ambient temperature thermal resistance is:
θJA = 65oC/W - Thermal Resistance (Junction to Ambient) for TO-220 package.
TA = 20oC - Ambient Temperature.
TJMAX = 125oC - Maximum allowable Junction Temperature.
IQ = 5 mA - Quiescent Current (Also known as Ground Current).
The Maximum power dissipation without a heat sink is:
PDmax = (TJMAX - TA) / θJA
PDmax = (125oC - 20oC) / 65oC/W
PDmax = 1.615 W
The actual Power Dissipated by the 7805 for an output current of IO = 50 mA is:
PD = (VIN – VOUT) * IOmax + VIN * IQ
PD = (8 V – 5 V) * 50 mA + 8 V * 5 mA
As we can see from this analysis the power dissipation in the 7805 is considerably less than its peak allowable power dissipation without a heat sink. Therefore this design is sufficient for the application.
The 8 V supply will feed the PX138, 3DM-GX1, and the 5 V Regulator. Therefore the current flow through the regulator is:
IMIC29303 = IPX138 + I3DM-GX1 + I7805 + IGND
I7805 = 3 * II/O
where,
IMIC29303 - is the current flowing through the 8 V Regulator.
I7805 - is the current flowing through the 5 V Regulator.
IPX138 = 3 mA – is the current required by the PX138.
I3DM-GX1 = 65 mA – is the current required by the 3DM-GX1.
II/O = 10 mA – is the I/O current required to drive the optical-isolators on the 3540M.
IGND = 5 mA – the ground current in the 7805 regulator.
Therefore the 8 V supply will have to provide at least:
IMIC29303 = 3 mA + 65 mA + 3*(10 mA) + 5 mA = 103 mA
Including in a 50% safety factor we determine the peak supply current to be: IMIC29303MAX = 1.5 * IMIC29303 = 154.5 mA ≈ 150 mA
The 8 V supply is regulated using a Micrel® MIC29303BT Adjustable Output Regulator in a TO-220 package. The maximum power dissipation for this package without a heat sink is:
PDmax = 1.7 W
Calculating the required power dissipation of the regulator for an input supply of 24 V + 2 V = 26 V, a maximum load current of 154.5 mA, and a ground current of 35 mA we get:
VIN = 26 V VOUT = 8 V IMIC29303MAX = 154.5 mA IGND = 35 mA PD = (VIN – VOUT) * IMIC29303MAX + VIN * IGND PD = (26 V – 8 V) * 0.1545 A + 26 V * 0.035 A PD = 3.69 W
As we can see the power dissipation is too high so a heat sink is required, however the design requirement limits the size of heat sink that can be used. For example a heat sink capable of this requirement (PA1-1CB from IERC-CTS Corp®) is 0.75” high. When attached to the regulator this heat sink would be too high to fit in the space underneath the electronics tray. To address
this problem an alternative approach was taken. This method uses a resistor in series with the regulator at the supply side to drop the voltage into the regulator, therefore moving a portion of the power dissipation into the resistor.
To calculate the maximum value of resistance that can be used with the regulator, the following formula was used:
VIN (MIN) – (VOUT (MAX) + VDO)
RMAX = –––––––––––––––––––––––
IOUT (PEAK) + IGND
where,
VIN (MIN) - is low supply (24 V – 2 V = 22 V).
VOUT (MAX) - is the maximum output voltage (8 V).
VDO - is the worst-case dropout voltage of the regulator.
IOUT (PEAK) - is the maximum load current (254.5 mA).
IGND - is the regulator ground current (35 mA).
where,
22 V – (8 V + 0.600 V)
RMAX = ––––––––––––––––– = 70.71 Ω
(0.2545 A + 0.035 A)
The nearest standard value to this is 68 Ω ±5%. Next we need to size the resistor, so the power dissipated in the resistor is given by:
PR = (IOUT (PEAK) + IGND) * R
PR = (0.1545 A + 0.035 A) 2 * 68 Ω = 2.44 W
A resistor with a power rating of 3 W or better will meet the design requirement, a suitable resistor is a RW3R0DB68R0J wirewound resistor manufactured by Ohmite®.
Now re-examining the regulator power dissipation we see that the power is now shared between the resistor and the regulator. The regulator power dissipation is now reduced to:
PD = 3.69 W – 2.44 W
PD = 1.25 W
Now the power dissipation is sufficiently reduced to avoid using a heat sink on the regulator. The final design aspect for the power supply is the interface. The power supply will carry a number of screw terminal blocks to facilitate connection to the various modules on the system. This completes the design of PS1.
PS2 Design:
Power Supply 2 provides power to the stepper motor and its associated driver electronics. Power is directed through the 3540M Stepper Motor Driver to the HT23-401 Stepper Motor. The motor driver itself regulates the current to the motor by chopping the voltage supplied to it [5]. The User’s Manual for the 3540M Stepper Motor Drive states that a power supply should be chosen with a voltage output that is at least five times higher than the rated motor voltage. For the supplied current the supply should be able to deliver at least two times the rated current of the motor. The HT23-401 Stepper Motor has a rated phase current of 3A, and a rated voltage of 3 V for a unipolar operation. So for this application the minimum power supply requirements are:
VSUPPLY (MIN) = 5 * 3 V = 15 V, and
ISUPPLY (MIN) = 2 * 3 A = 6 A
Additionally the manual recommends that the wiring to the drive be no smaller than 20AWG, and that the positive lead be protected with a 4 A fast-acting fuse. This completes the design of the power supply module for the Buoyancy Engine.
Power/Communications Cable:
For initial testing and evaluation, the Buoyancy Engine will be tethered to a PC or Laptop
computer for communications and power. The cable will be a seven conductor 20AWG shielded and sheathed cable. Two pairs of wires carry the power supply for the motor, and the electronics systems. The remaining three conductors are used for the Tx, Rx, and Signal Ground lines that will be connected to the computer. The interface to the computer is an RS-232 specification, and is terminated using DB9 connector (figure 10).
Table 2: DB9 - RS-232 pin definitions PIN Function Description
1 DCD Data Carrier Detect
2 Rx Data Received
3 Tx Data Transmitted
4 DTR Data Terminal Ready
5 SGND Signal Ground
6 DSR Data Set Ready
7 RTS Request to Send
8 CTS Clear to Send
9 RI Ring Indicator
Figure 10: DB9 connector pinout
Only pins 2, 3, and 5 are used on the connector, however if the Comm Port on the host computer requires handshaking to function properly, then this can be accomplished by connecting pins 1 (DCD), 4 (DTR), and 6 (DSR) together, and connecting pins 7 (RTS), and 8 (CTS) together. This will effectively make the PC handshake with itself, if it does not support an asynchronous communications mode.
Pressure Sensors:
The pressure sensors used in the Buoyancy Engine come from OMEGA Engineering, Inc. The Buoyancy Engine utilizes these sensors to determine its operating depth, and to monitor the vacuum inside the vehicle. For monitoring the vacuum the Buoyancy Engine uses a PX138 absolute pressure sensor (figure 11 right). The sensor reads pressures from 0-15 psia, and is calibrated for a 5 V output span (see datasheet in appendix B for complete specifications). The voltage output from the sensor ranges from 1-6 VDC, however the output voltage is directly proportional to the voltage supplied to it. This allows the output span to be increased, but also means that the supply to the sensor must be very stable otherwise the sensor output will be corrupted. The Buoyancy Engine uses a PX303 absolute pressure sensor to measure the pressure external to the vehicle (figure 11 left). Using the pressure reading, the depth of the vehicle at the time the reading was taken can be determined. The sensor is calibrated for a 0-50psi output in a 5 V span. The output voltage ranges from 0.5 V to 5.5 V, and the device has an accuracy of 0.25% full scale (see datasheet in appendix B for complete specifications). The response time of the sensor is 1 ms, with underwater vehicles fast response is a requirement for measuring depth. With the above specifications and the price ($ 356.00), this sensor is an excellent choice for taking depth measurements.
Attitude Sensor:
To determine its orientation the Buoyancy Engine uses the Microstrain® 3DM-GX1 3-axis Gyro Enhanced Orientation sensor with temperature compensation (figure 12). This sensor is used to measure the attitude of the vehicle (see datasheet in appendix B for complete specifications). Currently it has no active use, however eventually it will be used as an input to a pitch and roll controller. Since the only function of the vehicle is vertical translation in its current
configuration, roll and heading readings are unusable due to the singularity in Euler Angles at ±90º pitch. The sensor has the ability to output other data formats (Raw Readings, Vectors, Orientation Matrix, or Quaternion Vectors). Quaternion coordinates are insensitive to the singularity found in euler angles. Euler Angles can then be calculated by using the quaternion and the arctan2 function commonly found in most programming languages.
3.0 CONSTRUCTION
From past work on this project, construction of the Buoyancy Engine was nearly complete [6]. The pressure hull along with the variable buoyancy device had been finished, and the machining of the end caps was complete. This finished the bulk of the fabrication necessary to test the prototype. There were however some issues that still needed to be addressed before the device could be put into the water:
1. A test assembly of the pressure hull and the PVC end caps found that the fit was too tight. This would have made it very difficult to assemble and disassemble the components once the O-ring seals are installed. To address this issue John Bell (IOT Design Group) was consulted to see if the problem could be corrected. Specifically we did not want to compromise the seal between the end cap and the pressure hull. His response was to machine 5mils off the end cap surface to improve the fit. This will not affect the seal since it is actually made at the surface of the channel, and the O-ring (figure 13).
Figure 13: O-ring Seal
2. There was no design for mounting the electronics. The electronics and batteries required for the Buoyancy Engine had not been considered in the design. Therefore it was
necessary to find the absolute dimensions of all electronics to go into the vehicle. Then using this information a mounting scheme was devised. Two possible candidates were chosen for the electronics mount.
One scheme consisted of an Aluminum plate centered inside the electronics chamber. The electronics would be mounted on both sides of the plate, and held in place inside the pipe using mounting rails machined from ABS. The rails would be glued to the inside of the pipe, and friction would hold the plate in place. The advantage of this scheme is that it takes up less space. However there may not be enough clearance
due to the unevenness of the pipe, and manufacturing tolerances for the components to fit.
The other method is essentially the same as the first except that most of the
electronics would be mounted to the topside of the plate (low profile components can be mounted on the underside). The plate would still be mounted inside the pipe on rails machined from ABS glued to the pipe, but the plate would be offset to allow more clearance space on the topside. This scheme has the advantage of guaranteeing there is sufficient clearance for components on the topside of the plate. Its
disadvantage is that it uses (wastes) more space since the underside of the plate will not be completely used.
The second scheme was chosen because it ensures there is sufficient space for the
components, and leaves more room for wiring. Additionally the unused space allows for the addition of any other components (e.g. Signal Conditioning) provided they are small enough for the available space (see Appendix C for CAD drawing). Below is a picture of the electronics mount (figure 14).
As the picture shows the
electronics is offset from center to allow more space on top of the plate. The rails have a groove 3/32 inch deep. It is the same width as the plate so that friction will keep the plate from sliding out of place.
Figure 14: Electronics Tray in Mounts
Once the rails were fabricated and glued into place, the electronics tray could be drilled and tapped so that the electronic modules (SmartCat, 3540m, etc.) could be mounted for installation. Appendix C contains the drill layout for the Electronics Tray. Having completed fabrication of the Electronics Tray the electronics section of the buoyancy engine is ready for assembly.
3. Before the Buoyancy Engine can enter the water, the entire device requires ballasting to make it neutrally buoyant. To make the vehicle neutrally buoyant it is necessary to determine the amount of mass to add (or remove). The Buoyancy Engine should be ballasted for neutral buoyancy with the piston-head lined up flush with the mounting
flange of the diaphragm. By calculating the volume of water the vehicle displaces, and measuring the actual mass of the vehicle, we can determine how much ballast the vehicle needs. For the volume calculation it was assumed the Buoyancy Engine is a cylinder exactly 1m long, and 4.5 inches in diameter. The volume is reduced by the distance the flange is located inside the Engine, and the area of the opening in the diaphragm cylinder. Therefore the displaced volume of the Buoyancy Engine is:
VBE = (LBE * (π/4) * DBE2) – (LO * (π/4) * DO2)
where,
VBE – is the calculated volume of the Buoyancy Engine.
LBE – is the length of the Buoyancy Engine.
DBE – is the outside diameter of the Buoyancy Engine.
LO – is the length of the opening in the end of the Buoyancy Engine to the
mounting flange of the diaphragm.
DO – is the diameter of the diaphragm cylinder.
VBE = (100 cm * π/4 * (4.5 inches * 2.54 cm/inch) 2)
- (2.5 cm * (π/4) (3.0 inches * 2.54 cm/inch) 2)
VBE = 10146.8cc
For this volume, and using ρWATER = 1 g/cc as the density of water. The displacement
estimate (mDIS) of the Buoyancy Engine is:
mDIS = VBE * ρWATER
where,
mDIS – is the mass of water displaced.
VBE – is the volume of the Buoyancy Engine.
ρWATER – is the density of fresh water.
mDIS = 10146.8 cc * 1 g/cc
mDIS = 10146.8 g = 10.1468 kg
The measured mass of the Buoyancy Engine is 7.4954 kg. Therefore 2.6514 kg of extra ballast is needed to make the vehicle neutrally buoyant. With this value a 2.2 kg lead ballast weight was designed using AutoCAD (see Appendix C). The weight was
machined in-house from lead; after machining the actual mass after weighing was 2.1572 kg. A smaller than required mass was designed to be conservative since it was easier to add precise amounts of extra weight than to remove mass by drilling lightening holes in the weight. With this mass and four hose clamps (27mm to 51mm diameter) to secure it (total mass of clamps 0.0868kg) the assembly procedures in the next section were followed so that the Buoyancy Engine could be put in the water. With the buoyancy engine placed into the water at the trim dock section of the tow tank, additional mass was added to the vehicle until neutral buoyancy was achieved. The final mass of the vehicle after ballasting was 10.0004kg. Note: The weight mentioned previously does not take into account the mass that would be added by the power/communications cable. The 0.1468kg difference in mass is due to the assumptions made in the volume calculations
(particularly in the mass due to the position of the diaphragm in the cylinder), and the mass of the cable. With the correct amount of mass in the vehicle, it is ready for final assembly and wiring detailed in the next section.
3.1 Assembly:
The assembly of the Buoyancy Engine is detailed in two sections: (i) The assembly of the section of the engine containing the rolling diaphragm, and (ii) the assembly of the section carrying the electronics.
3.1.1 Assembly Steps Diaphragm Section:
Note: To aid in assembly of the Diaphragm Section the motor of the actuator should be
connected to the 3540m Stepper Motor Driver so that the actuator can be extended and retracted. This will make ease the installation of the Piston and the Diaphragm. Figure 15 shows the parts of the Buoyancy Engine, with the actuator section already assembled.
Figure 15: Buoyancy Engine chambers and end caps
3.1.2 Assembly Procedure:
1. Attach the Hull Center Section to the Digit Linear Actuator Base using the Actuator Hold downs, and washers and 3/8” nuts.
2. Slide a clamp, ballast weights, followed by another clamp onto the actuator tube. 3. Install the alignment collar and hose clamp so that the inside face of the collar is flush
with the end of the actuator tube, and the alignment marks on the collar, and tube line up (the marks ensure that the dowel holes in the collar align properly with the dowels in the
Diaphragm Mount). Tighten the hose clamp to secure the alignment collar to the actuator tube.
4. Tighten the clamps to secure the ballast weights.
5. Extend the Actuator 5” so that there is sufficient clearance to install the piston. Install the piston onto the Actuator End. Tighten the setscrew to hold the piston in place and secure it into place with a 1/4”-28 x 2 3/8” Cap Screw.
6. Next take the Diaphragm End Pipe, Diaphragm Mount and clean them of any debris. Apply some vacuum grease to the rubber O-rings and install them in the channels on the Diaphragm Mount.
7. Press the Diaphragm Mount into the 2.65” deep recess into the Diaphragm End Pipe. 8. Install the Actuator Assembly into the Diaphragm End Pipe by aligning the marks on the
Alignment Collar and Diaphragm Mount, and then press the two parts together. Secure the end sections together with three strap clamps and #10-24 x 1/4” Stainless Steel Cap Screws.
9. Retract the piston so that the top of the piston is 3” inside of the radius groove in the Diaphragm Mount.
10. Apply vacuum grease to the flange of the Diaphragm. Then install it into the Diaphragm Mount. Then install the Nylon Washer, and secure the Diaphragm into place with the Diaphragm Nut.
This completes the assembly of the Diaphragm Section of the Buoyancy Engine.
3.2 Assembly Steps Electronics Section:
Assembly and Installation of the Electronics Section is much simpler than the Diaphragm section, however when wiring the modules together care should be taken to ensure that the connections are correct. Most components have electrical connectors or pigtails for wiring into the main controller. Wiring connections to the controller itself are terminated on 0.1” pitch screw terminal headers fixed to the controller board. The power supply module also has 0.1” pitch screw terminals for easy connection. As good practice power and instrumentation wiring should be kept separate as much as possible, to minimize Electromagnetic Interference (EMI)
from the power conductors. Where power and signal wires do cross, they should cross at 90o
angles to one another. Space constraints do not readily permit standard wiring practices, however the above noted practices should be observed as much as possible. To further reduce the effects of EMI shielded wire is recommended.
3.2.1 Electronics Assembly:
The control and instrumentation electronics for the Buoyancy Engine consist of six modules (figure 7): The BL2100 SmartCat - Single Board Computer (SBC), the 3540m Stepper Motor Driver, the 5V and 8V Linear Power Supply, the 3DM-GX1attitude sensor, the PX138 internal pressure sensor, and the PX303 External Pressure Sensor. The PX303 is mounted to a 1/4” NPT pressure port on the Electronics End Cap. All other components are mounted on the Electronics Tray a 1/8” thick aluminum plate. To maximize the use of available space, the 3DM-GX1, SmartCat, 3540m are mounted to the topside of the plate with the remaining items mounted on the underside. Extra space on the underside of the tray is used for storage of wire and trim
ballast weight. Below are the electronic components to go inside the Buoyancy Engine (figure 16).
Figure 16: Buoyancy Engine Electronics
3.2.2 Assembly Procedure:
1. Install the Power Supply module on the underside of the Electronics Tray using four #4-40 x 3/8” round head screws. Use a piece of rubber to insulate the terminals on the module from the Electronics Tray.
2. Install the PX138 pressure sensor to the underside of the Electronics Tray using two #6-32 x 3/4” round head screws.
3. Install the DB9 connector mounting bracket to the underside of the Electronics Tray using two #6-32 x 1/4” round head screws, a DB9 male connector can then be attached to the bracket with two each of #4-40 screws, #4-40 hex nuts, two #4 washers, and two lock washers.
4. On the topside of the tray mount the 3DM-GX1 using two #6-32 x 1/4” round head screws to the front end of the tray (towards the End Cap) with the connector receptacle facing forward.
5. Mount the SmartCat in the center topside of the tray with four #4-40 x 1/4” round head screws. Use a piece of rubber or a set of spacers between the SmartCat and the
6. Mount the Stepper Motor Driver to the topside of the tray towards the motor of the actuator with four #4-40 x 3/8” round head screws. The A+, A-, B+, B- terminals should face closest to the motor.
Wire the modules together as shown on the schematic in appendix D.
Note: Please check that the interface definitions in the software routines are the same as the physical wiring connections.
4.0 SOFTWARE:
The Buoyancy Engine uses a number of software functions to acquire and display data to the user at the terminal screen. For the tests performed in the tow tank a command line type
interface was written. The interface uses single characters to initiate commands to the Buoyancy Engine via an RS-232 serial port. To transmit commands from the PC a simple terminal
application such as HyperTerminal can be used. Table 3 shows a summary of the commands supported by the Buoyancy Engine Control Software. As can be seen from the table the method of control is open loop only. No form of closed loop control has been designed for this portion of the project, the closed loop controller will be designed during a later stage in the project. Table 3: Command Set Summary
Command Character Action Description A Moves Actuator -7 cm
Moves actuator so that the piston is at the minimum possible position corresponding to the length of the rolling diaphragm. This is used when installing the Diaphragm into the buoyancy engine.
B Moves Actuator
+7cm
Moves actuator so that the piston is at the maximum possible position corresponding to the length of the rolling diaphragm. This is used when assembling the Diaphragm into the buoyancy engine or when the piston needs to be removed.
M Moves
Actuator Moves the actuator to the position typed at the terminal. The position must be specified in cm.
N MiNimum
Halfstroke Moves Actuator to the minimum halfstoke of the rolling diaphragm.
X MaXimum Halfstroke
Moves Actuator to the maximum halfstoke of the rolling diaphragm.
S STOP Stops all actions and resets the controller.
In addition to transmitting commands to the Buoyancy Engine the terminal program serves as a buffer for logging data to files. Data readings of Time, Target Position, Linear Potentiometer readings, PX303 readings, PX138 readings, attitude, accelerations, and angular rates are print to the terminal screen where it can be recorded to a file for later analysis. Note the terminal screen must be setup to log the screen to a file, when setting up for logging data the operator can set the file name and extension to a name appropriate for test being performed. All software written for the Buoyancy Engine was written using the Dynamic C™ software development system, and resides on the SmartCat. The Dynamic C programming language is an extension to ANSI C that was written specifically for use on Rabbit® microprocessors, the most unique extension to the language is the ability to write multithreaded programs.
4.1 Programming/SmartCat:
A number of functions were written for the Buoyancy Engine to provide easy access to all the subsystems within the vehicle. These functions are stored in library files were they can be used in any programs where they are needed. In total five libraries were written for the Buoyancy Engine Control Program the following is a description of the function libraries.
4.1.1 Function Libraries: BE_Pressure.lib
This library was written for accessing the pressure sensors. The interface to the sensors uses the ADC to read the sensor outputs which are analog voltages. The PX303 is connected to analog input channel one on the SmartCat, and the PX138 is connected to analog input channel two. The following is the function list and their associated descriptions.
float getDepth(void);
Calculates the depth the buoyancy engine is at, by using the external pressure reading, and the SURFACE_PRESSURE global variable as the offset. The return value represents the depth in meters of the buoyancy engine.
float readExternalPressure(void);
Determines the external pressure outside the buoyancy engine by reading the voltage output of the PX303, the voltage is converted to pressure and returned as kilopascals.
float readInternalPressure(void);
Determines the internal pressure of the buoyancy engine by reading the voltage output of the PX138, the voltage is converted to pressure and returned as kilopascals.
float getSurfacePressure(void);
Reads the external pressure outside the buoyancy engine and stores the result in the SURFACE_PRESSURE global variable. NOTE: The Engine must be at the surface to determine the offset.
RAM_ADC.lib
This library provides custom ADC functions. The function are variations of the built-in library functions.
unsigned int readADC(unsigned int channel);
Reads and computes the average of six readings of the analog to digital converter. This is a form of low pass filtering and provides more consistent consecutive readings.
unsigned int readADCVolts(unsigned int channel);
This function was written mainly for debugging purposes. Since the flash memory can only be used for a limited number of erase/write cycles, and the calibration constants for the ADC are stored in flash. The constants were outputted to a file, then they were coded into this library so that they could be accessed. This program allows calibrated voltage reading to be taken when the program is compiled and run in RAM.
SerialPortCExtras.lib
This is a helper library that provides additional functionality for serial port C.
int serCdone(void);
This function tells whether serial port C is finished transmitting all the data sent to it. This is done by checking that the serial port write buffer is empty, and that the serial holding and shift registers have emptied.
void setupSerialPortC(void);
This function was written for easy setup of the serial port. It opens serial port C at 115200 baud with no flow control, and clears the input and output buffers.
char* serCgets(char* buffer);
This function reads in a string of characters. Characters are read from port C into the character buffer passed to the function as an argument until a return character is found where upon the string is terminated with a null character.
StepperMotorDriver.lib
Hardware Interconnect Definitions:
STEP Step Input on 3540m is connected to digital output 0
DIR Direction Input on 3540m is connected to digital output 1
EN Enable Input on 3540m is connected to digital output 2
LINEAR_POT linear potentiometer is connected to analog channel 0 float cof_moveActuator(float target_pos);
Moves the actuator to a position specified by the user. target_pos - the desired actuator position in cm.
The new position of the actuator is returned when it finishes moving. This function will yield to other costates.
float moveActuator(float target_pos);
Moves the actuator to a position specified by the user. target_pos - the desired actuator position in cm.
The new position of the actuator is returned when it finishes moving.
void pulse(void);
Pulse the output step pin requires time up down stepper moves on falling edge if the step pulse. float getPosition(void);
Determines the position of.
_3DM_GX1.lib
3DM-GX1 communications protocol:
Microstrain® provides a protocol for communicating with the 3DM-GX1. It consists of transmitting a command byte (and possibly some data bytes) to the 3DM, then it will respond with a stream of bytes the first byte in the stream will be the command that was (the entire
command protocol is available in appendix E). Refer to the protocol for information on how the SmartCat and 3DM should communicate.
Loss of calibration constants:
While developing the software for the 3DM-GX1 communications protocol we lost the units internal calibration constants. This was like due to consecutive plugging and unplugging of the sensors power adapter. The noise (the same as switch bouncing) likely caused the EEPROM to be erased or corrupted. The solution was to use the manufacturers demo application running in factory mode to reprogram the constants back into the 3DM. To run the application in factory mode edit the shortcut in the start menu by adding –factory as a start option. The 3DM-GX1 can run in both RS-232 and RS-485 communications mode. However the RS-485 protocol must use a mark and space parity-addressing scheme. The rabbit processor did not originally support this mode, new processors do support it but the software language is not up to pace with the
hardware. Therefore we did not have time develop routines to communicate using RS-485, with further work the protocol could be developed and thus many more devices could be connected to the SmartCat.
Points of Caution:
While developing software for the control interface as few technical issues were discovered: 1. First when performing integer arithmetic the programmer should be cautious about
multiplication. In Dynamic C a character is 8-bits, an integer is 16-bits, and a long is 32-bits. For example when multiplying two 16-bit integers, and then dividing by another integer the result could be wrong because the multiplication results in a long integer, however the value gets stored as a 16-bit integer truncating the upper bits thus the final result will not be correct. The compiler does not account for this automatically so to it by casting the value to long explicitly or by using long as the datatype.
2. The second precaution involves using functions that access the internal I/O registers of the processor. An example of this problem is in the function serCdone() shown below. int serCdone(void) {
i. unsigned int bufused, wrstatus;
ii. // Wait for memory data buffer, serial holding iii. // register, and shift
iv. // register all to become empty v. bufused = serCwrUsed();
vi. wrstatus = RdPortI(SCSR)&0x0C; vii. if ((!bufused) && (!wrstatus)) {
1. return (1); viii. } else {
1. return (0); ix. }
If the two read functions were used serCwrUsed, and RdPortI were call in the if
statement, the function would never return true because there is not enough time for the internal input data registers to settle before the processor tests the register state.
3. The third and final precaution involves using costates. When all the costates are set to activate at various predefined intervals a fatal error may occur. It seems this happens due to the processor looking for a task while there are none. To solve this problem use a dummy costate that does nothing. The error does not occur when this is done.
5.0 IMPLEMENTATION AND TESTING: 5.1 Leak Tests:
The Buoyancy Engine is constructed from a number of sections joined using O-ring seals. The end cap of the electronics section also contains a number of ports for sensors, wire, and the air valve. All these seals need to be verified to ensure the vehicle doesn’t leak. Two tests were applied to verify that the vehicle is watertight.
5.1.1 Vacuum Test:
The first test applied to the Buoyancy Engine was a vacuum test. Here the fully assembled Buoyancy Engine has air pumped from it until approximately a 70% vacuum is achieved (For the test setup used 70% is approximately 21” Hg). The vacuum is monitored at 1hour intervals over a period of 48 hours. The vacuum should not drop by more than 1” Hg in this time interval (allow for variations in atmospheric pressure). To monitor the vacuum a gauge apparatus was built to provide a means of removing air from the chamber in addition to monitoring, and isolating the system from the atmosphere. Below is a photo of the test setup with the pump and Buoyancy Engine connected (figure 17). The Buoyancy Engine is connected using a quick
disconnect valve. A ball valve cuts off the connection between the pump and Buoyancy Engine. hile the vacuum gauge and valve apparatus is attached to the engine the gauge provides the readout of the vacuum. Figure 18 shows a close-up of the vacuum apparatus. The vacuum setup provides a good method of detecting leaks over a period of several hours. However when a leak is detected it can be difficult to isolate the location of the leak due to the nature of vacuum (it is hard to see bubbles forming inside the engine). Therefore to supplement the vacuum test, a pressure test is also applied.
W
5.1.2 Pressure Test:
The pressure test was employed to assist in isolating the source of a leak when one is indicated by the vacuum test. This is a test commonly used to check for leaks in refrigeration systems. uses a system under pressure and soapy water to find leaks. When the water is spayed onto the leak it will form bubbles at the source of the leak. This is the primary method to find leaks in the Buoyancy Engine. However when applying this test the user should b
Figure 18: Vacuum Test Apparatus
It e aware that the internal ressure sensor can only withstand a limited amount beyond its maximum rating. From the p
datasheet for the PX138 the proof pressure of the device is 3 times the full-scale pressure. So the X138 can withstand a maximum of 45 psi. When this test is used the engine should not be
. oved valuable.
e
te the source of the ak by process of elimination (removing components) was unsuccessful. At this point the
ed a unications cable. Applying a pressure test did
a
through the cable itself. The pressure test was also applied at the end of the cable but no leak was found. In order to determine the rate of leakage, the B
approximately 70% vacuum. Using the logging applicatio HyperTerminal screen the raw data of internal pressure re
he sensors were s a s t the he , then P
pressurized beyond 45 psi. The electronics in the engine should not be powered during this test Using this test and the vacuum test the watertightness of the Buoyancy Engine was determined. In particular there were two cases where these tests pr
5.1.3 Test Application:
There were two cases where the application of each of the above noted leak tests solved a leak problem. One occurred during the first assembly of the Buoyancy Engine chambers, the other when the engine was being prepared for tank testing.
The first case was during the initial assembly of the Buoyancy Engine. The first used only th vacuum test applied in stages. The electronics chamber was first assembled and closed off using an extra end cap that was fabricated as a spare. The vacuum test during this application was successful. However for the second run the chamber containing the diaphragm was attached. The vacuum test in this case showed there was a leak. Attempting to isola
le
pressure test was used. The buoyancy engine chambers were pressurized using the shop air supply. Then a solution of soapy water (1:100) was sprayed on each joint and fitting. The leak was quickly found to be at the 3/8 inch NPT fitting of the cord grip. Tightening this fitting stopped the leak. One interesting point about this leak is that it did not emerge during the first run even though this fitting is on the end cap of the electronics chamber.
The second leak proved to be much more challenging to deal with. The vacuum test show s suspected that the leak was traveling
uoyancy Engine was pumped to n written for outputting data to the adings was outputted at 500ms
intervals and recorded to a file on t host PC (Readings for all
outputted in addition to internal pressure readings). Figure 19 show Matlab™ plot of the vacuum reading over approximately a 16-hour period. From this plot we can see tha
Buoyancy Engine looses
approximately 63% of its vacuum in 2.75 hours. The curve shows t decay is exponential in shape. The vacuum decays sharply initially the rate of decay slows as it
approaches zero. The key feature this graph shows is the vacuum lasts long leak occurred after installing the power and comm
enough (to keep the diaphragm convoluted) for approximately 3 to 4 hours of in-tank testing. Having determined this result we can see that the rate of leakage is slow enough to proceed with testing. However we must first ensure with reasonable certainty that the leak is confined insid the cable. To do this the cable was removed and the cord grip was plugged using a small piece of Lexan® (figure 18). Another vacuum test was performed and left overnight. The follow day there was no visible change on the gauge of the vacuum apparatus. Therefore it could be concluded that the leak is confined to the inside of the cable. From the decay curve 3-4 hours of testing could be performed on a single vacuum charge. An air leak will have the effect of changing the mass of the Buoyancy
e ing
Engine as more air flows inside the chamber. This has the ffect of changing the net buoyant force on the vehicle. When considering the effect of other
ngine (the buoyancy and drag due to the
ommunications cable) the mass of about 5 l of air is negligible. Also this change can be
ise
le levels (12-bit solution). Therefore for example if the input is 5 V then the reading could fluctuate between
r outputs have a 5 V output span, this could lead to high ranular noise when the readings are scaled to physical values. For example the following test of
cs e depth was changed in increments of 0.1 m to 0.3 m, and then o more sets of readings were taken with the chamber on the bottom of the tank and with it
hin gn depth of the device this error is small, it only represents 0.4% of the design depth. Of course the error becomes more significant as the depth get smaller. Therefore to reduce the granular noise the average of six readings is taken as a form of digital e
dynamic forces acting on the Buoyancy E c
compensated for by adjusting the neutral position of the actuator.
5.2 Analog to Digital Converter Test:
The Analog to Digital Converter (ADC) was a simple test to verify the amount of granular no from the ADC. Granular Noise is the variation output of an ADC, when the input is held constant or varies slowly. This is due the ADC quantizing the input to a specific level. During successive conversion cycles different levels may be achieved for the same input. The ADC channels of the SmartCat have a 20 V input range and 4096 different possib
re
4.995 V and 5.005 V. Since the senso g
the external pressure sensor shows granular noise at the output (figure 20).
5.2.1 Pressure Sensor Depth Test:
When initial programming of the SmartCat began the PX303 was tested to verify the accuracy of the output from the sensor, and the ADC in determining depth. This test was performed in the Trim Tank here in the AUV Development Lab.
The PX303 was installed in the Electronics Chamber along with the SmartCat. The Electroni Chamber alone was used because the Trim Tank is only 90 cm deep. A program was written to accept user input indicating the actual depth, and reading were output to the terminal screen where they logged to a file. Th
tw
anchored on its side at the bottom of the tank. The actual depth was measured using a measuring tape from the water surface to the pressure port in the end cap. The figure below shows the results of that test (figure 20).
As can be seen from the plot the depth measure using the sensor follows the actual depth wit ±0.04 m. In comparison to the desi
low-pass filtering. The number of readings to average was taken as a compromise between reduced granular noise and speed.
Measured Depth vs. Actual Depth
-0.1 Sample Point 0 0.1 0.2 0.3 0.4 0.5 0.6 0.7 1 9 17 25 33 41 49 57 65 73 81 89 97 105 113 121 129 137 145 153 161 169 177 185 193 201 209 217 225 233 241 249 257 265 273 281 289 297 Depth [metres]
Depth as Measure using PX303 [m] Actual Depth [m]
mparing Measured Depth to Actual Depth
m e ltage n. ll readings were taken. Then after about 0.5 seconds the test mode was switched off, after which readings were taken for another 0.5 seconds. This is the result of that test [figure 21].
Figure 20: Plot Co
5.3 Noise Test:
After the vehicle had been assembled and some time had been observing readings output fro the various sensors. It was realized that the movement of the actuator caused a significant amount of noise in the output of the PX303 external pressure sensor (there was no apparent affect on any of the other sensor outputs). This was presumed to be due to the variation in th supply voltage while the motor was turning. In an attempt to reduce the number of external supplies used for testing, all components of the buoyancy engine were powered by a single supply. Instead of using two supplies for isolation, it was decided to rely on the internal vo regulators of the modules anticipating they would provide sufficient line and load regulatio Figure 13 shows how the PX303 output varies when the actuator is moving and when it is stationary. For this test the 3540m was put into test mode to make the actuator move wi
Input and Output Voltage vs. Time 0 0.2 0.4 0.6 0.8 1 1.2 0 50 100 150 200 250 300 350 410 460 510 560 610 660 710 760 Time [ms] Voltage [V]
Output Voltage Offset by 1V Input Voltage Offset by 23V
Figure 21: Plot of the PX303 Input Voltage and Output Voltage
As can be seen from the plot with the actuator moving the output voltage of the PX303 varies by about 0.1V, while the main supply varies by about 0.15V. When the actuator is not moving both voltages stabilize to relatively smooth outputs. From this analysis it is determined that electrical isolation is absolutely necessary to acquire reliable instrumentation from all sensors. For
subsequent testing two external power supplies will be used for the electronics and for the motor. Eventually the external supplies will be replaced by two sets of internal batteries.
5.4 Tow Tank Test:
The end goal of the hardware, software, and leak tests was to ensure the Buoyancy Engine was ready for in tank testing. The final test performed on the Buoyancy Engine was conducted in
IOT’s Tow Tank at the Trim Dock2. This test will show the proof of concept for this buoyancy
engine design. In addition the test will highlight any needed changes to be made for subsequent tests. During this test the raw data from all sensors were output to the terminal and logged to a file from the terminal application. The data output to the terminal includes the reading of surface pressure, gain scale factors from the 3DM-GX1, calibration constants for the ADC, and the raw
2 The Trim Tank is a small section at the end of the Tow Tank where model are prepared. It is 7m deep, 2m wide,
data of position, pressure, orientation, accelerations, and angular rates. Control of the engine is through user input at the terminal program. The test sequence involved running a series of dive, and surface routines at different volume changes. Below is a plot of the depth of the buoyancy engine and change in volume (figure 22). This test helps to evaluate the response of the
Buoyancy Engine. Dive tests were limited by the cable length to a depth of 3m. The test shows that the response of the linear actuator to be too slow to reach the targeted volume change before the maximum depth was reached.
Change in Volume, Average-Speed and Depth Versus Time
-4 -3 -2 -1 0 1 2 3 4 104 114 124 134 144 154 164 174 184 194 204 214 224 236 248 258 268 278 290 300 310 320 330 Time [s] Spe e d [m /s ], D e pth [m ], Volu m e [c c m ] / 1 0 0 Depth [m] Average Speed [m/s] Change in Volume [ccm] / 100
Figure 22: Buoyancy Engine Dive Profile and Volume Change
Another test checked the repeatability of the actuator and rolling diaphragm. The system must be repeatable enough to achieve near neutral buoyancy when the actuator is instructed to return to zero. The figure above shows this was done at about 175 seconds (figure 22). A problem was realized when the actuator was moved to zero (zero corresponds to zero volume change). Due to the engine not being precisely ballasted, the engine went into a dive. When it reached about 2.75 m it reversed direction and began to rise. Some small volume changes helped to achieve neutral buoyancy at about 355 seconds. The apparent change in buoyancy as the engine got deeper was likely due to the communications cable since the cable displaced more volume as it got deeper in the water, and therefore it becomes more positively buoyant.