Comparison of fresh and ensiled white and red clover added to ryegrass
on energy and protein utilization of lactating cows
H. A. van Dorland, H. - R. Wettstein, H. Leuenberger and M. Kreuzer*
ETH Zurich, Institute of Animal Science, ETH Centre/LFW, CH-8092 Zurich, Switzerland
*Corresponding author. E-mail: [email protected]
Abstract
Two respiratory chamber experiments were conducted with dairy cows to compare metabolizable energy and protein utilization when feeding white or red clover with ryegrass. In experiment 1, fresh ryegrass was mixed with fresh white (WF) or red clover (RF) (60/40, on dry matter (DM) basis). Experiment 2 involved similar mixed diets in ensiled form (WS and RS, respectively), and two ryegrass silage diets, without (GS) or with supplementary maize gluten (GS þ ). Barley was supplemented according to requirements for milk production. Voluntary forage DM intake remained unaffected in experiment 1 and was higher ( P , 0·01) in experiment 2 for WS than for GS and GS þ (128 v. 98 and 106 g/kg M0·75). Within experiments, no treatment effects occurred for apparent nutrient digestibilities, milk yield, and composition. Protein utilization (milk-N/N-intake) was numerically lower on all clover-based diets (0·24 to 0·25) versus GS (0·29). With added maize gluten (GS þ ), protein utilization decreased to 0·23, indicating that ryegrass silage (plus barley) alone provided sufficient metabolizable protein. Consequently, higher ( P , 0·01) urinary energy losses occurred in GS þ compared with GS, despite similar metabolizable energy intakes, and a trend for the highest plasma urea levels was found for GS þ cows (7·59 mmol/l; P , 0·1). Overall, this study illustrates that the white and red clovers investigated were equivalent in energy and protein supply, also in comparison to the ryegrass. It remains open whether these forage legumes, when supplemented to a moderate-protein ryegrass, would have contributed to metabolizable protein supply or would have merely increased metabolic nitrogen load.
Keywords: forage, legumes, Lolium perenne, metabolism, metabolizable energy.
Introduction
In Europe, during the last decade, interest for feeding tem-perate forage legumes, both in fresh and conserved form, has grown. This renewed attention was due to changes in agricultural policy, which supports extensive and sustain-able farming systems (Rochon et al., 2004). Forage legumes, namely provide environmentally friendly alterna-tives for artificial nitrogen fertilizer, and can be considered from their nutritional composition (Station Federale de Recherches en Production Anima´le (RAP), 1999) both as protein (N) and energy sources for ruminants in low-con-centrate input systems based on ryegrass. Furthermore, higher intakes and better metabolizable energy (ME) use efficiencies for performance, especially at high feeding levels, have been observed when feeding legumes com-pared with grass (Cammell et al., 1986; Varga et al., 1990). White clover (Trifolium repens L.) and red clover (T. pratense L.) are the most important legumes of temperate pastures (Abberton and Marshall, 2005). Known differ-ences in plant chemical and physical characteristics of these clovers (Frame et al., 1998) may result in different modes of digestion of protein and other forms of organic matter (OM) and, consequently, energy and protein
utilization. For instance, beneficial effects of feeding white clover on animal performance and protein utilization were observed to be associated with an increased intake of food and passage rate of digesta compared with ryegrass alone (Dewhurst et al., 2003b). Red clover has extensively been experimentally compared with lucerne by Broderick et al. (2000 and 2001) for effects on protein utilization and ani-mal productivity, with red clover often being superior for these aspects. This competitive advantage of red clover, when ensiled, may partly be explained by the characteristi-cally high activity of polyphenol oxidase (Jones, 1995). Even though the, often estimated, energy and nutrient con-tents of white and red clover are to be found in most of the more comprehensive foodstuff tables, actually few feeding trials with dairy cows have been carried out in which white and red clover are compared, and metabolic studies are even more scarce.
Based on the knowledge available so far, the hypothesis to be tested in the present study was that white and red clover differ in terms of ME and protein for dairy cows when added to ryegrass in forage-based diets. Additionally, the extent of difference between white and red clover could depend on
the form, fresh or ensiled in which the forages are presented. In order to be able to quantify any extra rumen undegradable protein provided by either white clover or red clover, ryegrass was also supplemented in one treatment by a source of rumen undegradable protein.
Material and methods
Experimental forages
In March 2003, perennial ryegrass (Lolium perenne L., culti-var ‘Fennema’), white clover (Trifolium repens, culticulti-var ‘Klondike’), and red clover (Trifolium pratense, cultivar ‘Pirat’) were sown on fields, previously being managed as grass leys, along with application of dairy manure at a rate of approximately 55 kg nitrogen (N) per ha. The fields with ryegrass received additional 70 kg N per ha through split application as ammonium nitrate during that year in order to ensure a sufficient re-growth. The cultivars used were the same as applied simultaneously in a Europe-wide common protocol of a forage plot trial within COST Action 852 (http:// www.iger.bbsrc.ac.uk/COST_852/COST852Homepage. html). The ryegrass and clover fields were divided into smal-ler plots to allow successive regrowths to be established with the objective to harvest forages always at early bloom-ing stage for both fresh feedbloom-ing parallel to silage makbloom-ing throughout the growing season. This procedure ensured that any effects of clover type and addition were not the result of a differing vegetative stage. The forages were cut and not further chopped for fresh feeding or silage making. For fresh feeding, forage was cut twice a day and stored indoors on concrete floor, and offered within a day. The main periods during which forage was cut for silage making were during the second half of July and during the second half of September. Ensiling of the forages was preceded by wilting up to a dry matter (DM) content of about 650 g/kg DM, followed by the preparation of large round (approx. 1·4 m3) and small rectangular silage bales (approx. 0·2 m3) without the addition of any additives. Additives were not added in order to maintain the full effect of legume type on the conservation quality of the silage. Silage bales were opened not before 6 weeks had passed and were offered within 2 days.
Animals and study design
Two experiments were executed (experiment 1 and 2) with twelve and 24 multiparous lactating dairy cows, respect-ively. In experiment 1, eight Holstein Friesians and four Brown Swiss and in experiment 2, 12 Holstein Friesian and 12 Brown Swiss cows were used. Before the start of each experiment, cows were housed in a free-stall barn and received a total mixed ration of ryegrass silage, maize silage and hay in proportions of 0·43, 0·37, and 0·20 (on a DM basis), respectively, as a pre-experimental diet. In the last 8 days when still exclusively the pre-experimental diets were offered, baseline values were obtained (baseline data week, or so-called covariate period). At the start of the experiment, the cows selected for experiment 1 were on average 122 (s.d. 77) days in lactation, yielded 30·5 (s.d. 4·0) kg milk/day and weighed 680 (s.d. 61) kg. The corre-sponding values of experiment 2 cows were 115 (s.d. 75) days, 30·9 (s.d. 5·0) kg milk per day and 669 (s.d. 61) kg. In
each experiment, cows were allocated to the respective experimental groups of six by taking into account lactation stage (two classes of # 100, and $ 101 days in lactation). Furthermore, groups were balanced for breed type (Holstein and Brown Swiss). Diets in experiment 1 consisted of fresh ryegrass mixed either with fresh white clover (WF) or red clover (RF) offered in ratios of 0·6 to 0·4, respectively. Table 1 gives the actually consumed proportions, as it was not possible to mix exactly the targeted proportions, because the mixing was based on the DM values of the forages from the day before mixing. The two diets used in experiment 1 were also included in experiment 2 except that silages were offered. Ryegrass silage without clover silage served as unsupplemented control group (GS). Another group was offered ryegrass silage supplemented with maize gluten (GS þ ) as a source of rumen undegrad-able protein in an amount proportionately exceeding esti-mated requirements for absorbable protein at the duodenum (PDI; RAP, 1999) by 0·15. This was done in order to measure the contribution of the clovers to supply metabolizable protein. Additionally, in both experiments cows were offered a maximum of 2 kg hay each morning after milking, which was, especially in case of experiment 1, a preventive measure against either bloat or acidosis. Pel-leted barley was given in amounts which met each cow’s calculated extra energy requirements for milk production, which was dependent on the type of diet they were receiv-ing. This procedure was deliberately not applied for metabo-lizable protein in order to allow corresponding effects of legumes to develop. For group GS þ , maize gluten was pelleted together with barley (1:1). Throughout the trial, cows had continuous access to the forages and fresh
Table 1 Ingredient and nutrient composition (g/kg dry matter) of the diets used in experiments 1 and 2 as actually consumed by the cows Experiment 1 2 Diet† WF RF WS RS GS GS þ Ingredients Ryegrass, fresh 413 438
White clover, fresh 306
Red clover, fresh 259
Ryegrass silage 427 406 614 629
White clover silage 295
Red clover silage 259
Hay 120 121 79 79 94 81 Barley 156 177 194 251 287 159 Maize gluten 126 Mineral pre-mix‡ 5 5 5 5 5 5 Nutrients§ Dry matterk 163 191 613 577 715 702 Organic matter 899 907 895 903 912 912 Crude protein 226 210 198 186 176 216 NDF 395 423 438 438 464 456 ADF 232 235 266 261 246 243 Gross energy (MJ) 19·0 19·1 18·7 18·9 19·0 19·3 †
WF, white-clover ryegrass fresh; RF, red-clover ryegrass fresh; WS, white-clover ryegrass silage; RS, red-clover ryegrass silage; GS, ryegrass silage; GS þ , ryegrass silage and maize gluten. ‡Containing per kg DM: Ca, 170 g; P, 50 g; Mg, 80; Na, 40 g. §
Calculated from analysis of the individual ingredients. NDF and ADF ¼ neutral- and acid-detergent fibre.
k
water. Each day, barley and, in group GS þ , barley plus the maize gluten/barley mixture, were offered manually in five portions distributed over the day. The period when the experimental feeds were supplied lasted for 36 days. The first 14 days thereof served for adaptation to housing and feed by gradually replacing the pre-experimental diet with the respective treatment diets (transitory period). This was followed by a 22-day period exclusively on the experimental diets, of which the last 8 days were reserved for measure-ments and sample collection of food, milk, blood, and excreta as well as a 2-day respiration measurement period separating the first from the second 3 days of the 8-day period (collection week). Cows were housed in tie stalls and were led outside to an area of 90 m2with concrete floor for about 1 h every other day, except during the final 8-day period. The experiments followed the Swiss guidelines for animal welfare and were approved by the respective authorities.
Data collection and sampling procedures
Data collection and sampling procedures were identical for both experiments. Live weight (LW) of the cows was recorded every morning after milking and before feeding in the baseline data week and at the beginning and the end of the collection week. During the baseline data week and the collection week, individual forage intakes were monitored using a system equipped with electronic balances (Westfalia Landtechnik, Oelde, Germany), combined with Calan feed-ing doors (American Calan, Northwood, NH), registerfeed-ing intake at each access. Samples of food and refusals were collected every day during the collection week and were dried at 658C for 24 h, followed by an equilibration period of 24 h at room temperature. Thereafter, samples were milled through a 1·0-mm screen. Cows were milked at 05:00 h and 16:00 h. The milking system was equipped with a Metatron system (Westfalia Landtechnik, Oelde, Germany) which recorded milk yield and automatically obtained milk pro-portionately for chemical analysis. In the baseline data week and the sample collection week, the samples were either conserved with 2-bromo-2-nitropropane-1,3-diol (Bro-nopol; D and F Inc., Dublin, CA, USA) and kept at þ 58C until analysis, or immediately stored at 2 208C. The latter samples were subsequently thawed and pooled proportion-ately to each cow’s milk yield, to form one representative milk sample per cow for later analyses. In the baseline data week and the collection week (days 2 and 7, respectively), blood was collected into three containers from the jugular vein at 13:00 h after cows had been fasted for 2 h. Samples were anticoagulated with heparin, fluoride, and sodium flu-oride EDTA, followed by immediate cooling on ice. Plasma was obtained by centrifugation for 15 min at 1500 £ g and þ 48C and immediately stored at 2 208C for later analysis of hormones and metabolites.
Total faeces were collected in chromium steel tubs, which were placed underneath the cows. Faeces were weighed and sampled after being mixed. Total urine was collected separately from faeces in plastic canisters by the use of urinals which were attached around the vulva with Velcro tapes fixed to the sheared skin by instant glue (Cyanolit, 3M AG, Ru¨schlikon, Switzerland). The excreted urine was
collected in acidified (5 mol/l sulphuric acid) and non-acidi-fied form. After the daily sampling, faeces and urine were stored at 2 208C. Later, proportionate samples of faeces and urine were prepared and stored again at 2 208C until being analysed. Part of the faeces were dried at 658C for 48 h and milled through a 1·0-mm screen. Gaseous exchange was measured by placing the cows into a dual respiration chamber system operating by the open-circuit indirect calorimetry system (Hindrichsen et al., 2006). Each chamber had a floor size of 2·0 m £ 3·6 m and a volume of 20 m3. The chambers were air conditioned (17·4 (s.d. 0·5)8C
ambient temperature, 0·652 (s.d. 0·078) relative air humid-ity, 35·8 (s.d. 0·4) m3/h air flow, and 990·1 (s.d. 5·8) hPa air
pressure). Data on gaseous exchange were obtained over two consecutive runs of 22·5 h each. Every 3 and 20 min, respectively, outflowing and inflowing air was analysed during 20 s for carbon dioxide and methane by an infrared analyser (NGA 2000, Fisher-Rosemount, Ohio, USA) and for oxygen by a paramagnetic analyser (Oxymat 6, Siemens AG, Karlsruhe, Germany). The total air volume leaving the chambers was recorded with in-line electronic flow meters (Swingwhirl DV 630, Flowtec AG, Reinach, Switzerland). Every 3 h, concentrations of calibration gases were measured and a possible drift of measurement equipment was later on corrected by calculation.
Laboratory analyses
Contents of DM, total ash, neutral-detergent fibre (NDF), and acid-detergent fibre (ADF) of foods, refusals and faeces were determined according to standard methods (Naumann and Bassler, 1997). For DM and total ash determinations, an automatic analyser was used (Thermogravimetric deter-minator, TGA-500, Leco, St Joseph, MI, USA). For NDF and ADF determination a Fibertec System M (Foss Tecator, Ho¨gana¨s, Sweden) was employed. The values for NDF and ADF were corrected for ash content, and the content of NDF was analysed by digestion with a-amylase as rec-ommended by Van Soest et al. (1991). Gross energy (GE) of foods, refusals and dried faeces was assessed by ani-sothermic bomb calorimetry (C7000; IKA-Werke GmbH and Co. KG, Staufen, Germany). Foods, refusals, faeces, urine, and milk were analysed for nitrogen (N) and carbon (C) con-tents with a C/N analyser (Leco-Analysator Typ FP-2000, Leco Instrumente GmbH, Kirchheim, Germany) operating by the Dumas method for N (crude protein (CP) ¼ 6·25 £ N, except for milk). The Bronopol-stabilized milk samples were analysed for contents of fat, protein, lactose and urea by infra-red technique (Milkoscan 4000, Foss Electric, Hil-lerød, Denmark). Blood plasma concentration of insulin was measured with a radio-immuno assay kit (no. PI-12K, Linco, Missouri, USA). Plasma concentrations of albumin, protein, glucose, urea, creatinine, and triglycerides were analysed on a Cobas-Mira with kits no. 1970569, 1447513, 1489364, 1489291, and 2016648, respectively (all from Roche, Basle, Switzerland). Beta-hydroxy-butyrate (BHB) was measured according to McMurray et al. (1984) and non-esterified fatty acids (NEFA) with NEFA-C WA 994-75 409 (Wako, Neuss, Germany). Activities of two liver enzymes, alanine amino-transferase (ALAT) and aspartate-aminotransferase (ASAT), were analysed with kits no. 63 312 and 63 213 (Bio-me´rieux, Geneva, Switzerland), respectively.
Calculations
Body weight change was calculated as the average daily change between the mean of the baseline data week and of the experimental sample collection week. Feed contents, requirements for and the ratios of intakes over requirements for NEL(net energy lactation) and PDIE (supply of
absorb-able protein at the duodenum calculated from fermentabsorb-able OM and rumen-undegradable CP) as well as PDIN (supply of absorbable protein at the duodenum calculated from fer-mentable CP and rumen-undegradable CP) were deter-mined from tabulated values and recommended equations for requirements (RAP, 1999). For the latter data of the week before the collection week was taken as a basis. Energy-corrected milk (ECM) was calculated as [(0·038 £ g fat þ 0·024 £ g protein þ 0·017 £ g lactose) £ kg milk] 43·14 (Sjaunja et al., 1991). For the calculation of energy turn-over the following equations were used:
(1) methane energy (kJ) ¼ methane (l) £ 39·57 (Brouwer, 1965);
(2) urine energy (kJ) ¼ 33·1 £ urine-C (g) þ 9·2 £ urine-N (g) (Hoffmann and Klein, 1980);
(3) heat energy (corrected for fermentation-derived carbon dioxide) (kJ) ¼ 16·18 £ O2 (l) þ 5·02 £ [CO2
(l) 2 3 £ CH4 (l)] 2 2·17 £ CH4 (l) 2 5·99 £ urine-N (g)
(Chwalibog et al., 1996);
(4) milk energy (MJ) ¼ 0·038 £ fat (g/kg) þ 0·024 £ pro-tein (g/kg) þ 0·017 £ lactose (g/kg) (Sjaunja et al., 1991);
(5) efficiency of utilization of ME for lactation: kL¼ 0·35 £
(ME/GE) þ 0·420 (Agricultural and Food Research Council (AFRC), 1993).
Statistical analysis
All statistical analyses were performed with the general linear model procedure (GLM) for analysis of variance of the Stat-istical Analysis Systems Institute (1999 – 2001). Fixed effects of diet (D) and lactation stage (L; 2 classes of , 100, and .101 days in lactation) were tested for all data by the same model in both experiments: yij¼ m þ Diþ Ljþ eij. Lactation
stage was included as fixed effect to explain some of the variation, particularly in variables related to intake, energy balance, and milk yield. Interactions of the fixed effects were not taken into account in the model as most were not signifi-cant. For blood plasma data, the baseline data were included as covariates in the model. The inclusion of covariates in the model explains some of the variation between treatments, which may have been caused by differences measured during the baseline week. Multiple comparisons among LSmeans were done by the Tukey-Kramer method using the PDIFF-option with Tukey adjustment. The P-level for signifi-cance was set to 0·05. The tables give the treatment LSmeans and the average group standard errors (s.e.) of the LSmeans for each experiment. Data on plasma BHB was logarithmically transformed before analysis of variance.
Results
Table 1 summarizes the composition and the nutritive value of the diets as consumed by the cows in experiments 1 and 2, during the sampling period. Due to dry silages (per kg
substance: ryegrass, 640 g, white clover, 411 g, red clover, 414 g) as a consequence of wilting and dry environmental conditions, the silage diets had high DM contents. Especially the ryegrass silage, with a DM content of 640 g/ kg, proved to be somewhat atypical for ordinary silage. Rou-tine analytical tests confirmed on average good quality of all silages (pH, 6·0, 4·8, and 5·0; lactic acid, 12, 86, 84 g/kg DM, for ryegrass silage, white clover silage and red clover silage, respectively). There were no major differences among fresh and among ensiled experimental forages in CP content (244, 277 and 245 g/kg DM for fresh ryegrass, white clover and red clover; 206, 238 and 221 g/kg DM for ensiled fresh ryegrass, white clover and red clover, respect-ively) which resulted in relatively similar dietary contents, except for the maize gluten supplemented diet (GS þ ). Also fibre contents were similar across diets. The clover proportions in the mixtures as consumed in experiments 1 and 2 were near the target values, but were slightly higher for white than for red clover (0·43 and 0·41 for WF and WS as opposed to 0·37 and 0·39 for RF and RS, respectively). Due to the estimated lower NELcontent of the silages
com-pared with fresh forages, more barley was allocated in experiment 2 than in experiment 1 to compensate for this. No significant differences were observed between the diet groups in experiment 1 with regard to daily total and forage DM intake (DMI) when related to metabolic LW (M0·75;
Table 2). Total DMI (per M0·75) was similar between groups in experiment 2, and forage DMI was higher (P , 0·01) for the cows on the WS diet compared with the cows on the GS and GS þ diets. With regard to absolute total DMI, levels of 18·4, 19·0, 20·3, 18·6, 17·7, and 18·9 kg/day were found for WF, RF, WS, RS, GS, and GS þ , respectively. No signifi-cant differences were found between the two diets for CP intake (M0·75), in experiment 1. In experiment 2, CP intake (per M0·75) was higher (P , 0·05) for diets WS and GS þ
compared with the GS diet. Cows of almost all groups ingested less NEL than theoretically required according to
energy-corrected milk yield and LW. All groups, except that receiving ryegrass silage without clover or maize gluten con-centrate, consumed more PDIE than theoretically required. The intake of PDIN was higher than required in all groups, some groups exceeding requirements by almost 50%. In experiment 1, both diets supplied similar amounts of either PDIE or PDIN, while in experiment 2, supply of both was highest (P , 0·001) with the GS þ diet compared with the GS, RS and WS (only PDIE) diets. There was a loss of LW on average of all groups. In experiment 1, WF cows lost more (P , 0·05) LW than RF cows, while there were no clear group differences in experiment 2. ECM yield and milk contents of protein, fat, lactose and urea were not signifi-cantly affected by the dietary treatments in both experiments. However, in experiment 2 there was a numerically higher milk yield with the WS diet compared with the other diets but the milk yield of the cows on the WS diet had also been higher during the baseline data week. With fresh forage (experiment 1) compared with silages (experiment 2) it seems that cows produced more milk with higher fat and urea contents.
Within experiments, no significant diet differences were found for apparent digestibilities of OM, CP, NDF, and ADF
(Table 3). In both experiments, non-significantly higher ADF digestibilities were obtained with the use of white compared with red clover, while OM and NDF digestibilities were vir-tually the same. It seems that, as expected, the diets based on the fresh forages were slightly better digestible as those based on silages, although no statistical test was performed between experiments to confirm this. Protein utilization (pro-portion of dietary N excreted as milk-protein N) was similar for the two fresh forage diets (experiment 1). In experiment 2, the highest protein utilization was reached with the GS diet compared with the other silage diets (þ 0·047 on aver-age), which was the consequence of the differences in diet-ary CP content and intake rather than that of a higher milk protein output of the GS cows.
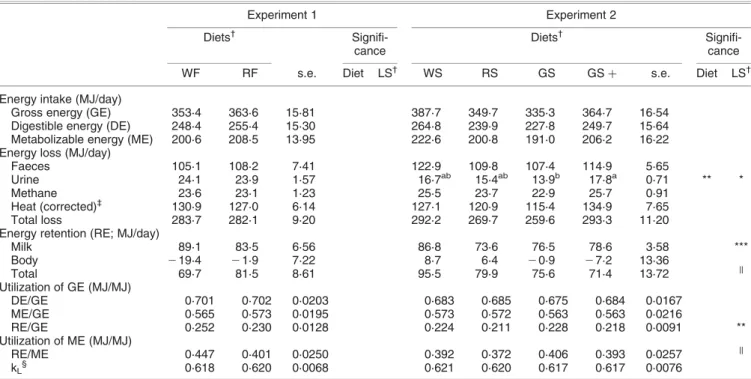
No significant differences were found between diet types in experiment 1 with regard to energy intake, excretion, balance and utilization (Table 4). In experiment 2, GS cows
lost less (P , 0·01) energy via urine compared with the GS þ . Comparing the results of the two experiments shows higher urinary energy losses in the cows of experiment 1 (24·0 v. 16·0 MJ/day). Metabolizability and efficiency of ME utilization for lactation were similar across diets and experiments.
Plasma levels of various hormones, enzymes and metab-olites, except plasma urea and BHB, related either to energy (glucose, insulin, NEFA, BHB) or protein metabolism (protein, albumin, urea, creatinine, ALAT, ASAT) were lar-gely unaffected by diet in both experiments (Table 5). In experiment 2, cows on the GS þ diet, followed by the cows on the WS diet, showed a trend for higher plasma urea levels than cows on the RS and GS diets (P , 0·1). There was also a trend (P , 0·1) toward higher BHB levels of the WS and GS þ cows compared with RS and GS cows. Plasma triglycerides were higher and creatinine was lower
Table 2 Intake and performance of dairy cows fed diets based on fresh forage (experiment 1) and ensiled forage (experiment 2)
Experiment 1 Experiment 2
Diets†
Signifi-cance
Diets†
Signifi-cance
WF RF s.e. Diet LS† WS RS GS GS þ s.e. Diet LS†
Daily intake (g/kg M0·75)
Total dry matter 147·2 152·2 6·59 159·8 147·8 138·0 144·5 6·34
Total forage dry matter 123·9 125·1 6·47 128·1a 112·3ab 97·6b 105·9b 4·77 ** k
Crude protein 33·2 32·0 2·07 31·6a 27·6ab 24·5b 31·4a 1·78 *
Intake over requirements‡
NEL 0·91 0·99 0·055 0·98 1·00 0·88 0·95 0·033
k *
PDIE 1·09 1·16 0·077 1·03b 1·05b 0·95b 1·23a 0·039 *** **
PDIN 1·42 1·46 0·111 1·31ab 1·27bc 1·08c 1·48a 0·052 *** **
Body weight change (kg/day) 22·53a 21·45b 0·285 * * 20·51 20·98 21·61 20·99 0·320
Milk yield and composition
ECM§pre-experimental period (kg/day) 32·6 30·6 2·03 32·8 32·1 30·6 31·2 1·65
ECM§experimental period (kg/day) 28·0 26·6 1·89 26·5 23·5 24·4 24·9 1·19 **
Protein (g/kg) 33·1 33·4 0·68 33·4 33·2 31·9 33·2 1·00
Fat (g/kg) 43·4 42·8 1·22 40·4 38·7 40·2 39·9 1·82
Lactose (g/kg) 47·8 47·7 0·69 k 48·6 48·7 47·9 47·4 0·51 *
Urea (mg/dl) 34·8 36·6 4·25 k 32·6 27·9 34·7 34·4 3·17
a,b,cLeast-square means in the same row with different superscript are significantly different (P , 0·05). †
WF, white-clover ryegrass fresh; RF, red-clover ryegrass fresh; WS, white-clover ryegrass silage; RS, red-clover ryegrass silage; GS, rye-grass silage; GS þ , ryerye-grass silage & maize gluten. LS, lactation stage, two classes of # 100, and $ 101 days in lactation.
‡
Calculated from tabulated values (RAP, 1999). NEL, supply of net energy lactation; PDIE, supply of absorbable protein at the duodenum cal-culated from fermentable organic matter and rumen undegradable protein; PDIN, supply of absorbable protein at the duodenum calcal-culated from fermentable protein and rumen undegradable protein.
§Energy-corrected milk. These represent the arithmetic means. k
Approaching significance (P , 0·1).
Table 3 Digestibility and protein utilization of dairy cows given diets based on fresh forage (experiment 1) and ensiled forage (experiment 2)
Experiment 1 Experiment 2
Diets† Significance Diets† Significance
WF RF s.e. Diet LS† WS RS GS GS þ s.e. Diet LS†
Apparent digestibility Organic matter 0·737 0·734 0·0205 0·713 0·719 0·716 0·720 0·0139 Crude protein 0·744 0·758 0·0171 0·729 0·705 0·699 0·727 0·0165 Neutral-detergent fibre 0·661 0·657 0·0279 0·653 0·651 0·656 0·670 0·0118 Acid-detergent fibre 0·649 0·604 0·0417 0·636 0·613 0·627 0·615 0·0250 Protein utilization Milk-N/N-Intake 0·238 0·241 0·0156 0·253 0·253 0·290 0·227 0·0179 ‡
†WF, white-clover ryegrass fresh; RF, red-clover ryegrass fresh; WS, white-clover ryegrass silage; RS, red-clover ryegrass silage; GS, rye-grass silage; GS þ , ryerye-grass silage and maize gluten. LS, lactation stage, two classes of # 100, and $ 101 days in lactation
for the cows fed fresh forages (experiment 1) instead of silages (experiment 2).
Discussion
Nutritive value
A proportion of 400 g clover per kg total DM in a grass-based diet, as chosen to be offered in our experiments, may realistically be achieved in a grazed pasture situation
(Harris et al., 1998). The total amount of the forage given in each of the experimental diets resulted in a forage pro-portion of . 700 g/kg (on DM basis) in all diets, indicating a high reliance on energy and protein supplied by the forage. Nevertheless, additional barley was given to sustain a milk production of over 20 l/day per cow. The fresh forage diets in experiment 1 were very similar with regard to OM, ADF, and GE contents. The higher CP content of white compared with red clover is in agreement with general observations
Table 4 Energy balance of dairy cows given diets based on fresh forage (experiment 1) and ensiled forage (experiment 2)
Experiment 1 Experiment 2
Diets†
Signifi-cance
Diets†
Signifi-cance
WF RF s.e. Diet LS† WS RS GS GS þ s.e. Diet LS†
Energy intake (MJ/day)
Gross energy (GE) 353·4 363·6 15·81 387·7 349·7 335·3 364·7 16·54
Digestible energy (DE) 248·4 255·4 15·30 264·8 239·9 227·8 249·7 15·64
Metabolizable energy (ME) 200·6 208·5 13·95 222·6 200·8 191·0 206·2 16·22
Energy loss (MJ/day)
Faeces 105·1 108·2 7·41 122·9 109·8 107·4 114·9 5·65
Urine 24·1 23·9 1·57 16·7ab 15·4ab 13·9b 17·8a 0·71 ** *
Methane 23·6 23·1 1·23 25·5 23·7 22·9 25·7 0·91
Heat (corrected)‡ 130·9 127·0 6·14 127·1 120·9 115·4 134·9 7·65
Total loss 283·7 282·1 9·20 292·2 269·7 259·6 293·3 11·20
Energy retention (RE; MJ/day)
Milk 89·1 83·5 6·56 86·8 73·6 76·5 78·6 3·58 *** Body 219·4 21·9 7·22 8·7 6·4 20·9 27·2 13·36 Total 69·7 81·5 8·61 95·5 79·9 75·6 71·4 13·72 k Utilization of GE (MJ/MJ) DE/GE 0·701 0·702 0·0203 0·683 0·685 0·675 0·684 0·0167 ME/GE 0·565 0·573 0·0195 0·573 0·572 0·563 0·563 0·0216 RE/GE 0·252 0·230 0·0128 0·224 0·211 0·228 0·218 0·0091 ** Utilization of ME (MJ/MJ) RE/ME 0·447 0·401 0·0250 0·392 0·372 0·406 0·393 0·0257 k kL§ 0·618 0·620 0·0068 0·621 0·620 0·617 0·617 0·0076 a,b
Least-square means in the same row with different superscript are significantly different (P , 0·05).
†WF, white-clover ryegrass fresh; RF, red-clover ryegrass fresh; WS, white-clover ryegrass silage; RS, red-clover ryegrass silage; GS, ryegrass silage; GS þ , ryegrass silage and maize gluten. LS, lactation stage, two classes of # 100, and $ 101 days in lactation.
‡Corrected for heat produced by fermentation (Chwalibog et al., 1996). §Efficiency of ME utilization for lactation; calculated using k
L¼ 0·35 £ (ME/GE) þ 0·420 (AFRC, 1993). k
Approaching significance (P , 0·1).
Table 5 Blood plasma concentrations of metabolites, enzymes and hormones of dairy cows given diets based on fresh forage (experiment 1) and ensiled forage (experiment 2)†
Experiment 1 Experiment 2
Diets‡
Signifi-cance
Diets‡
Signifi-cance
WF RF s.e. Diet LS† WS RS GS GS þ s.e. Diet LS†
Glucose (mmol/l) 3·07 3·01 0·085 § 3·05 3·28 3·12 3·05 0·071
Insulin (pmol/l) 45·8 57·5 7·90 56·7 74·1 82·0 70·6 12·71
Non-esterified fatty acids (mmol/l) 220 179 51·37 163 155 177 145 39·4
Triglycerides (mmol/l) 196 196 10·3 171 178 176 178 9·44 ß-OH-butyrate (mmol/l) 590·4 573·1 30·07 * 592·7 452·5 493·6 537·1 36·09 § Protein (g/l) 78·6 79·8 2·61 78·9 75·6 83·1 79·8 2·36 Albumin (g/l) 38·0 38·7 0·89 § 40·2 39·8 38·3 40·0 1·00 Urea (mmol/l) 6·51 6·65 0·93 7·00 6·10 5·69 7·59 0·542 § Creatinine (mmol/l) 67·9 67·7 3·50 § 73·1 77·7 77·7 74·1 2·53
Alanine aminotransferase (U/l) 14·0 14·6 1·24 14·3 13·5 12·6 12·7 1·67
Aspartate aminotransferase (U/l) 66·1 63·1 3·74 61·8 63·1 66·9 72·8 3·80
†All variables were tested with their baseline values as covariables in the model.
‡WF, white-clover ryegrass fresh; RF, red-clover ryegrass fresh; WS, white-clover ryegrass silage; RS, red-clover ryegrass silage; GS, ryegrass silage; GS þ , ryegrass silage & maize gluten. LS, lactation stage, two classes of #100, and $101 days in lactation.
§
for these clovers when harvested at similar growth stage (RAP, 1999). The digestibility of ADF, but not those of OM and NDF, were slightly higher for the white clover compared with the red clover diets in both experiments, and, in exper-iment 2, there was no clear difference in ADF digestibility to the ryegrass-silage based diets. Dewhurst et al. (2003a) confirms our findings by their observation that red clover silage and grass/legume silage mixtures (1:1 on DM basis) had quite similar digestibilities as grass silage. The similar digestibility levels obtained across diets in the present study may be partly explained by the inclusion of the concentrate, which could have masked a possible effect of forage type on the digestibility of nutrients. Noticeable was the high DM content of the ryegrass silage, which was caused by the intensive wilting, due to the dry weather conditions of sum-mer 2003. This may have likely caused for incomplete fer-mentation during ensiling and may have caused for the rather high pH value (6·0) of the resulting silage. Further-more, the incomplete fermentation might have restricted protein degradation in the silage. In contrast, wilting of the clover forages resulted into less high DM contents of the silages compared with ryegrass silage.
The L. perenne grown for this study had a high CP content (244 and 206 g/kg DM of fresh and ensiled grass, respect-ively) which was similar to that of the red clover. Valk (1994) reported a CP content of 275 g/kg DM of fresh her-bage mainly (850 g/kg) composed of L. perenne and ferti-lized at a rate of 400 kg N per ha per year. The fields of ryegrass in our experiment were not intensively fertilized, but N mineralization in the soil after ploughing the former grass leys may have made additional N available for the newly sown grass. The slightly inferior feed quality (higher NDF and ADF contents, lower digestibilities and, on aver-age, lower CP contents) of the diets of experiment 2 com-pared with those of experiment 1 reflect the losses during harvest and ensiling thus reducing the feeding value relative to that of the original crop.
Effects of clover species and addition on intake and performance
Forage DMI and total DMI were similar in experiment 1 for both WF and RF diets, consistent with the similar nutritional composition of the two diets. In experiment 2, forage DMI (at similar hay intake across all groups of 1·55 ^ 0·10 kg/day on average) was significantly higher for the WS diet compared with the ryegrass silage diets (GS and GS þ ); this also reflected differences among diets in total DMI, although these were not significant. Our results agree with results of Dewhurst et al. (2003a), who also found a higher DMI in dairy cows given white clover silage in combination with ryegrass silage (1:1 on DM basis) com-pared with a grass silage diet. They observed that the higher voluntary DMI with the white clover silage based diet was facilitated by the high ruminal digesta passage rate, which was supposed to have been related to anatomical features of white clover differening from those of ryegrass. Another explanation for the higher DMI with the WS diet compared with the GS and GS þ diets in our experiment may have been the lower NDF content of the WS diet com-pared with GS and GS þ . NDF determines the gut filling
capacity of forages, and is therefore widely acknowledged as a main characteristic for determination and prediction of voluntary intake. All these factors should also have similarly facilitated forage DMI in the RS diet over GS and GS þ diets but values were only intermediate between WS and grass diets. The slightly lower ADF digestibility of the RS compared with the WS diet might help to explain this since ruminal retention time of the food is then increased thus lim-iting gut filling capacity and DMI. Between experiments 1 and 2, we observed a similar DMI for WF, RF, and WS diets and a slightly lower DMI for the RS diet. A decrease in voluntary DMI may occur when ensiled foods are given to ruminants compared with fresh forages. Charmley (2001) suggested that rumen ammonia concentration, rather than fermentation acids, pH, and DM content, may be respon-sible for the limited DMI with ensiled forages, and ammonia is enhanced by the typically high proportion of soluble pro-tein present in silages. If this would have been effective in the present experiment at all, this has been widely counter-balanced by a reduction of protein solubility due to intensive wilting and the higher CP content of the fresh relative to the ensiled forages.
With regard to milk yield and composition, the results reflect our intention to provide cows with diets that would meet the animals’ NELrequirements for maintenance and milk yield.
Additionally to this, differences in nutritional composition (e.g., fibre content) among the diets within experiment were most probably too small to elicit significant differences in milk yield and composition. The numerically higher milk yield for the WF and WS diets compared with the other diets in experiment 1 and 2 was mainly the result of initial differences in milk yield between these two groups of animals.
Effects of clover species and addition on energy supply and utilization
Intake of energy (gross, digestible and metabolizable energy) as well as energy retention (total and milk) were similar across groups and the small numerical differences are in line with those seen in feed intake and milk yield in experiment 2, with a slight favour of the WS diet over the others. Additionally, energy balance data allowed a more detailed look on where digestive and metabolic losses and utilization were specifically affected. In both experiments, differences between diets supplemented with white or red clover were small in energy turnover and plasma variables related to energy metabolism, this although the type of for-age may affect the amount of ME lost as heat and gained as net energy. Obviously, differences in plant chemical and rumen physical characteristics between forages have not resulted in major differences in ruminal fermentation and energy utilization.
There were only minor differences in energy intake and util-ization between legume-supplemented and unsupplemented diets in experiment 2. Varga et al. (1990) concluded from their study that ME from grass silage is used less efficiently than ME from alfalfa silage when harvested at similar growth phases. This was not the case in the present study where kLwas similar in all diets of both experiment and was
within the range expected for ryegrass-silage based diets (Yan et al., 1997). The variable most affected by diet and especially legume supplementation, was urinary energy loss which was closely associated with CP intake and therefore N excess (this is obvious also in comparison of the two experiments). A concomitant numerical increase was also seen in heat energy loss in line with the extra net energy being required for the hepatic conversion of plasma ammo-nia N to urea N and lost as heat (0·84 MJ of NELper 100 g
of excess CP (Twigg and Van Gills, 1988)). Part of such an increase in heat production may also result from protein synthesis and substrate cycling within the animal (Varga et al., 1990).
Most cows lost weight during the time between the base-line data week and the experimental collection week. The calculated NEL intake was slightly below the NEL
require-ments, but the deficiency in NEL supply over
require-ments was still in the range given by the Swiss guidelines for dairy cow nutrition (RAP, 1999) to be toler-ated for the stages of lactation the cows were in. From the blood plasma variables there is no indication for a serious metabolic energy deficiency in any diet of the present study. The plasma glucose concentrations laid between concentrations observed by Fernandez et al. (1990) and those of healthy cows in other studies (Leroy et al., 2004; Accorsi et al., 2005). Plasma insulin levels showed relative large numerical differences between diets with high individual variation, but were in the range reported by Leroy et al. (2004) and Accorsi et al. (2005). There were some weak, but not very clear, diet effects on plasma levels of NEFA, BHB, and triglycerides. The NEFA levels were as expected for cows in this stage of lactation (Accorsi et al., 2005). Levels of BHB were rather high compared with the 0·33 mmol/l reported by Leroy et al. (2004) but were still far below the threshold measured for ketosis by Veenhuizen et al. (1991), who measured a peak concentration of about 3·46 mmol/l (obtained from graph) 1 week before clinical signs of ketosis were detected. The WF cows, having the numeri-cally highest LW loss and most negative body energy balance, also showed high NEFA and BHB levels com-pared with the RF group. It could be that in this diet cows were predominantly directing nutrients for milk syn-thesis rather than for maintaining body reserves.
Effects of clover species and addition on protein supply and utilization
Supplementation of the two legume species might have resulted in two types of effect: improvement of the supply of metabolizable protein and modification of metabolic N load. Theoretical calculations of actual intake over requirements of PDIE resulting from tabulated values on fermentable OM and rumen undegradable CP showed that PDIE require-ment was theoretically deficient with ryegrass silage and barley by proportionately 0·05. The addition of clovers or maize gluten concentrate (P , 0·001) to the ryegrass diet resulted in an excess of PDIE. The lack of effect on protein utilization with extra maize gluten in diet GS þ and in indicative plasma variables suggests that PDIE supply of the cows was sufficient even without clover or maize gluten.
Plasma concentration of protein was as high as given by Leroy et al. (2004) with 82 g/l found in dairy cows in good health. Albumin is the major protein that circulates in the bloodstream and, like total blood protein, indicated a good protein status of the cow. There was obviously also no major difference among groups in muscle tissue breakdown to provide protein for milk production as can be seen from the unchanged plasma creatinine levels. This situation made it difficult to identify any extra legume effect on the supply of metabolizable protein.
All diets contained excessive dietary N as is obvious from the ratio of intake over requirements for PDIN calculated from intake of degradable and undegradable CP. The fresh forage diets (experiment 1) showed the highest ratios, and the ryegrass silage diets (except the ryegrass silage diet with maize gluten concentrate) the lowest ratio. It was obvious that both high forage CP contents and unused rumen-undegradable protein from the maize gluten concen-trate contributed similarly to the PDIN excess. The high dietary CP content of the legumes, which were even slightly exceeding those of the high-protein grass, and the lack of response in milk protein yield, led for both legumes to a trend to declining protein utilization in line with the known inverse relationship between N intake and utilization (Steinshamn et al., 2002). Bertilsson and Murphy (2003) showed that, whilst clover and clover-grass mixture silages gave higher voluntary DMI than grass silage, the resulting increase in N intake led to reductions in the efficiency of conversion of dietary N to milk N. Noticeable was the low protein utilization for the fresh forage diets compared with the legume-supplemented silage diets, too, as the first resulted in a particularly high N load. Both, plasma and milk urea are indicators of metabolic N excess as it is syn-thesized in the liver not only from amino acid catabolism in the liver but, in the situation of excess, mainly from ammo-nia produced in the rumen (Lobley and Milano, 1997). Hence, when no excessive amino acid supply is taking place, urea reflects the extent of CP degradation in the rumen (Broderick and Clayton, 1997). However, the results of the GS þ group with numerically comparably high plasma and milk urea levels, which must have resulted from excessive plasma amino acid and not ammonia levels, shows that it is not possible to clarify whether the CP provided by the legumes in the present study was prone to a high ruminal degradation or provided extra amino acids in metabolism which were not really required. Therefore also the supply of individual metabolizable amino acids remains unknown for the clovers. In all legume-sup-plemented diets, as opposed to the unsuplegume-sup-plemented rye-grass silage diet (GS), plasma urea values were rather high in line with an excessive dietary CP supply. Leroy et al. (2004) measured 4·0 mmol plasma urea/l in healthy dairy cows while in our study levels were between 6·08 and 7·15 mmol/l. Despite these high levels of plasma urea, likely due to high plasma ammonia loads, liver function was obviously not affected as can be seen from the plasma activities of the liver enzymes, ASAT and ALAT, being in a normal range (Kauppinen, 1984). Additionally, concentrations of blood glucose were reasonably high, which further confirms the presence of a normal liver func-tion (Fernandez et al., 1990).
Conclusions
The results from this study indicate that supplementation of white clover to a ryegrass-based diet has widely the same effect or may be slightly superior to red clover when har-vested at the same vegetative stage in terms of intake, per-formance and metabolic nutrient and energy utilization of dairy cows. It remains to be tested whether cows separately offered these forages would express a preference for one of these clovers thus provoking an indirect difference in feed-ing value. The low utilization of the extra protein sup-plemented with maize gluten did not allow to definitely clarify whether white and/or red clover, when supplemented to a moderate-protein fresh or ensiled ryegrass, would have really contributed to metabolic protein supply or would have mainly increased metabolic N load. Since metabolizable protein was not clearly limiting, both fresh and ensiled clo-ver-ryegrass mixtures resulted in a somewhat less efficient protein utilization compared with a ryegrass-silage-based diet. This was accompanied by an extra energy loss caused by urea formation and excretion in urine, which was more prominent for the fresh clover-ryegrass mixtures than for the corresponding silages. Balancing of high-protein clover-rye-grass based diets with energy sources (low-protein hay, cereals) is to be recommended in order to be able to profit from presumed beneficial clover effects on fatty acid profile in the milk (Dewhurst et al., 2003a and b) and from the environmental friendliness of the entire crop-livestock system.
Acknowledgements
We would like to thank the staff of the ETH research station Cha-mau and the students, Daniel Fro¨hlich, Barbara Mosimann, Nicola Hartmann, and Ce´line Cle´ment, for their assistance during this experiment. We are grateful to Carmen Kunz, Muna Mergani, and William Moses for assisting in the laboratory analyses. This study was supported by the State Secretariat for Education and Research, Berne (SER) and is part of the COST Action 852 ‘Quality Legume-Based Forage Systems for Contrasting Environments’.
References
Abberton, M. T. and Marshall, A. H. 2005. Progress in breeding perennial clovers for temperate agriculture. Journal of Agricultural Science 143: 117-135.
Accorsi, P. A., Govoni, N., Gaiani, R., Pezzi, C., Seren, E. and Tamanini, C. 2005. Leptin, GH, PRL, insulin and metabolic parameters throughout the dry period and lactation in dairy cows. Reproduction of Domesticated Animals 40: 217-223.
Agricultural and Food Research Council. 1993. Energy and pro-tein requirements of ruminants. CAB International, Wallingford, UK. Bertilsson, J. and Murphy, M. 2003. Effects of feeding clover silages on feed intake, milk production and digestion in dairy cows. Grass and Forage Science 58: 309-322.
Broderick, G. A. and Clayton, M. K. 1997. A statistical evaluation of animal and nutritional factors influencing concentrations of milk urea nitrogen. Journal of Dairy Science 80: 2964-2971.
Broderick, G. A., Walgenbach, R. P. and Maignan, S. 2000. Performance of lactating dairy cows fed alfalfa or red clover silage as the sole forage. Journal of Dairy Science 83: 1543-1551. Broderick, G. A., Walgenbach, R. P. and Maignan, S. 2001. Production of lactating dairy cows fed alfalfa or red clover silage at equal dry matter or crude protein contents in the diet. Journal of Dairy Science 84: 1728-1737.
Brouwer, E. 1965. Report of subcommittee on constants and factors. In Energy metabolism of farm animals (ed. K. L. Blaxter),
third symposium on energy metabolism. EAAP publication no. 11, pp. 441-443. Academic Press, London, UK.
Cammell, S. B., Thomson, D. J., Beever, D. E., Haines, M. J., Dhanoa, M. S. and Spooner, M. C. 1986. The efficiency of energy utilisation in growing cattle consuming fresh perennial ryegrass (Lolium perenne cv. Melle) or white clover (Trifolium repens cv. Blanca). British Journal of Nutrition 55: 669-680.
Charmley, E. 2001. Towards improved silage quality – a review. Canadian Journal of Animal Science 81: 157-168.
Chwalibog, A., Jensen, K. and Thorbeck, G. 1996. Oxidation of nutrients in bull calves treated with b-adrenergic agonists. Archives of Animal Nutrition 49: 255-261.
Dewhurst, R. J., Evans, R. T., Scollan, N. D., Moorby, J. M., Merry, R. J. and Wilkins, R. J. 2003a. Comparison of grass and legume silages for milk production. 2. In vivo and in sacco evalu-ations of rumen function. Journal of Dairy Science 86: 2612-2621. Dewhurst, R. J., Fisher, W. J., Tweed, J. -K. S. and Wilkins, R. J. 2003b. Comparison of grass and legume silages for milk pro-duction. 1. Production responses with different levels of concen-trate. Journal of Dairy Science 86: 2598-2611.
Fernandez, J. M., Croom, W. J., Tate, L. P. and Johnson, A. D. 1990. Subclinical ammonia toxicity in steers: effects on hepatic and portal-drained visceral flux of metabolites and regulatory hormones. Journal of Animal Science 68: 1726-1742.
Frame, J., Charlton, J. F. L. and Laidlaw, A. S. 1998. Temperate forage legumes. CAB International, Wallingford, UK.
Harris, S. L., Auldist, M. J., Clark, D. A. and Jansen, E. B. L. 1998. Effects of white clover content in the diet on herbage intake, milk production and milk composition of New Zealand dairy cows housed indoors. Journal of Dairy Research 65: 389-400.
Hindrichsen, I. K., Wettstein, H.-R., Machmu¨ller, A., Bach Knud-sen, K. E., MadKnud-sen, J. and Kreuzer, M. 2006. Digestive and meta-bolic utilisation of dairy cows supplemented with concentrates characterised by different carbohydrates. Animal Feed Science and Technology 126: 43-61.
Hoffmann, L. and Klein, M. 1980. Die Abha¨ngigkeit der Harnerger-gie vom Kohlenstoff- und Stickstoffgehalt im Harn bei Rindern, Schafen, Schweinen und Ratten. Archiv fu¨r Tierernaehrung 30: 743-750.
Jones, B. A. 1995. Screening legume forages for soluble phenols, polyphenol oxidase and extract browning. Journal of the Science of Food and Agriculture 67: 109-112.
Kauppinen, K. 1984. ALAT, AP, ASAT, GGT, OCT activities and urea and total bilirubin concentrations in plasma of normal and keto-tic dairy cows. Zentralblatt fu¨r Veterinaermedizin, A 31: 567-576. Leroy, J. L. M. R., Vanholder, T., Delanghe, J. R., Opsomer, G., Van Soom, A., Bols, P. E. J. and De Kruif, A. 2004. Metabolite and ionic composition of follicular fluid from different-sized follicles and their relationship to serum concentrations in dairy cows. Animal Reproduction Science 80: 201-211.
Lobley, G. E. and Milano, G. D. 1997. Regulation of hepatic nitro-gen metabolism in ruminants. Proceedings of the Nutritional Society 56: 547-563.
McMurray, C. H., Blanchflower, W. J. and Rice, D. A. 1984. Automated kinetic method for D-3-hydroxybutyrate in plasma or serum. Clinical Chemistry 30: 421-425.
Naumann, K. and Bassler, R. 1997. Die chemische Untersuchung von Futtermitteln. Methodenbuch. Vol. 3. VdLUFA-Verlag, Darm-stadt, Germany.
Rochon, J., Doyle, C. J., Greef, J. M., Hopkins, A., Molle, G., Sitzia, M., Scholefield, D. and Smith, C. J. 2004. Grazing legumes in Europe: a review of their status, management, benefits, research needs and future prospects. Grass and Forage Science 59: 197-214.
Sjaunja, L. O., Baevre, L., Junkkarinen, L., Pedersen, J. and Setala, J. 1991. A Nordic proposal for an energy corrected milk (ECM) formula. In Performance recording of animals: state of the art 1990 (ed. P. Gaillon and Y. Chabert), EAAP publication no. 50, pp. 156-157. Centre for Agricultural Publishing and Documentation, Wageningen, The Netherlands.
Station Federale de Recherches en Production Anima´le. 1999. Fuetterungsempfehlungen und Naehrwerttabellen fu¨r Wiederkaeuer [Feeding recommendations and nutrient tables for ruminants, fourth edition.] Landwirtschaftliche Lehrmittelzentrale, Zollikofen, Switzerland
Statistical Analysis Systems Institute. 1999 – 2001. SAS/STAT user’s guide: statistics, version 8·2. Statistical Analysis Systems Institute Inc., Cary, NC.
Steinshamn, H., Garmo, T., Thuen, E., Brenoe, U. T. and Gron-myr, F. 2002. Nitrogen utilisation on pasture in organic milk production. Grassland Science in Europe 7: 734-735.
Twigg, J. R. and Van Gils, L. G. M. 1988. Practical aspects of feeding protein to dairy cows. In Recent Developments in Ruminant Nutrition (ed. W. Haresign and D. J. A. Cole), pp. 196-212. Butters-worth, London, England.
Valk, H. 1994. Effects of partial replacement of herbage by maize silage on N utilization and milk production of dairy cows. Livestock Production Science 40: 241-250.
Van Soest, P. J., Robertson, J. B. and Lewis, B. A. 1991. Methods for dietary fiber, neutral detergent fiber, and nonstarch
polysaccharides in relation to animal nutrition. Journal of Dairy Science 74: 3583-3597.
Varga, G. A., Tyrrell, H. F., Huntington, G. B., Waldo, D. R. and Glenn, B. P. 1990. Utilization of nitrogen and energy by Holstein steers fed formaldehyde- and formic acid-treated alfalfa or orchardgrass silage at two intakes. Journal of Animal Science 68: 3780-3791.
Veenhuizen, J. J., Drackley, J. K., Richard, M. J., Sanderson, T. P., Miller, L. D. and Young, J. W. 1991. Metabolic changes in blood and liver during development and early treatment of exper-imental fatty liver and ketosis in cows. Journal of Dairy Science 74: 4238-4253.
Yan, T., Gordon, F. J., Agnew, R. E., Porter, M. G. and Patter-son, D. C. 1997. The metabolisable energy requirement for main-tenance and the efficiency of utilisation of metabolisable energy for lactation by dairy cows offered grass silage-based diets. Livestock Production Science 51: 141-150.