Estimation of percentage body fat in 6- to 13-year-old children by skinfold
thickness, body mass index and waist circumference
Susi Kriemler
1*, Jardena Puder
2, Lukas Zahner
3, Ralf Roth
3, Ursina Meyer
3and Giorgio Bedogni
41Institute of Social and Preventive Medicine at Swiss Tropical and Public Health Institute, University of Basel, Basel, Switzerland
2Division of Endocrinology, Diabetes and Metabolism, Centre Hospitalier Universitaire Vaudoise, University of Lausanne,
Lausanne, Switzerland
3Institute of Exercise and Health Sciences, University of Basel, Basel, Switzerland
4Clinical Epidemiology Unit, Liver Research Centre, Basovizza, Trieste, Italy
(Received 3 September 2009 – Revised 12 May 2010 – Accepted 14 May 2010 – First published online 12 July 2010)
We evaluated the accuracy of skinfold thicknesses, BMI and waist circumference for the prediction of percentage body fat (PBF) in a represen-tative sample of 372 Swiss children aged 6 – 13 years. PBF was measured using dual-energy X-ray absorptiometry. On the basis of a preliminary bootstrap selection of predictors, seven regression models were evaluated. All models included sex, age and pubertal stage plus one of the following predictors: (1) log-transformed triceps skinfold (logTSF); (2) logTSF and waist circumference; (3) log-transformed sum of triceps and subscapular skinfolds (logSF2); (4) log-transformed sum of triceps, biceps, subscapular and supra-iliac skinfolds (logSF4); (5) BMI; (6) waist circumference; (7) BMI and waist circumference. The adjusted determination coefficient (R2
adj) and the root mean squared error (RMSE; kg) were calculated for each model. LogSF4 (R2
adj 0·85; RMSE 2·35) and logSF2 (R 2
adj0·82; RMSE 2·54) were similarly accurate at predicting PBF and superior to logTSF (R2
adj0·75; RMSE 3·02), logTSF combined with waist circumference (R2adj0·78; RMSE 2·85), BMI (R2adj 0·62; RMSE 3·73), waist circumference (R2
adj 0·58; RMSE 3·89), and BMI combined with waist circumference (R2adj 0·63; RMSE 3·66) (P, 0·001 for all values of R2
adj). The finding that logSF4 was only modestly superior to logSF2 and that logTSF was better than BMI and waist circumference at predicting PBF has important implications for paediatric epidemiological studies aimed at disentangling the effect of body fat on health outcomes.
Children: Body composition: Dual-energy X-ray absorptiometry: Body mass index: Waist circumference: Skinfold thickness: Regression analysis
The measurement of body composition is a central topic of current paediatric research because of its association with
health and disease in infancy, childhood and adulthood(1 – 3).
Such an assessment is also important to investigate the
effect of lifestyle interventions on fat and fat-free tissues(4).
Body fat is most commonly estimated from anthropometric
measurement(5,6). BMI is often used as a surrogate marker but
does not provide an accurate assessment of body fat, and this
is especially true in children and adolescents(7 – 9). Waist
circumference is gaining popularity as an indicator of childhood obesity but it is more related to visceral fat than
to total body fat(10,11). Skinfold thicknesses have long been
used as measures of subcutaneous fat and are usually more
accurate than BMI at predicting body fat(12). Although
skinfolds are not recommended for routine clinical use in
children(6,7), they can be very useful in the epidemiological
setting whenever a measure of body fat more accurate than
BMI is needed to disentangle the effects of fat and fat-free
tissues on health outcomes(13,14).
The four-compartment model has been used to cross-validate portable techniques such as anthropometry and bioelectrical impedance analysis in small samples of children under
laboratory conditions(3). However, this reference model is not
suitable for use in epidemiological studies because of its complexity and cost. Although not a ‘gold standard’ method for the assessment of body composition, dual-energy X-ray absorptiometry (DXA) compares well with the four-component model (i.e. adjusted regression between fat mass by the two
methods does not deviate from the line of identity)(15,16), is
more readily available and is being increasingly used for clinical
and epidemiological applications(3,17,18). However, DXA is
not portable and uses ionising radiation so that it is mainly used to validate indirect techniques that are then used to
assess body composition(19).
* Corresponding author: Professor Susi Kriemler, fax þ 41 44 493 53 54, email susi.kriemler@unibas.ch
Abbreviations:AVENA, Alimentacio´n y Valoracio´n del Estado Nutricional de los Adolescentes; CCC, concordance correlation coefficient; DXA, dual-energy X-ray absorptiometry; KISS, Kinder-Sportstudie; logSF2, log-transformed sum of triceps and subscapular skinfolds; logSF4, log-transformed sum of triceps, biceps, subscapular and supra-iliac skinfolds; logTSF, log-transformed triceps skinfold; PBF, percentage body fat; R2
adj, adjusted coefficient of determination; RMSE, root mean squared error; SDS, standard deviation score.
qThe Authors 2010
British
Journal
of
To date, most calibration studies of anthropometry have
been performed in convenience samples of children(19 – 22).
Only one study has been performed in a representative sample of adolescents (aged 13 – 18 years) from the general population and it focused on the validation of external
algor-ithms(23). Thus, there is a clear need of studies evaluating
the accuracy of anthropometry as an index of body fat in representative samples of children.
The Kinder-Sportstudie (KISS) is a randomised controlled trial aimed to test whether a physical activity programme can improve body composition, physical activity, physical fitness and quality of life in a representative sample of 6- to
13-year-old Swiss children(24). The baseline data of the
KISS study offered the unique opportunity to cross-validate anthropometry against DXA in a representative sample of the general paediatric population. The aim of the present study was, therefore, to compare the accuracy of BMI, waist circumference and skinfold thicknesses for the assessment of percentage body fat (PBF) in the KISS children.
Methods Study design
The study protocol of KISS (ISRCTN 15360785) is described
in detail elsewhere(24). Briefly, the KISS children were
ran-domly selected and stratified by class, geographic area and ethnicity to be representative of Swiss children with respect to sex, sociodemographic status and BMI. The baseline data, collected in the summer of 2005, were used for the present analysis. Informed consent was obtained verbally from each child and written consent was obtained by at least one parent. The study was conducted according to the Declaration of Helsinki and was approved by the Ethical Committee of the University of Basel, the Cantonal Ethical Committee of Aargau and the Swiss Federal Institute of Technology.
Subjects
A total of 502 of 540 children agreed to participate. Complete data were available for 497 children and 372 of them (75 %) had both DXA and anthropometry measured and were evalu-ated for the present study. The lack of DXA measurements for 125 (25 %) of the children was due to the request of their parents that they were not exposed to ionising radiation. The option to refuse DXA measurements was explicitly recognised by the study protocol and systematically offered during the study. Anthropometry and DXA measurements were per-formed within 2 d as described below.
Anthropometric evaluation and pubertal assessment
Anthropometric measurements were performed by two
experienced operators as described in detail elsewhere(24).
Briefly, body weight was measured to the nearest 5 g using an electronic scale (Seca, Basel, Switzerland) and standing height to the nearest 2 mm using a wall-mounted stadiometer (Seca). Waist circumference was measured to the nearest 1 mm using a flexible tape midway between the lowest rib and the iliac crest. Skinfold thickness was measured in triplicate to the nearest 1 mm using a Harpenden calliper
(British Indicators, Burgess Hill, West Sussex, UK) at the triceps, biceps, subscapular and supra-iliac sites following
the Anthropometric Standardization Reference Manual(25).
The mean of the three measurements was used for analysis. The inter-operator technical error of measurement for skinfolds, as determined by a preliminary study performed by the two study operators on thirty-six children, was 1·0 mm for triceps skinfold, 1·1 mm for biceps skinfold, 1·4 mm for subscapular skinfold and 2·9 mm for supra-iliac skinfold, with corresponding coefficients of reliability $ 0·91. These values are within the suggested limits of tolerance and are
in agreement with other paediatric studies(26,27). BMI was
cal-culated and transformed into standard deviation scores (SDS)
using the 1990 UK reference data(28). Overweight and obesity
were determined by the International Obesity Task Force
classification system(29). The triceps and subscapular skinfolds
were summed to obtain the sum of two skinfolds (SF2) and the biceps, triceps, subscapular and supra-iliac skinfolds were
summed to obtain the sum of four skinfolds (SF4)(12,30,31).
Pubertal stage was self-assessed using Tanner’s criteria(24,32).
Dual-energy X-ray absorptiometry
The three-compartment DXA model separates body mass into
lean tissue mass, fat mass and bone mineral content(33). DXA
was performed by the same operator using an Hologic QDR-4500 densitometer (Hologic, Waltham, MA, USA) coupled with paediatric software. Head measurements were excluded from the calculation of body composition. The DXA scanner was calibrated daily against a standard phantom provided by the manufacturer. PBF was calculated as (fat mass/body weight) £ 100.
Statistical analysis
Normally distributed variables are given as mean values and standard deviations, and minimum and maximum values. Variables that were not normally distributed (skinfolds) were log-transformed using natural logarithms to achieve or better approach the normal distribution (Shapiro – Wilk test) and are given as geometric mean and minimum and maximum values. Between-group comparisons of continuous variables were performed using unpaired Student’s t tests on untrans-formed values for normally distributed variables and on
log-transformed values for not normally distributed variables(34).
Between-group comparisons of categorical variables were per-formed using Fisher’s exact test. We selected eight potential predictors of PBF for evaluation: sex (male v. female), age (continuous), pubertal stage (Tanner stage 1 v. stages 2 – 5), BMI (continuous), waist circumference (continuous), log-transformed triceps skinfold (logTSF; continuous), log-trans-formed sum of triceps and subscapular skinfolds (logSF2; continuous) and log-transformed sum of triceps, biceps, sub-scapular and supra-iliac skinfolds (logSF4; continuous). Potential predictors were chosen on the basis of the following considerations: (1) sex, age and pubertal stage are major
deter-minants of body composition(18); (2) triceps skinfold is easily
accessible and does not require that the subject takes off her/ his clothes (provided that the acromion and the olecranon can be properly localised), which is an important condition in the epidemiological setting, especially for girls; (3) logSF2 is
British
Journal
of
expected to be more accurate than a single skinfold (logTSF) and is less burdensome than logSF4, which requires the
measurement of four skinfolds(12,31). The contribution of
each predictor was evaluated by measuring its bootstrap inclusion fraction at multiple backward stepwise linear regression on 1000 random samples of 372 subjects (P value
to enter¼ 0·05; P value to remove¼ 0·10)(35,36). On the basis
of the bootstrap analyses, we evaluated seven combinations of predictors. Age, sex and pubertal stage were included in all models, plus: (1) logTSF; (2) logTSF and waist ence; (3) logSF2; (4) logSF4; (5) BMI; (6) waist circumfer-ence; (7) BMI and waist circumference. Standard diagnostic tests and plots were used to check model assumptions and
fit(37). The 95 % CI of regression coefficients and measures
of model fit – adjusted determination coefficient (R2adj) and
root mean square error of the estimate (RMSE) – were calculated on 1000 bootstrap samples of 372 subjects with bias correction. In other words, the bootstrap analysis provides an internal cross-calibration on 1000 samples.
Multivariable fractional polynomials were used to test whether the fit could be improved by non-linear
transform-ations(35). Because there was no gain in fit for any model,
all continuous predictors were modelled as linear. Bland & Altman’s method was used to calculate the fixed and
proportional bias of the seven models(38). Lin’s concordance
correlation coefficient (CCC) was used as a further measure of agreement because of the presence of proportional bias(39,40). We also tested for the existence of a trend between the absolute inter-method difference and the quintiles of the average using the Jonckheere – Terpstra test for ordered alternatives (both ascending and descending). All statistical tests were two-tailed and statistical significance was set to a P value , 0·05. Statistical analysis was performed using STATA 11.0 (StataCorp, College Station, TX, USA).
Results
Of the 497 KISS children for whom age, weight and height were available, 372 (75 %) underwent anthropometry and DXA and were considered for the present study. The age of the children without DXA measurements was significantly lower than that of the children who had them available (8·6
(SD 2·2) v. 9·5 (SD 2·1) years; P, 0·001) but the distribution
of sex (P ¼ 0·520) and the SDS of weight (P ¼ 0·238), height (P ¼ 0·206) and BMI (P ¼ 0·346) was not different between the two groups (data not shown).
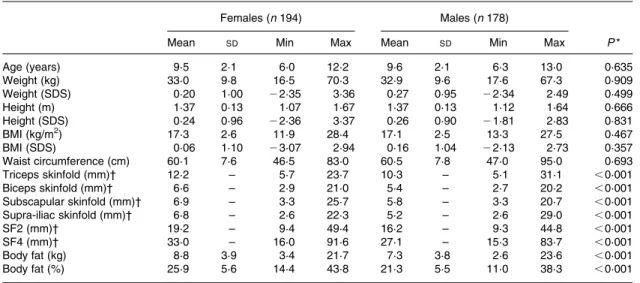
Table 1 reports the anthropometric measurements of the 372 children. Of the children, 260 (70 %) were prepubertal (117 girls and 143 boys) and 112 (30 %) children were pubertal or postpubertal (seventy-seven girls and thirty-five boys). While there was no difference in age, weight, height and BMI between males and females, total body fat and PBF, as well as single skinfolds and their sums, were significantly higher in girls. Of the children 322 (87 %) had a normal weight, forty-one (11 %) were overweight and nine (2 %) were obese according to the International Obesity Task
Force classification(29).
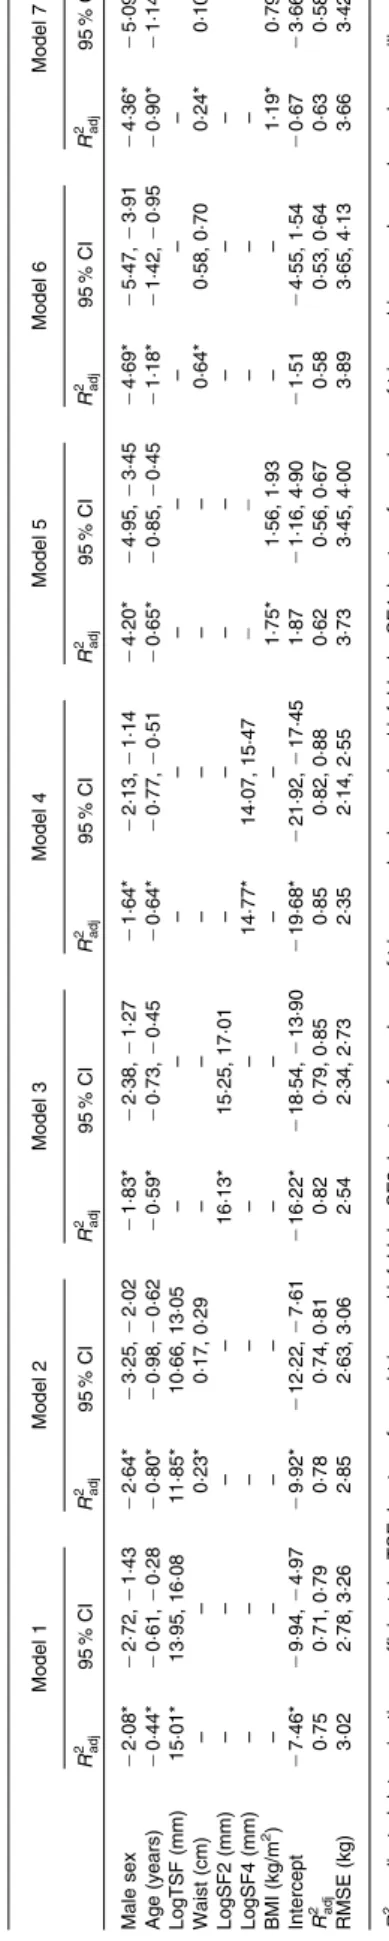
Table 2 gives the bootstrap inclusion fraction, i.e. the number of times out of 1000 that the candidate predictors were selected for inclusion in the models. In model 1, sex, age and logTSF were selected 100 % of the time while waist was selected 93 %, BMI 57 % and pubertal stage 25 % of the time. In model 2, sex, age and logSF2 were selected 100 % of the time while waist was selected 41 %, pubertal stage 25 % and BMI 21 % of the time. Last, in model 3, sex, age and logSF4 were selected 100 % of the time while BMI was selected 49 %, pubertal stage 40 % and waist 17 % of the time. In other words, waist circumference improved the prediction of PBF in the model including logTSF, while
Table 1. Measurements of the 372 children (Mean values, standard deviations and ranges)
Females (n 194) Males (n 178)
Mean SD Min Max Mean SD Min Max P *
Age (years) 9·5 2·1 6·0 12·2 9·6 2·1 6·3 13·0 0·635 Weight (kg) 33·0 9·8 16·5 70·3 32·9 9·6 17·6 67·3 0·909 Weight (SDS) 0·20 1·00 22·35 3·36 0·27 0·95 22·34 2·49 0·499 Height (m) 1·37 0·13 1·07 1·67 1·37 0·13 1·12 1·64 0·666 Height (SDS) 0·24 0·96 22·36 3·37 0·26 0·90 21·81 2·83 0·831 BMI (kg/m2) 17·3 2·6 11·9 28·4 17·1 2·5 13·3 27·5 0·467 BMI (SDS) 0·06 1·10 23·07 2·94 0·16 1·04 22·13 2·73 0·357 Waist circumference (cm) 60·1 7·6 46·5 83·0 60·5 7·8 47·0 95·0 0·693 Triceps skinfold (mm)† 12·2 – 5·7 23·7 10·3 – 5·1 31·1 ,0·001 Biceps skinfold (mm)† 6·6 – 2·9 21·0 5·4 – 2·7 20·2 ,0·001 Subscapular skinfold (mm)† 6·9 – 3·3 25·7 5·8 – 3·3 20·7 ,0·001 Supra-iliac skinfold (mm)† 6·8 – 2·6 22·3 5·2 – 2·6 29·0 ,0·001 SF2 (mm)† 19·2 – 9·4 49·4 16·2 – 9·3 44·8 ,0·001 SF4 (mm)† 33·0 – 16·0 91·6 27·1 – 15·3 83·7 ,0·001 Body fat (kg) 8·8 3·9 3·4 21·7 7·3 3·8 2·6 23·6 ,0·001 Body fat (%) 25·9 5·6 14·4 43·8 21·3 5·5 11·0 38·3 ,0·001
Min, minimum value; Max, maximum value; SDS, standard deviation score; SF2, sum of triceps and subscapular skinfolds; SF4, sum of triceps, biceps, subscapular and supra-iliac skinfolds.
* Student’s t test.
† Geometric mean (between-group comparison performed on log-transformed value).
British
Journal
of
neither BMI nor waist circumference improved the prediction of PBF in the models including logSF4 or logSF2.
Table 3 gives the seven prediction models selected for further evaluation on the basis of the previous analysis. As
determined by R2
adjand RMSE, models 3 and 4 were similarly
accurate and better than models 1, 2, 5, 6 and 7.
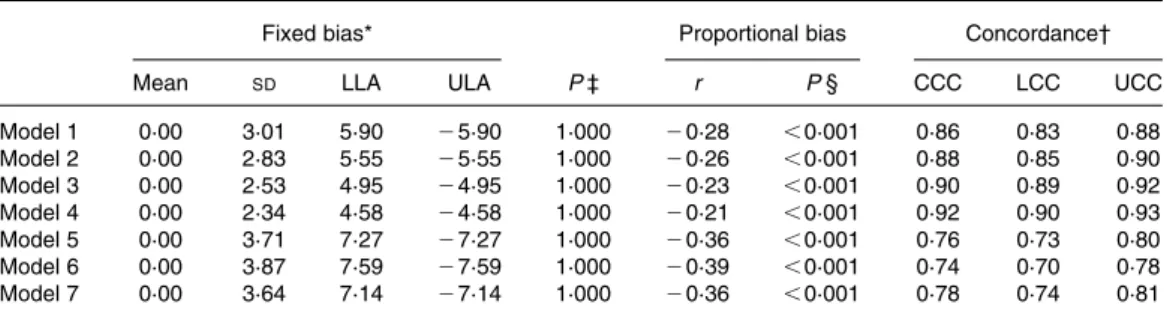
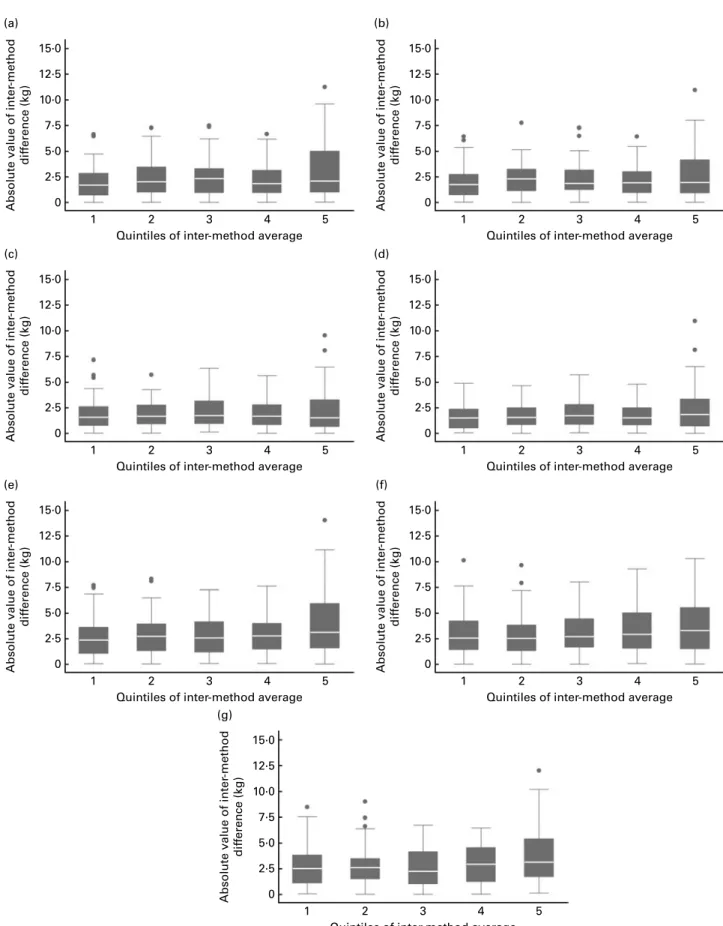
Table 4 reports the fixed and proportional bias and the CCC for the seven prediction models. The fixed bias, i.e. the mean inter-method difference, was 0 % in all cases but the limits of agreement were narrower for models 3 and 4 than for the remaining models. Likewise, a negative proportional bias, i.e. a negative correlation between the inter-method difference and the average of the methods, was present in all cases but was lowest for models 3 and 4. Because the presence of a pro-portional bias makes the fixed bias an unreliable measure of agreement, we used CCC to evaluate agreement. CCC shows that models 3 and 4 are better than the other models at predicting PBF. The absolute inter-method difference for the respective models is shown in Fig. 1. The absolute inter-method difference showed an increasing trend for increasing quintile of the average of methods only for models 6 and 7.
Discussion
KISS allowed us to perform a novel cross-calibration study of anthropometry for the prediction of PBF in a representative sample of the general paediatric population. To date, only the Alimentacio´n y Valoracio´n del Estado Nutricional de los Adolescentes (AVENA) study has performed a validation of
anthropometry in a general population of children(23).
How-ever, the AVENA children were older (aged 13 – 18 years) than the KISS children and the main aim of the AVENA
study was to validate external algorithms(23). In the present
study, we showed that logSF2 is nearly as accurate as logSF4 and that both are better than BMI and waist circumfer-ence at estimating PBF in 6- to 13-year-old Swiss children. Although logTSF is less accurate than log2SF, it is still a better predictor of PBF than BMI, waist circumference and their combination. This has important implications for paediatric epidemiological research aiming to disentangle the effects of fat and fat-free tissues on health outcomes.
Table 2. Bootstrap selection of predictors of percentage body fat (n 372)*
Model 1 Model 2 Model 3
Sex 1000 1000 1000 Age 1000 1000 1000 Pubertal stage 246 249 395 LogTSF 1000 – – LogSF4 – – 1000 LogSF2 – 1000 – BMI 568 209 491 Waist 933 414 168
LogTSF, log-transformed triceps skinfold; logSF4, log-transformed sum of triceps, biceps, subscapular and supra-iliac skinfolds; logSF2, log-transformed sum of triceps and subscapular skinfolds.
* Values represent the bootstrap inclusion fraction, i.e. the number of times out of 1000 that the candidate predictors were selected as predictors at bootstrapped backward stepwise linear regression.
Table 3 . Comparison o f seven regression models for the p redi ction o f percentag e b o d y fat (n 372) (Regression c oefficients or measures o f model fit and 9 5 % bootstrapped confidence intervals†) Model 1 M o del 2 Model 3 Model 4 Model 5 Mode l 6 Model 7 R 2 adj 95 % C I R 2 adj 95 % C I R 2 adj 95 % C I R 2 adj 95 % C I R 2 adj 95 % C I R 2 adj 95 % C I R 2 adj 95 % C I Male sex 2 2 ·08* 2 2 ·72, 2 1· 4 3 2 2·64* 2 3· 2 5 , 2 2· 0 2 2 1 ·83* 2 2·38, 2 1·27 2 1· 6 4 * 2 2 ·13, 2 1· 1 4 2 4·20* 2 4·95, 2 3· 4 5 2 4· 6 9 * 2 5·47, 2 3·91 2 4 ·36* 2 5 ·09, 2 3·63 Age (years) 2 0 ·44* 2 0 ·61, 2 0· 2 8 2 0·80* 2 0· 9 8 , 2 0· 6 2 2 0 ·59* 2 0·73, 2 0·45 2 0· 6 4 * 2 0 ·77, 2 0· 5 1 2 0·65* 2 0·85, 2 0· 4 5 2 1· 1 8 * 2 1·42, 2 0·95 2 0 ·90* 2 1 ·14, 2 0·66 LogTSF (mm) 15 ·01* 13 ·95, 16 ·08 1 1·85* 10 ·66 , 13·05 – – – – – – – – – – Waist (cm) – – 0·23* 0 ·17 , 0 ·29 – – – – – – 0 ·64* 0·58, 0 ·70 0 ·24* 0 ·10, 0 ·38 LogSF2 (mm) – – – – 16 ·13* 15·25, 17 ·01 – – – – – – – – LogSF4 (mm) – – – – – – 14 ·77 * 14 ·07, 15·47 22 –– –– BMI (kg/m 2) – – – – – – – – 1 ·75* 1·56, 1 ·93 – – 1 ·19* 0 ·79, 1 ·58 Intercept 2 7 ·46* 2 9 ·94, 2 4· 9 7 2 9·92* 2 12 ·22 , 2 7· 6 1 2 16 ·22* 2 18·54, 2 13·90 2 19 ·68 * 2 21 ·92, 2 17 ·45 1 ·87 2 1·16, 4 ·90 2 1· 5 1 2 4·55, 1 ·54 2 0· 6 7 2 3 ·66, 2 ·32 R 2 adj 0 ·75 0 ·71, 0 ·79 0·78 0 ·74 , 0 ·81 0 ·82 0 ·79, 0 ·85 0 ·85 0 ·82, 0 ·88 0·62 0·56, 0 ·67 0 ·58 0 ·53, 0 ·64 0 ·63 0 ·58, 0 ·68 RMSE (kg) 3 ·02 2 ·78, 3 ·26 2·85 2 ·63 , 3 ·06 2 ·54 2 ·34, 2 ·73 2 ·35 2 ·14, 2 ·55 3·73 3·45, 4 ·00 3 ·89 3 ·65, 4 ·13 3 ·66 3 ·42, 3 ·91 R 2 adj , adjusted determination coefficient; logTSF, log-transform e d triceps skinfold; logSF2, log-transform e d sum of triceps and subscapul ar skinfold s; logSF4, log-transform ed sum o f triceps, b iceps, su bscapular and supra-iliac skinfolds; RMSE, root me an squ ared error. * P , 0 ·001. † 9 5 % CI were calculated using bootstrap in 1000 random samples.
British
Journal
of
Nutrition
In recent years, it has been increasingly recognised that BMI and waist circumference are not accurate measures of
body fat, especially in children(9,10). The present results are
in general agreement with other studies performed in non-representative samples of children showing that skinfolds are
better than BMI at predicting PBF(6,19 – 22,41). The present
results are also in general agreement with the AVENA study, which shows that selected skinfolds offer reasonably accurate estimates of PBF at the population level in a
repre-sentative sample of 13- to 18-year-old Spanish adolescents(23).
The most accurate prediction of PBF in the AVENA study from the sum of triceps and subscapular skinfolds was obtained using the Slaughter equation in males. However, in the KISS study, this equation was less accurate than in the AVENA study. The Slaughter equation applied to KISS
boys showed in fact a mean fixed bias of 2 5·7 (SD 2·8) %
(P, 0·001) v. one of 1·6 (SD 0·6)% in the AVENA study
and, more importantly, a substantial proportional bias (r 0·87; P, 0·001) which was absent in the AVENA study (r 0·01; P. 0·05). Despite these differences, which are likely to reflect differences in the study populations, the KISS and AVENA studies together suggest that skinfolds may be used for predicting PBF in children and adolescents.
The measurement of skinfolds is not recommended for
rou-tine evaluation of obese children(6,7). This is because skinfolds
do not add to the prediction of body fat in subjects with a BMI above the 95th percentile for age and, more importantly, to the
prognostic value of BMI(7,41 – 43). This is partially attributable
to the higher error of measurement of skinfolds at high levels of adiposity. In this respect, the lack of an association between the absolute inter-method difference and the quintiles of the average for skinfolds has to be interpreted in light of the fact that just 2 % of our children were obese, so that the well-known lower reproducibility of skinfold measurements at higher values of adiposity had a minimal effect on the
accuracy of the estimate of PBF in our population(27).
On the other hand, epidemiologists are increasingly inter-ested in evaluating the effects of fat and fat-free tissues on
health outcomes using adiposity indexes rather than BMI(44).
The present study shows that log-transformed skinfolds are much better than BMI, waist circumference and their combi-nation at estimating PBF in a general population of 6- to
13-year-old children, supporting their use as surrogate measures of body fat in epidemiological studies. The skinfolds measured in the present study were chosen because they are
the most commonly employed(18,30,31). The modest increase
of R2adj and the modest reduction of RMSE obtained by
predicting PBF from logSF4 (RMSE 2·35; 95 % CI 2·14, 2·55 kg) as compared with logSF2 (RMSE 2·54; 95 % CI 2·34, 2·73 kg) is not enough to justify the measurement of four skinfolds in an epidemiological context where time is a significant constraint. Yet, for selected epidemiological
applications, one may accept the lower Radj2 and the higher
RMSE of logTSF (RMSE 3·02; 95 % CI 2·78, 3·26 kg) as compared with log2SF by considering that the triceps skinfold is simpler and less embarrassing to measure and offers a prediction of PBF that it still better than by the use of BMI and waist circumference.
Although the present analysis of the KISS data provides novel information for the non-invasive assessment of body fat in paediatric epidemiological studies, it is not without limi-tations. First, 25 % of our children did not undergo DXA measurements. These children were younger than those with DXA, but they had the same SDS of weight, height and BMI. Thus, we are confident that the generalisability of our findings to the entire KISS population is not compromised. Second, our conclusions apply only to 6- to 13-year-old Swiss children. It is of interest, however, that the mean SDS of BMI is very close to the 50th percentile and its minimum and maximum values are within three SDS of the reference data, reflecting the distribution of anthropometry expected in the UK and possibly other Western populations. Third, DXA measurements are sensitive to soft tissue hydration. In particu-lar, PBF estimates made by DXA tend to be higher when the
hydration of the fat-free mass is low(45). However, the
magni-tude of this error under normal conditions, as in the present
study, is small and does not affect the validity of DXA(46).
Fourth, a well-known limitation of DXA is that body composition estimates made by densitometers of different
manufacturers are not comparable(47), which makes the
external cross-validation of DXA-based prediction models potentially more difficult than with other methods.
In conclusion, the log-transformed sums of two and four skinfolds were found to be similarly accurate indices of PBF Table 4. Bias and concordance of the seven models for the prediction of percentage body fat (n 372)
Fixed bias* Proportional bias Concordance†
Mean SD LLA ULA P ‡ r P § CCC LCC UCC
Model 1 0·00 3·01 5·90 25·90 1·000 20·28 ,0·001 0·86 0·83 0·88 Model 2 0·00 2·83 5·55 25·55 1·000 20·26 ,0·001 0·88 0·85 0·90 Model 3 0·00 2·53 4·95 24·95 1·000 20·23 ,0·001 0·90 0·89 0·92 Model 4 0·00 2·34 4·58 24·58 1·000 20·21 ,0·001 0·92 0·90 0·93 Model 5 0·00 3·71 7·27 27·27 1·000 20·36 ,0·001 0·76 0·73 0·80 Model 6 0·00 3·87 7·59 27·59 1·000 20·39 ,0·001 0·74 0·70 0·78 Model 7 0·00 3·64 7·14 27·14 1·000 20·36 ,0·001 0·78 0·74 0·81
LLA, Bland & Altman’s lower limit of agreement; ULA, Bland & Altman’s upper limit of agreement; r, Pearson’s correlation coefficient; CCC, Lin’s concordance correlation coefficient; LCC, 95 % lower limit of agreement of CCC; UCC, 95 % upper limit of agreement of CCC.
* Calculated as (predicted 2 measured). † P, 0·001 for all values of the CCC.
‡ Tests the null hypothesis that the mean bias equals 0.
§ Tests the null hypothesis of no association between the bias and the average.
British
Journal
of
15·0
Absolute value of inter
-method dif ference (k g) 12·5 (a) (b) 10·0 7·5 5·0 2·5 0 1 2 3
Quintiles of inter-method average
4 5 1 2 3
Quintiles of inter-method average
4 5
15·0
Absolute value of inter
-method dif ference (k g) 12·5 10·0 7·5 5·0 2·5 0 15·0
Absolute value of inter
-method dif ference (k g) 12·5 (c) (d) 10·0 7·5 5·0 2·5 0 1 2 3
Quintiles of inter-method average
4 5 1 2 3
Quintiles of inter-method average
4 5
15·0
Absolute value of inter
-method dif ference (k g) 12·5 10·0 7·5 5·0 2·5 0 15·0
Absolute value of inter
-method dif ference (k g) 12·5 (e) (f) 10·0 7·5 5·0 2·5 0 1 2 3
Quintiles of inter-method average
4 5 1 2 3
Quintiles of inter-method average
4 5
15·0
Absolute value of inter
-method dif ference (k g) 12·5 10·0 7·5 5·0 2·5 0 15·0
Absolute value of inter
-method dif ference (k g) 12·5 (g) 10·0 7·5 5·0 2·5 0 1 2 3
Quintiles of inter-method average
4 5
Fig. 1. Relationship between the absolute inter-method difference (calculated as predicted 2 measured) and the quintiles of the average of the methods for the seven different models: (a) model 1 (P¼ 0·1984); (b) model 2 (P¼ 0·4930); (c) model 3 (P¼ 0·4936); (d) model 4 (P¼ 0·0684); (e) model 5 (P¼ 0·0373); (f) model 6 (P¼ 0·0159); (g) model 7 (P¼ 0·0062). The absolute inter-method difference showed an increasing trend for increasing quintile of the average of methods only for models 6 and 7. Box plots give the median value (v), 25th and 75th percentiles (lower and upper limits of the box) and lower and upper adjacent values (whiskers). X, Outliers. The P values for trend were obtained from a Jonckheere–Terpstra test for ordered alternatives (both ascending and descending).
British
Journal
of
in a representative sample of 6- to 13-year-old Swiss children. Due to its simplicity and low cost, the sum of two skinfolds may be used to evaluate the association of PBF with health outcomes in epidemiological studies. Nevertheless, the KISS algorithms should be cross-validated in external samples before being employed in research.
Acknowledgements
We thank all children, parents and teachers for taking part in the study. KISS was funded by the Swiss Federal Office of Sports (grant no. SWI05-013) and the Swiss National Science Foundation (grant no. PMPDB-114401). The sponsors had no role in the design and conduct of the study, collection, man-agement, analysis and interpretation of the data. There was no sponsoring from industry.All authors had full access to the data and take responsibility for the integrity of the data and the accuracy of the analysis. S. K., L. Z., R. R. and U. M. were responsible for the study concept, design and the acquisition of data. S. K. and G. B. were responsible for the analysis and interpretation of the data and drafted the manuscript. All authors took part in the critical revision of the manuscript for important intellectual content. S. K. and L. Z. obtained funding for the study. S. K. and G. B. are guarantors of the study.We declare that we have no conflict of interest.
References
1. Kriemler S, Manse-Wenger S, Zahner L, et al. (2008) Reduced cardiorespiratory fitness, low physical activity and an urban environment are independently associated with increased cardio-vascular risk in children. Diabetologia 51, 1408 – 1415. 2. Nooyens AC, Koppes LL, Visscher TL, et al. (2007) Adolescent
skinfold thickness is a better predictor of high body fatness in adults than is body mass index: The Amsterdam Growth and Health Longitudinal Study. Am J Clin Nutr 85, 1533 – 1539. 3. Wells JC & Petrel MS (2006) Measuring body composition.
Arch Dis Child 91, 612 – 617.
4. Pietrobelli A (2004) Outcome measurements in paediatric obesity prevention trials. Int J Obes Relat Metab Disord 28, Suppl. 3, S86 – S89.
5. Wang J, Thornton JC, Kolesnik S, et al. (2000) Anthropometry in body composition. An overview. Ann N Y Acad Sci 904, 317 – 326.
6. Himes JH (2009) Challenges of accurately measuring and using BMI and other indicators of obesity in children. Pediatrics 124, Suppl. 1, S3 – S22.
7. Krebs NF, Himes JH, Jacobson D, et al. (2007) Assessment of child and adolescent overweight and obesity. Pediatrics 120, Suppl. 4, S193 – S228.
8. Maynard LM, Wisemandle W, Roche AF, et al. (2001) Childhood body composition in relation to body mass index. Pediatrics 107, 344 – 350.
9. Prentice AM & Jebb SA (2001) Beyond body mass index. Obes Rev 2, 141 – 147.
10. Brambilla P, Bedogni G, Moreno LA, et al. (2006) Cross-validation of anthropometry against magnetic resonance imaging for the assessment of visceral and subcutaneous adipose tissue in children. Int J Obes Relat Metab Disord 30, 23 – 30.
11. McCarthy HD (2006) Body fat measurements in children as predictors for the metabolic syndrome: focus on waist circum-ference. Proc Nutr Soc 65, 385 – 392.
12. Durnin JV & Rahaman MM (1967) The assessment of the amount of fat in the human body from measurements of skinfold thickness. Br J Nutr 21, 681 – 689.
13. Ketel IJ, Volman MN, Seidell JC, et al. (2007) Superiority of skinfold measurements and waist over waist-to-hip ratio for determination of body fat distribution in a population-based cohort of Caucasian Dutch adults. Eur J Endocrinol 156, 655 – 661.
14. van Lenthe FJ, van Mechelen W, Kemper HC, et al. (1998) Association of a central pattern of body fat with blood pressure and lipoproteins from adolescence into adulthood. The Amsterdam Growth and Health Study. Am J Epidemiol 147, 686 – 693.
15. Fields DA & Goran MI (2000) Body composition techniques and the four-compartment model in children. J Appl Physiol 89, 613 – 620.
16. Pintauro SJ, Nagy TR, Duthie CM, et al. (1996) Cross-calibration of fat and lean measurements by dual-energy X-ray absorptiometry to pig carcass analysis in the pediatric body weight range. Am J Clin Nutr 63, 293 – 298.
17. Helba M & Binkovitz LA (2009) Pediatric body composition analysis with dual-energy X-ray absorptiometry. Pediatr Radiol 39, 647 – 656.
18. Lohman TG & Going SB (2006) Body composition assessment for development of an international growth standard for preado-lescent and adopreado-lescent children. Food Nutr Bull 27, Suppl. 4, S314 – S325.
19. Goran MI, Driscoll P, Johnson R, et al. (1996) Cross-calibration of body-composition techniques against dual-energy X-ray absorptiometry in young children. Am J Clin Nutr 63, 299 – 305. 20. Steinberger J, Jacobs DR, Raatz S, et al. (2005) Comparison of body fatness measurements by BMI and skinfolds vs dual energy X-ray absorptiometry and their relation to cardiovascular risk factors in adolescents. Int J Obes Relat Metab Disord 29, 1346 – 1352.
21. Treuth MS, Butte NF, Wong WW, et al. (2001) Body compo-sition in prepubertal girls: comparison of six methods. Int J Obes Relat Metab Disord 25, 1352 – 1359.
22. Sarrı´a A, Garcı´a-Llop LA, Moreno LA, et al. (1998) Skinfold thickness measurements are better predictors of body fat percentage than body mass index in male Spanish children and adolescents. Eur J Clin Nutr 52, 573 – 576.
23. Rodriguez G, Moreno LA, Blay MG, et al. (2005) Body fat measurement in adolescents: comparison of skinfold thickness equations with dual-energy X-ray absorptiometry. Eur J Clin Nutr 59, 1158 – 1166.
24. Zahner L, Puder JJ, Roth R, et al. (2006) A school-based physi-cal activity program to improve health and fitness in children aged 6 – 13 years (“Kinder-Sportstudie KISS”): study design of a randomized controlled trial [ISRCTN15360785]. BMC Public Health 6, 147.
25. Lohman TG, Roche AF & Martorell R (1988) Anthropometric Standardization Reference Manual. Champaign, IL: Human Kinetics Books.
26. Moreno LA, Joyanes M, Mesana MI, et al. (2003) Harmoniza-tion of anthropometric measurements for a multicenter nutriHarmoniza-tion survey in Spanish adolescents. Nutrition 19, 481 – 486. 27. Ulijaszek SJ & Kerr DA (1999) Anthropometric measurement
error and the assessment of nutritional status. Br J Nutr 82, 165 – 177.
28. Cole TJ, Freeman JV & Price MA (1998) British 1990 growth reference centiles for weight, height, body mass index and head circumference fitted by maximum penalized likelihood. Stat Med 17, 407 – 429.
29. Cole TJ, Bellizzi MC, Flegal KM, et al. (2000) Establishing a standard definition for child overweight and obesity worldwide: international survey. BMJ 320, 1240 – 1243.
British
Journal
of
30. Bedogni G, Iughetti L, Ferrari M, et al. (2003) Sensitivity and specificity of body mass index and skinfold thicknesses in detecting excess adiposity in children aged 8 – 12 years. Ann Hum Biol 30, 132 – 139.
31. Frisancho AR (1990) Anthropometric Standards for the Assessment of Growth and Nutritional Status. Ann Arbor, MI: University of Michigan Press.
32. Tanner JM & Whitehouse RH (1976) Clinical longitudinal standards for height, weight, height velocity, weight velocity, and stages of puberty. Arch Dis Child 51, 170 – 179.
33. Pietrobelli A, Formica C, Wang Z, et al. (1996) Dual-energy X-ray absorptiometry body composition model: review of physical concepts. Am J Physiol 271, E941 – E951.
34. Bland JM & Altman DG (1996) Transforming data. BMJ 312, 770. 35. Royston P & Sauerbrei W (2008) Multivariable Model-Building: A Pragmatic Approach to Regression Analysis Based on Fractional Polynomials for Modelling Continuous Variables. Hoboken, NJ: John Wiley.
36. Steyerberg EW (2008) Clinical Prediction Models: A Practical Approach to Development, Validation, and Updating. New York: Springer.
37. Ryan TP (2009) Modern Regression Methods. New York: Wiley. 38. Bland JM & Altman DG (1999) Measuring agreement in
method comparison studies. Stat Methods Med Res 8, 135. 39. Lin LI (2000) A note on the concordance correlation coefficient.
Biometrics 56, 324 – 325.
40. Lin LI (1989) A concordance correlation coefficient to evaluate reproducibility. Biometrics 45, 255 – 268.
41. Freedman DS, Wang J, Ogden CL, et al. (2007) The prediction of body fatness by BMI and skinfold thicknesses among children and adolescents. Ann Hum Biol 34, 183 – 194. 42. Slaughter MH, Lohman TG, Boileau RA, et al. (1988) Skinfold
equations for estimation of body fatness in children and youth. Hum Biol 60, 709 – 723.
43. Mei Z, Grummer-Strawn LM, Wang J, et al. (2007) Do skinfold measurements provide additional information to body mass index in the assessment of body fatness among children and adolescents? Pediatrics 119, e1306 – e1313.
44. Twisk JW, Kemper HC, van Mechelen W, et al. (1998) Body fatness: longitudinal relationship of body mass index and the sum of skinfolds with other risk factors for coronary heart disease. Int J Obes Relat Metab Disord 22, 915 – 922. 45. Roemmich JN, Clark PA, Weltman A, et al. (1997) Alterations
in growth and body composition during puberty. I. Comparing multicompartment body composition models. J Appl Physiol 83, 927 – 935.
46. Pietrobelli A, Wang Z, Formica C, et al. (1998) Dual-energy X-ray absorptiometry: fat estimation errors due to variation in soft tissue hydration. Am J Physiol 274, E808 – E816. 47. Plank LD (2005) Dual-energy X-ray absorptiometry and
body composition. Curr Opin Clin Nutr Metab Care 8, 305 – 309.