BIOINFORMATICS
APPLICATIONS NOTE
Vol. 24 no. 22 2008, pages 2641–2642doi:10.1093/bioinformatics/btn491Systems biology
MS-BID: a Java package for label-free LC-MS-based comparative
proteomic analysis
Daehee Hwang
1
,2,∗,†
, Ning Zhang
1
,†
, Hookeun Lee
1
,3
, Eugene Yi
1
, Hui Zhang
1
,
Inyoul Y. Lee
1
, Leroy Hood
1
and Ruedi Aebersold
1
,4,5
1
Institute for Systems Biology, Seattle, WA 98103, USA,
2I-BIO Program and Department of Chemical Eng., Pohang
790-784,
3LCDI, Gachon University of Medicine and Science, Incheon, Republic of Korea,
4Institute for Molecular
Systems Biology, ETH, CH-8093 Zürich and
5Faculty of natural science, University of Zürich, Zürich, Switzerland
Received on May 25, 2008; revised on September 2, 2008; accepted on September 12, 2008 Advance Access publication September 19, 2008
Associate Editor: John Quackenbush
ABSTRACT
Summary: MS-BID (MS Biomarker Discovery Platform) is an
integrative computational pipeline for biomarker discovery using LC-MS-based comparative proteomic analysis. This platform consists of several computational tools for: (i) detecting peptides in the collected patterns; (ii) matching detected peptides across a number of LC-MS datasets and (iii) selecting discriminatory peptides between classes of samples.
Availability: MS-BID source codes, binaries and documentations
are freely available under LGPL from http://tools.proteomecenter.org/ msBID.php.
Contact: [email protected]
1
INTRODUCTION
Advances in quantitative proteomic analysis have offered new
opportunities for identifying biomarker proteins in tissue and body
fluid samples (Aebersold and Mann, 2003). However, proteomic
analysis of such samples is still challenging due to both high
sample complexity and the large dynamic range of protein
concentrations (Anderson et al., 2004). Therefore, no common
proteomics technology has the capacity to completely analyze the
entire complex proteome in biological samples. To increase the size
of proteome detected from such samples, several sensitive, highly
reproducible LC-MS approaches have been introduced (Mueller
et al., 2007). Despite highly reproducible LC-MS patterns from
recent LC-MS technologies, the differences in LC-MS patterns that
can arise from imperfect chromatography, contaminants, and ion
suppression effects can still complicate the detection and matching
of signals in and between samples. Therefore, there has been a need
for a computational framework that can reliably: (i) detect peptides,
(ii) match the corresponding peptides across multiple LC-MS data
and (iii) select discriminatory peptides. Here, we present MS-BID,
a Java package including a set of computational tools, which
effectively achieves the above three tasks.
∗To whom correspondence should be addressed.
†The authors wish it to be known that, in their opinion, the first two authors
should be regarded as joint First Authors.
2
METHODS AND FEATURES
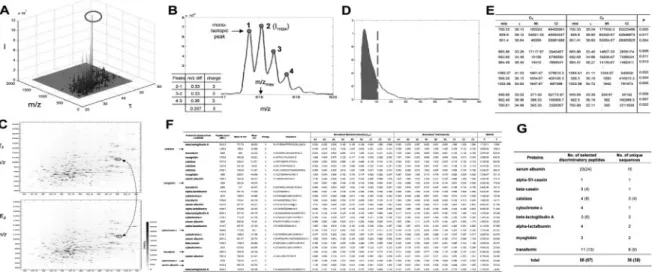
The features included in MS-BID are summarized in the following paragraphs. The MS-BID features were demonstrated using the datasets generated by QStar for three classes of mixtures consisting of nine proteins at known different molar ratios. The results (Fig. 1) show that MS-BID correctly selected the proteins whose abundances were varied across samples and accurately captured their relative ratios under the three conditions.
• Detection of peptide features: the data (m/z and intensity) for each scan (retention time) is extracted after converting LC-MS data to the mzXML format (Pedrioli et al., 2004). In the entire dataset, a peptide with the largest intensity is first identified (the circled peptide in Fig. 1A). If the maximum intensity (the second isotopic peak in Fig. 1B) is larger than a cutoff value (by default, 25) and the charge state is between two and five, we statistically determine both ranges of m/z and retention time for the corresponding peptide feature using cumulative sum-based tests (Hamilton, 1994). The cutoff value can be adjusted considering the noise level in the data. We recommend setting the value as the highest noise level in the data.
• Determination of charge states: all isotopic peaks (local maxima numbered in Fig. 1B) for each detected peptide are first found using local maxima detection algorithm after smoothing the intensities five times using a convolution filter [1/3 1/3 1/3], and adjusting the m/z shifts coming from smoothing. A charge state is then assigned to each m/z distance between two consecutive isotopic peaks (the table in Fig. 1B), and a non-parametric voting scheme was used to determine the peptide charge state as the most frequently occurring one.
• Alignment of peptide features from multiple LC-MS experiments: 1. Pairwise alignments: the following iterative pairwise alignment is
done for each of all possible pairs of LC-MS experiments. For a particular pair of experiments (i and j), each peptide detected in experiment i is initially matched with one of peptides with the same charge states in experiment j, such that this peptide pair has the shortest weighted Euclidean distance in m/z and retention time space (see two circled peptides linked by the dashed line in Fig. 1C). The weights are iteratively determined by minimizing the sum of weighted distances for the matched peptides. When MS/MS analysis is done for peptide sequencing, MS-BID also provides an optional procedure with which the identified peptides from MS2 can be matched if they are within the m/z range of 0.01 Da of the extracted features and reside in the elution profile of extracted features. Finally, the probability that each pair of matched peptides is matched by chance is computed using an empirical probability density function (PDF) of the weighted distance for random pairs
D.Hwang et al.
Fig. 1. Functionalities of MS-BID. (A and B) Peak detections; (C) pairwise alignment; (D) P-value computation for aligned peptides; (E and F) pairwise and
overall alignment table and (G) discriminatory peptides.
of peptides (Fig. 1D). The final set of aligned peptide pairs is then determined by selecting the pairs with P-value<0.05 (Fig. 1E). MS-BID assumes that all samples are analyzed using the same gradient. Thus, a functionality (e.g. chromatographic alignment) to correct retention time differences of peptide features between the samples analyzed using different gradients is not currently available in MS-BID. The computation time for this pairwise alignment increases with the number of samples. With more than 50 samples, we recommend dividing the dataset into a couple of groups and then combining the alignment tables (see below) from the individual groups.
2. Overall alignment: the overall alignment table is generated (Fig. 1F) by combining all sets of pairwise aligned peptides. Due to various reasons such as co-eluting peptides, some peptide features can fail to be detected. MS-BID provides an optional procedure that can estimate the intensities of the missing peptides. For a set of aligned peptides with a missing peptide (i.e. a row of alignment table in Fig. 1F with a missing value), MB-BID extracts the intensities within the range of m/z and retention time defined by the other aligned peptides from the mzXML file of the sample including the missing value and then fills in the intensity of the missing peptide using the highest intensity in the range. We made this procedure optional because it takes a long time when there are many missing peptides. Also, to reduce the computation time, MS-BID only searches for the peptides whose maximum intensities are larger than a cutoff (by default, 25). A few of hundreds of missing peptides were identified by this procedure from several datasets recently tested. The overall P-value for each set of matched peptides in the overall alignment table is computed using Fisher’s method (Hwang et al., 2005). To alleviate the variations from sample preparation, the intensities of each aligned feature are normalized such that the sums of the intensities of the top 10 peptides are to be the same in all the samples.
• Selection of discriminatory peptides: using the overall alignment table, discriminatory peptides are identified by selecting the peptides whose normalized intensities are different (P< 0.05) among multiple groups of samples (e.g. healthy versus diseased samples) based on analysis of variance (Bayesian ANOVA from BAMarray; Fig. 1G).
3
IMPLEMENTATION
MS-BID software is implemented in Java. A few R modules that
perform ANOVA and Fisher’s method were called within the Java
code. The software can be run on both Linux and Windows. The
MS-BID is distributed under the Lesser GNU Public License (LGPL).
In general, MS-BID can be applied to datasets generated from
any type of MS instruments producing clear isotopic clusters. Its
functionalities were tested using datasets from various MS types,
such as QStar, QTOF, LTQ-FT and QTrap. For a QTrap data
with a size of 1.5 GB in mzXML file format, MS-BID finished
identification of peptide features (5105 features) in 28.9 min and
alignment of 12 samples from QTrap was done within 8 min on a
PC with 1.8 GHz CPU and 2 GB RAM. From our limited experience,
MS-BID outperformed the previously published tools for a particular
set of data we tested (e.g. QStar and QTrap data).
Funding: National Institutes of Health (grant NS41997, NHLBI
grant N01-HV-28179); DOD (grant DAMD17-3-1-0321); KOSEF
(grants R15-2004-033-07002-0 and M1AN29-2008-04112);
KRF-2007-331-C00204.
Conflict of Interest: none declared.
REFERENCES
Aebersold,R. and Mann,M. (2003) Mass spectrometry-based proteomics. Nature, 422, 198–207.
Anderson,N.L. et al. (2004) The human plasma proteome: a nonredundant list developed by combination of four separate sources. Mol. Cell. Proteomics, 3, 311–326. Hamilton,J.D. (1994) Time Series Analysis. Princeton University Press, New Jersey. Hwang,D. et al. (2005) A data integration methodology for systems biology. Proc. Natl
Acad. Sci. USA, 102, 17296–17301.
Mueller,L.N. et al. (2007) SuperHirn - a novel tool for high resolution LC-MS-based peptide/protein profiling. Proteomics, 7, 3470–3480.
Pedrioli,P.G. et al. (2004) A common open representation of mass spectrometry data and its application to proteomics research. Nat. Biotechnol., 22, 1459–1466.