77 7777777777 77 7777777777 7 æ 77 ÷÷÷÷÷÷÷÷÷÷ ÷÷÷÷÷÷÷÷ ÷ ÷÷÷÷ ÷÷÷÷÷÷÷÷ ÷÷÷÷ ÷÷÷÷ ÷÷÷÷÷÷÷÷÷ ¿¿¿¿ ¿¿¿¿¿ ¿¿¿¿¿¿ ÷÷÷·÷÷·÷ éé ÷÷÷ éééé ²÷·÷÷÷÷÷÷÷÷÷ ²÷÷÷÷÷÷ ÷÷ ÷÷²÷÷÷÷÷÷ ·÷ ÷÷ ·²÷÷÷²÷÷ ·÷ ²÷²÷÷÷÷÷÷÷ ·÷ ÷²÷÷ ÷÷Ó÷÷ ·÷ ÷ÓÓÓ÷÷÷ Ó÷·÷÷÷ ÷÷÷Ó ÷÷ ÷·Ó÷÷ ÷ÓÓ÷ÓÓÓ² ÓÓ ÷Ó÷éÓ ÓÓ÷÷÷ Ó÷÷÷²²Ó÷÷ ÷÷ ÷÷÷÷Ó÷÷ ÷÷÷÷÷÷÷÷÷÷÷÷ »÷»Ó÷÷÷Ó÷÷÷÷ ÓÓ÷÷÷÷²÷÷²²² ÷²÷÷÷÷÷÷ Ó÷÷÷÷÷÷÷ Ó÷·÷÷ ÷÷÷÷÷÷·÷÷÷÷÷ ÷÷÷÷Ó÷÷ ²÷÷÷÷Ó ÷÷÷²²÷÷÷÷÷÷÷ ÷÷÷·÷÷÷Ó ²÷÷÷÷· ÷÷÷²²÷÷÷÷÷÷÷ ÷÷÷÷ ²÷÷Ó²÷÷ ÷÷÷²²÷÷÷÷÷÷÷ ²÷÷÷÷÷ ÷÷²÷÷÷ ÷Ó÷÷÷÷÷÷÷÷÷÷ ÷÷÷÷÷÷»Ó÷÷÷ »÷ ÷÷÷÷÷ ÷Ó÷÷÷÷÷÷÷÷÷÷ ÷²÷÷÷²²÷ ÷÷÷²÷÷ ÷Ó÷÷÷÷÷÷÷÷÷÷ ÷÷÷÷÷Ó§ »÷²÷·÷²
ii
Abstract
The Indonesian tuna fishery has suffered from a management problem due to incomplete and less reliability of tuna data leading to lack of understanding about tuna population dynamics in its region. The government of Indonesia initiated the Infrastructure Development of Space Oceanography (INDESO) programme to support marine resource management and monitoring of the Country. One application concerns the tuna fisheries with a challenging objective of real-time and forecast modeling of three tuna species biomass distributions: bigeye, yellowfin and skipjack. The model used is SEAPODYM (Spatial Ecosystem and Population Dynamics Model). The present thesis is dealing with bigeye tuna only, and had three major objectives: the preparation of a geo-referenced fishing dataset, the production of initial conditions for the regional INDESO model configuration, and the simulation of regional population dynamics.
The georeferenced fishing catch and effort dataset of the Indian Ocean bigeye tuna was standardized throughout five procedures: standardization of spatial resolution, conversion and standardization of catch and effort units, raising of geo-referenced catch to nominal catch level, screening and correction of outliers, and detection of major catchability changes over long time series of fishing data. . The standardized geo-referenced catch dataset covers two-third of total nominal catch due to lack of geographic references for several fishing fleets. The regional model was configured along three steps: the parameterization of coarse resolution model over a long historical period, the downscaling and parameterization of operational global configuration, and the downscaling to the operational regional model. The first step provided model parameterization over the Pacific and Indian Ocean for thirty-nine years period at 2° monthly resolution, allowing to establish initial conditions of the population for the second configuration starting in 1998 at resolution ¼° weekly. This second model configuration required a downscaling method to revise the parameterization and achieve the same solution despite some differences in the physical forcing. This global operational model provided initial conditions of the population and open boundary conditions (OBCs) constraining the fluxes of fish through the regional borders of INDESO model (1/12° daily resolution).
The standardized Indian Ocean fishing dataset was used for including fishing mortality and validate the optimization achieved in the Pacific Ocean. Model simulation outputs suggest that bigeye is distributed in higher concentration in the North Indian Ocean (north of 20°S), with an extension through the Mozambique Channel and along an eastward prolongation between 35° and 40°S.. The operational model configurations (global and regional) are using VGPM net primary production and euphotic depth derived from satellite data, and climatological dissolved oxygen monthly maps from the World Ocean Atlas (WOA) as biogeochemical forcings. A regional simulation using the INDESO biogeochemical PISCES model forcing as an alternative to the satellite derived products was tested. The preliminary results show that once the PISCES primary production is scaled to the VGPM mean value,
iii
both products provide similar results, suggesting that longer time scale forecast based on the coupled physical biogeochemical model can be proposed.
Résumé
La pêche au thon indonésienne a souffert d'un problème de gestion dû à des statistiques de pêche incomplètes et peu fiabilité, ce qui entraîne un manque de compréhension de la dynamique des populations de thonidés de la région. Le gouvernement de l'Indonésie a lancé un programme de développement de l'infrastructure pour l'océanographie spatiale (INDESO) afin d’aider à la gestion et au suivi des ressources marines du pays. Une application du projet concerne les pêcheries thonières avec l’objectif ambitieux de modéliser en temps réel et avec des prévisions de quelques jours les distributions et abondances de trois espèces de thonidés: thon obèse, albacore et bonite. Le modèle utilisé est SEAPODYM (modèle spatial d'écosystème et de dynamique de population). La présente thèse traite uniquement du thon obèse et a trois objectifs majeurs: la préparation d'un ensemble de données de pêche géoréférencées, la production de conditions initiales pour la configuration du modèle régional INDESO et la simulation de la dynamique régionale des populations.
L'ensemble de données sur les captures et les efforts de pêche géoréférencés du thon obèse de l'océan Indien a été standardisé selon cinq procédures: standardisation de la résolution spatiale, conversion et standardisation des unités de capture et d'effort, recalage des captures géo-référencées au niveau des captures nominales, et détection des principaux changements de capturabilité sur de longues séries temporelles de données sur la pêche.. L'ensemble de données de prises géoréférencées standardisées couvre les deux tiers de la capture nominale totale en raison du manque de références géographiques pour plusieurs flottilles de pêche. Le modèle régional a été configuré en trois étapes: paramétrage du modèle à résolution grossière sur une longue période historique, « downscaling » et paramétrage de la configuration globale opérationnelle et « downscaling » vers le modèle régional opérationnel. La première étape a permis de paramétrer le modèle sur le Pacifique puis l'Océan Indien sur une période de trente-neuf ans à une résolution mensuelle de 2°, permettant d'établir les conditions initiales de la population pour la deuxième configuration, à partir de 1998 et à une résolution hebdomadaire ¼°. Cette deuxième configuration du modèle a nécessité une méthode de « downscaling » pour réviser le paramétrage et obtenir la même solution malgré quelques différences dans le forçage physique. Ce modèle opérationnel global a ensuite fourni des conditions initiales de la population et des conditions aux frontières ouvertes pour les flux de poissons traversant les frontières régionales du modèle INDESO (1/12 ° de résolution quotidienne).
L'ensemble des données de pêche standardisées dans l’océan Indien a été utilisé pour inclure la mortalité par pêche et valider l'optimisation réalisée dans l'océan Pacifique. Les résultats des simulations de modèles suggèrent que le thon obèse est distribué en concentration plus
iv
élevée dans l'océan Indien Nord (au nord de 20 °S), avec une extension à travers le canal du Mozambique et le long d'un prolongement vers l'est entre 35 ° et 40 ° S. Les configurations du modèle opérationnel (mondial et régional) utilisent la production primaire nette (VGPM) et la profondeur euphotique dérivées des données satellitaires, ainsi que les cartes mensuelles climatologiques de l'oxygène dissous provenant de l'Atlas Mondial des Océans (WOA) comme forçages biogéochimiques. Une simulation régionale utilisant le modèle INDESO biogéochimique PISCES comme forçage alternatif aux produits dérivés des satellites a été testée. Les résultats préliminaires montrent que, une fois la production primaire PISCES ajustée à la valeur moyenne VGPM, les deux produits donnent des résultats similaires, ce qui suggère que des prévisions à plus long terme basées sur le modèle biogéochimique physique couplé peuvent être proposées.
v
Acknowledgements
This thesis is enriched by invaluable and fruitful human relationship encouraging me to accomplish this work. Without supports, guidance, advice, and some pressure from these remarkable individuals, this manuscript would be far from being final. So this page is dedicated to acknowledge contributions of these persons to any aspects leading finalization of this manuscript.
First and foremost, I wish to thank my principal supervisor, Dr. Patrick Lehodey who has been always patient in teaching and guiding to improve my understanding in a wide range aspect of fish population dynamics. Patrick has been supportive since the first day I began working on the Marine Ecological Modeling System (MEMS) group until the most difficult period when writing this thesis.
Without technical assistance of the MEMS team experts, these thesis results would have been delivered with longer delay. So I would like to thanks Dr. Inna Senina, Dr. Olivier Titaud, Dr. Beatriz Calmettes, and Dr. Benoit Tranchant for being my technical advisors. Inna shared her programming knowledge allowing my works to be much more efficient. Olivier was helping me to prepare SEAPODYM simulations using PISCES forcings. Aside from technical part, thank you for your kindness to my family. Beatriz and Benoit were always helpful when my simulations required forcings data. In addition to the group, I was fortunate to work next door to Dr. Philippe Gaspar, who supported me to engage in this adventure and was so hepful to deal with doctoral school’s administration, as well as to obtain temporary residence permits in France for me and my family.
I am grateful for having lab-mates, Anna Conchon, Maxime Lalire, and Quentin Dagneaux who taught me French language indirectly during one-hour lunch break and daily interaction. Anna was such of great help to organize settlement and movement of my family. Maxime was always willing to correct and improve over my French texts and to explain French idioms in a simple manner. Through conversation, Quentin introduced me French cultures allowing me to socialize more easily.
My special thanks go to Dr. Florence Bouille who arranged payment of INDESO allowance regularly each month. She also sincerely supported life outside of work, and I really appreciated when she helped me to find a school for my children. I also received support from Monique Borra who took care of administration procedures relating to the Campus France.
This thesis would not have been allowed to be defended without corrections and suggestions of the reviewers. I would like to thank Dr. Francis Marsac, Dr. Frédéric Menard and Dr. Paul Marchal for giving insightful comments and suggestions. I would also like to express my personal admiration and appreciation to the jury’s member: Dr. Marion Gehlen, Dr. Pierre-Yves Le Traon, Dr. Isabelle Dadou, and Dr. Philippe Gaspar.
I received generous support from INDESO Jakarta team: Dr. Aryo Hanggono, Berny A. Subki, Dr. Aulia Riza Farhan, Ibu Yenung and Ibu Fallia. I would like to thank Pak Aryo and Pak Berny for realizing my
vi
dream to study abroad. Special thanks go to Yenung and Fallia who patiently and kindly take care of administration procedures during my period of study assignment. I also received notable support from CLS Jakarta particularly during French visa application for my family. Thanks to Philippe Courrouyan and Michael Dejean.
And finally, last but no means least, I would like to thank my wife and children: Hidayah Krismiyani, Daffa Hasan Fikri, Daffina Naura Tsania, Aqila Ni’mah Tsalitsa (rest in peace, my little Caca), and Daania Almaira Lathifa, for letting me spend most of my time to realize my passion. I also thank my parents: Tukiran Tanireja and Kartinah, for supporting me morally and spiritually. To my brothers Muhammad Hamka and Muhammad Abduh, I really appreciate for keeping our parents healthy during my stay far away from Indonesia.
vii
Table of Contents
Abstract ... ii
Résumé ...iii
Acknowledgements ... v
Table of contents... vii
Chapter 1 Introduction ... 1
1.1 Overview of the Pacific bigeye tuna fishery ... 1
1.2 Overview of the Indian Ocean bigeye tuna fishery ... 4
1.3 Overview of the Indonesian tuna fishery ... 8
1.4 INDESO fish population dynamics ... 14
1.5 Synthèse de l’Introduction ... 15
References ... 18
Chapter 2 Biology and behavior of bigeye tuna ... 23
2.1 Reproduction ... 23
2.2 Movement ... 24
2.3 Population structure ... 25
2.4 Age and growth ... 25
2.5 Natural mortality... 27
References ... 27
Chapter 3 Modelling population dynamics of fish... 29
3.1 Standard stock assessment ... 30
3.1.1 Recruitment ... 30
3.1.2 Growth ... 31
3.1.3 Natural mortality ... 34
3.1.4 Fishing mortality ... 35
3.2 Integrating spatial dynamics into stock assessment ... 36
3.3 SEAPODYM ... 38
3.3.1 Feeding and spawning habitats ... 40
viii
3.3.3 Advection from horizontal oceanic current () and swimming ... 42
3.3.4 Mortality (Z) ... 42
3.3.5 Parameterization... 43
References ... 43
Chapter 4 Standardization of a geo-referenced fishing data set for the Indian Ocean bigeye tuna, Thunnus obesus (1952-2014) ... 49
1 Introduction ... 49
2 Material and method ... 50
2.1 Data ... 50
2.2 Standardization of spatial resolution ... 52
2.3 Conversion of longline catch unit ... 52
2.4 Raising geo-referenced catch and effort data to nominal catch level ... 52
2.5 Detection and correcting of outliers ... 52
2.6 Standardization of effort units ... 53
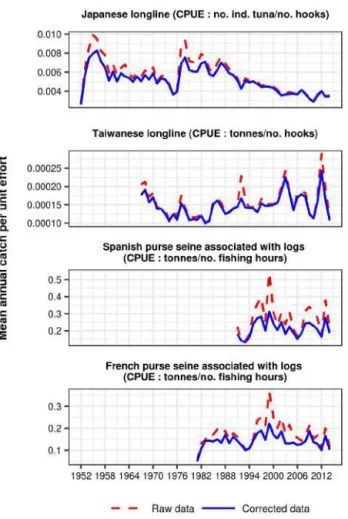
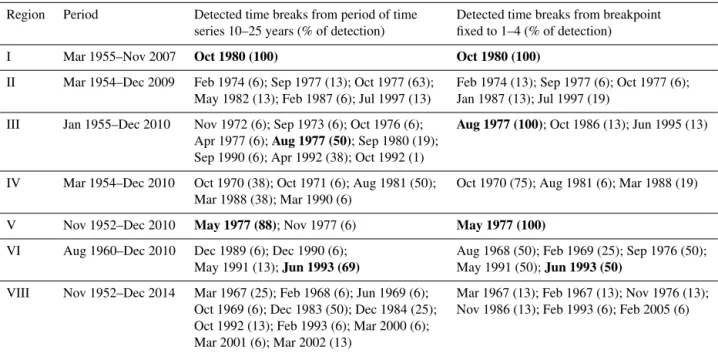
2.7 Time series analysis to detect major changes in Japanese longline fishery ... 53
3 Results... 53
3.1 Standardization of spatial resolutions and catch units ... 54
3.2 Raising of geo-referenced fishing data to nominal catch level ... 54
3.3 Outliers ... 55
3.4 Effort unit ... 57
3.5 Detected breaks in Japanese longline fishery ... 58
3.6 Final definition of fisheries ... 58
3.7 Length frequency data ... 59
4 Data availability... 59
5 Discussion ... 59
5.1 Catch of the Asian longline and European purse seine fleets ... 61
5.2 Data screening of large longline and purse seine fleets ... 62
5.3 Fishing efforts of purse seine and change in catchability on the Japanese longline... 62
5.4 Perspectives ... 63
Acknowledgements ... 63
References ... 63
ix
Chapter 5 Operational modelling of bigeye tuna (Thunnus obesus) spatial dynamics in the Indonesian
region ... 71
1. Introduction ... 71
2. Material and method ... 72
2.1. SEAPODYM ... 72
2.2. Indo-Pacific bigeye tuna fisheries ... 72
2.3. Model configurations ... 73
2.4. Chain of production ... 75
3. Results ... 75
3.1. Optimization with Pacific Ocean fishing data ... 75
3.2. Indo-Pacific bigeye tuna model validation ... 76
3.3. Downscaling ... 76
3.4. Environmental variability ... 77
4. Discussion ... 77
4.1. Fishing data ... 78
4.2 Model optimization and improvements ... 82
4.3. Use of operational products... 83
Acknowledgement ... 83
References ... 83
Supplementary Materials... 85
Chapter 6 The use of biogeochemical PISCES forcings in the simulations of the Indonesian bigeye tuna population dynamics ... 29
6.1 Introduction ... 94
6.2 Material and methods... 97
6.3 Preliminary results ... 98
6.3.1 Regional biogeochemical forcings ... 98
6.3.2 Regional physical forcings ... 100
6.3.3 Regional micronekton simulation ... 101
6.3.4 Regional bigeye tuna simulation ... 102
4.3.5 Micronekton and tuna biomass of the Andaman Sea ... 105
6.3.6 Micronekton and tuna biomass of southern Java and Nusa Tenggara ... 106
x
References ... 109
Appendix ... 111
Chapter 7 Conclusion ... 113
7.1 Conclusion (English version)... 113
7.1.1 Main results ... 113
7.1.2 Limitations of the study ... 116
7.1.3 Perspective of the study ... 116
7.2 Conclusion (French version) ... 118
7.2.1 Resultats majeurs ... 118
7.2.2 Limitations de l'étude... 121
7.2.1 Perspective de l'étude ... 121
1
Chapter 1 Introduction
Contents
1.1 Overview of the Pacific bigeye tuna fishery ... 1
1.2 Overview of the Indian Ocean bigeye tuna fishery ... 4
1.3 Overview of the Indonesian tuna fishery ... 8
1.4 INDESO fish population dynamics ... 14
1.5 Synthèse de l’Introduction ... 15
References ... 18
1.1 Overview of the Pacific bigeye tuna fishery
The Pacific Ocean is the largest ocean in the world, covering almost
165,000,000 km2 (Longhurst, 2007). This immense water mass provides habitats for
multiple species of high economic value, which substantially support the economic development of Pacific countries. Tropical tuna, comprising skipjack (Katsuwonus
pelamis), yellowfin (Thunnus albacares), and bigeye tuna (Thunnus obesus), are the
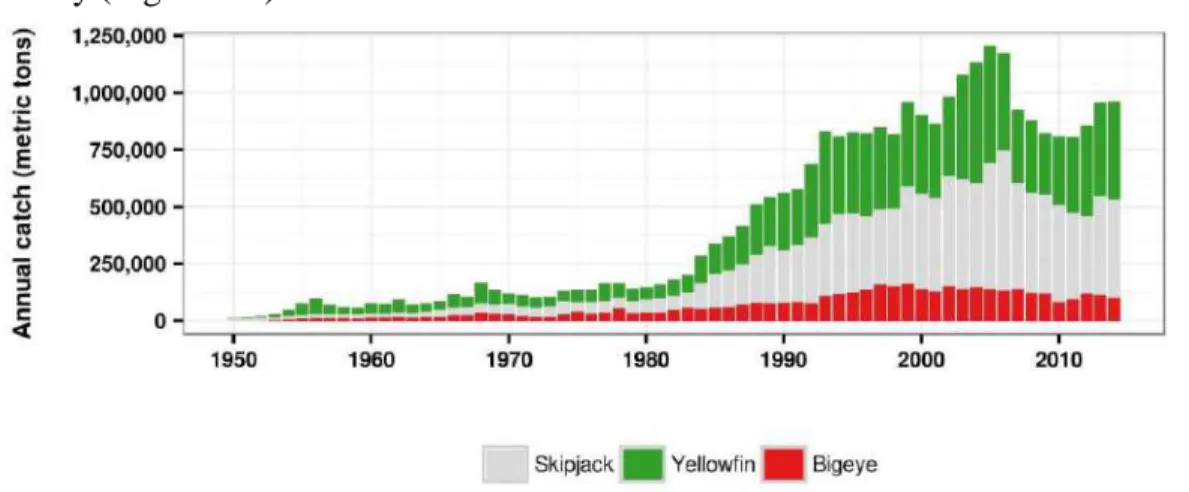
most important tropical Pacific Ocean fishery resource (Majkowski et al., 2011). It was estimated that during 1950–2014, approximately 91 million metric tons of these fish were removed from the Pacific Ocean (WCPFC, 2015). The skipjack is the most productive tuna species and contributes to 57.8% of the total tropical tuna catch, followed by yellowfin (31.5%) and bigeye tuna (10.6%)(Figure 1.1: Annual catch of skipjack, yellowfin, and bigeye tuna from the Pacific Ocean (Figure 1.1).
Figure 1.1: Annual catch of skipjack, yellowfin, and bigeye tuna from the Pacific Ocean (Source of data: WCPFC, 2015).
2
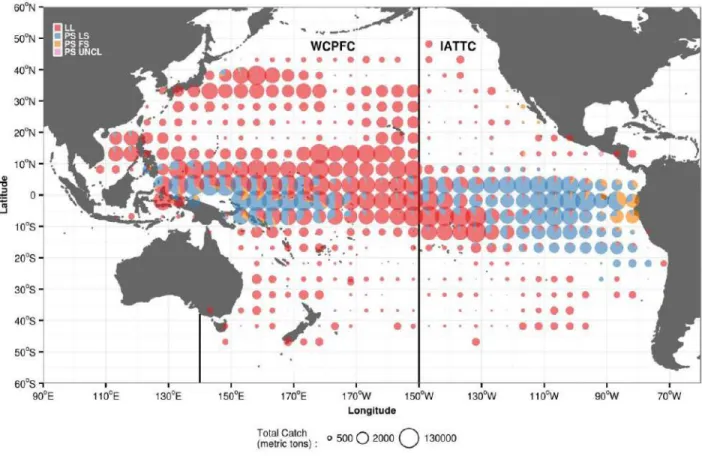
Tuna resources in the Pacific Ocean are managed by two regional fisher y management organizations (RFMOs): the Inter-American Tuna Tropical Commission (IATTC) and the Western and Central Pacific Fisheries Commissions (WCPFC) (Allen, 2010). Geographically, the boundary between these two areas follows the longitude 150°W (Figure 1.2).
The total geo-referenced bigeye tuna catch during the period 1964 to 2014 was 5,819,063 metric tons, 72.4% of which came from the WCPO and 27.6% from the EPO. In the WCPO, bigeye tuna were captured by longline (71%) followed by purse-seine-associated sets (26.2%) and purse-seine-unpurse-seine-associated sets (2.8%). The bigeye tuna catch of the EPO was captured mainly by purse-seine-associated sets (70.6%), followed by longline (23.5%) and then by purse-seine-unassociated sets (5.8%). Longline fishing dominated the catch in central tropical and subtropical regions, while purse seine dominated in the western and eastern tropical regions (Figure 1.2).
Figure 1.2: Spatial distribution of geo-referenced bigeye tuna catch during 1964–2014 derived from longline (LL) fishing, purse-seine-associated sets (PS LS), purse-seine-unassociated sets (PS FS), and uncategorized purse seine (PS UNCL) (Source of data: WCPFC).
3
In the WCPFC convention area, total of the nominal bigeye tuna catch for the period 1950–2014 was 5,808,412 metric tons. The largest proportion of catch was derived from longline fishing (63%) followed by purse seine (27%) and pole and line (4.6%). Other fishing gear such as small-scale hook-and-line, handline, ring net, gill net, and troll line captured only a small proportion of the bigeye tuna catch (<2%)(WCPFC, 2015). In the IATTC convention area, it was estimated that 4,416,821 metric tons of bigeye tuna have been removed during the similar period. Longline fishing has contributed to the largest portion of the catch (66.4%), followed by purse seine (33.4%). Other gear such as pole and line, gill net, and unknown gear captured only a small amount of the catch (< 1% of the total longline catch).
Over the history of tuna fishing, longline strategies have been improved to increase bigeye tuna catchability, including the modification of fishing depth range, change of longline materials, and use of echo sounders and remotely sensed images (Ward and Hindmarsh, 2007). The most influential improvement occurred in the mid-1970s, is related to the introduction of monofilament replacing traditional line allowing to fish deeper. The monofilament lines use 10 or more hooks between mainline floats that enable hooks to reach depths of 300 m or more, while the traditional ones apply about 4–6 hooks covering a depth range of 25–170 m (Bigelow et al., 2002; Ward and Hindmarsh, 2007). The Korean longline fleet were the first to switch to the deep fishing method, followed by the Japanese (Ward and Hindmarsh, 2007).
Purse-seine-associated sets have been globally adopted since the early 1990s (Fonteneau et al., 2013). They attract tuna using floating objects, either natural or man-made, and it was recently estimated that nearly half of the marketed purse seine catch was provided using this fishery (Fonteneau et al., 2013). In the WCPO, the extensive use of floating objects has led to purse seine fishery becoming the largest tuna fishery in the world (Allen, 2010; Sibert et al., 2012). So far, drifting fish aggregating devices (DFADs) are the most popular type of floating object used by purse seiners. The emergence of sophisticated remote technologies (e.g., GPS buoys and echo-sounder buoys) to equip the DFADs has followed their extensive use and has substantially increased purse seine efficiency (Lopez et al., 2014). A consequence of this development is that a unit of purse seine effort has now been modified to a unit that purely indicates the time spent harvesting fish. The change lead to inconsistencies in CPUE time series of purse seine fleets used for stock assessment studies (Fonteneau et al., 2013). For bigeye tuna populations, the existence of DFADs may lead to
4
overfishing. DFAD fishing captures immature bigeye tuna that form mixed schools with skipjack and yellowfin tuna. Catchability of bigeye tuna by DFAD fishing is high, as the mixed schools comprise tuna of a similar length (Fonteneau et al., 2013). The catch of immature bigeye tuna by purse seine can lead to reduced stock recruitment, while at the same time, mature bigeye tuna are targeted primarily by longline fishery.
The two Pacific RFMOs conduct separate tuna stock assessments for their specific regions. The recent stock status for bigeye tuna in the WCPO was “overfishing” similar to the results of the 2010 and 2011 stock assessments (Harley et al., 2014). To reduce fishing mortality, the WCPFC has recently adopted conservation and management measure 2015-01, which limits the efforts of several purse seine fleets.. For the EPO, the latest bigeye tuna stock assessment conducted by the IATTC indicated that the stock is not overfished (Aires-da-Silva and Maunder, 2013).
1.2 Overview of the Indian Ocean bigeye tuna fishery
The Indian Ocean has the world’s smallest ocean surface area, covering only
50,000,000 km2 (Longhurst, 2007). The ocean covers regions known for high tuna
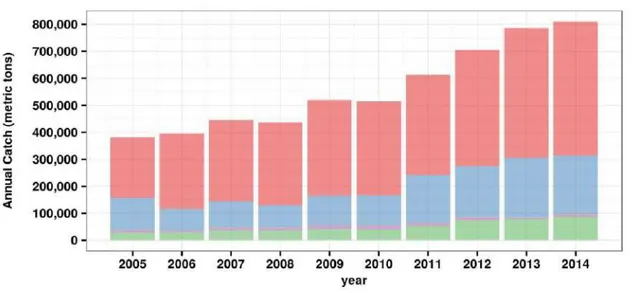
productivity including the Somali Sea and the Mozambique Channel. Before the 1980s, the Indian Ocean tuna catch was the smallest contribution among the oceans, but since the development of purse seine associated with logs fishery, the tuna catch of the ocean has increased and now represents the second largest global tuna catch (Majkowski et al., 2011). The tropical tuna catch during 1950–2014 was 28,079,444 metric tons comprising 43.3%, 41.5%, and 15.2% of skipjack, yellowfin, and bigeye tuna, respectively. When the Somali piracy disrupted tuna fishing activities in the western Indian Ocean during the 2008-2011, skipjack and yellowfin catch decreased sharply as a consequence of the perturbation occurring in the main fishing ground of the purse seine fishery (Figure 1.3).
Figure 1.3:Annual catch of skipjack, yellowfin, and bigeye tuna from the Indian Ocean (Source of data: IOTC).
5
The fish are captured by three groups of gear: longline, purse seine, and other gears. For the period 1950–2014, longlines contributed to the largest percentage of bigeye tuna catch (74.2%), followed by purse seine (18.5%) and other gears (7.3%) (Figure 1.4).
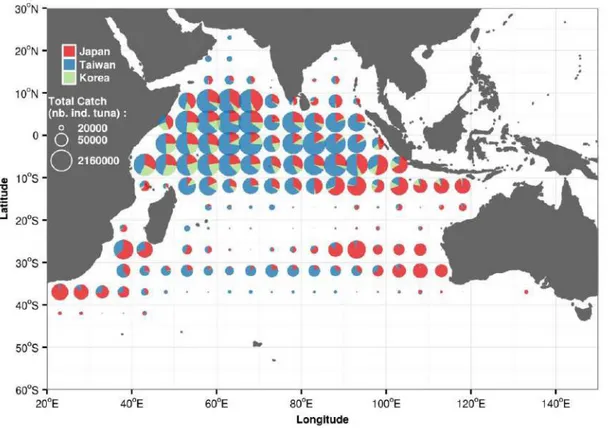
The geo-referenced longline catch indicates that the fishery covers a wide area of the Indian Ocean, but the highest catch was concentrated in the tropical region (10°N – 15°S)(Figure 1.5). The Taiwanese longline dominated the catch in the western and central tropical, and central subtropical Indian Ocean, while the catch in the eastern tropical, eastern, and western subtropical Indian Ocean was mostly undertaken by the Japanese longline (Figure 1.5).
The high demand for bigeye tuna for sashimi markets in the mid-1970s changed the longline fishing practice. To deploy longline hooks in accordance with the bigeye tuna swimming layer, longliners increased the number of hooks between floats, enabling the hooks to be set at a deeper layer. This type of longline replaced the conventional longlines that used shallow configuration. The Japanese fleet began using
Figure 1.4:Annual catch of longline, purse seine, and other gear groups. For visualization, the figure shows only the fishing types contributing to a catch greater than 1% of the total bigeye tuna catch in each group (Source of data: IOTC).
6
deep longline in southern Java and western Sumatra around 1977 and later spread over the western Indian Ocean (Okamoto et al., 2001). The Taiwanese fleet used shallow longlines in the early 1970s to the mid-1980s and since then have adopted deep longline fishing (Lee et al., 2005)
The purse seine fishery captures bigeye tuna using three types of set: log-associated schools (PS-LS), free-swimming schools (PS-FS), and a combination of both (PS-MIX). The fishery is categorized as the PS-MIX when applying mixed strategy by capturing tuna on floating objects and free-swimming school (Davies et al., 2014). Collectively, the Spanish and French purse seine fleets contributed the largest bigeye tuna catch in each set type: 67.8% of the PS-LS catch, 77% of the PS-MIX, and 70% of the PS-FS (Figure 1.6). The French purse seine fleet moved from the eastern Atlantic and the west coast of Africa to capture tuna in the Indian Ocean in 1981 (Figure 1.6)(Allen, 2010; Majkowski et al., 2011). Three years later, the Spanish followed (Pianet et al., 2008). The catch of the PS-LS and PS-MIX during the period 1981–1995 remained at a similar level, and since then, the catch of the PS-LS has increased and reached more than 10,000 metric tons/year (Figure 1.6). The high catch was believed to be due to the extensive use of fish aggregation devices (FADs) that aggregate multiple tuna species of a similar size. FAD fishery targets primarily skipjack, but immature
Figure 1.5: Spatial bigeye tuna catch (individual tuna) captured by the Japanese, Taiwanese, and Korean longline fleets during 1952–2014. (Source of data: IOTC).
7
bigeye tuna are substantially captured as they form a mixed fish school with the skipjack. Spatially, the catch was predominantly captured by the PS- LS fishery in the waters off the coast of Somali and in both the central and eastern tropical Indian Ocean (Figure 1.7). The PS-MIX fishery captured the largest percentage of the purse seine bigeye tuna catch in the Seychelles waters and the Mozambique Channel (Figure 1.7)(Davies et al., 2014).
The Other Gears type consists of various fishing gears including coastal longline (54.4% of the total bigeye tuna catch by other gears for the period 1950–2014), gill net (10.6%), troll line (9.3%), lift net (8%), bait boat (6.3%), hand line (4.4%), offshore gill net (3.3%), and longline-gill net (1.6%). The Indonesian fleet provided the largest proportion of the bigeye tuna catch for the coastal longline (70.4%), gill net (84.3%), and troll line (62.7%) types, and the whole catch of the lift net fishery. The Sri Lanka fleet contributed 70.4%, 6.4%, and 100% of the bigeye tuna catch in the coastal longline, gill net, and longline-gill net fisheries, respectively. The bait boat fishery catch was largely provided by the Maldives fleet. Geo-referenced catch of the Other Gears
Figure 1.6: Annual bigeye tuna catch from eight purse seine fleets grouped on three set types: log-associated, mix of log-associated and free-swimming, and free-swimming schools. Codes: NEI Soviet Union= catch of vessels operating under various flags that were monitored by scientists of former Soviet Union, NEI Other= catch of non-European vessels that were monitored by European scientists (Source of data: IOTC).
8
indicated that the fishery operated mainly in the southern Indian Ocean and in the waters south of Sri Lanka (Figure 1.7).
There are two RFMOs working on tuna management in the Indian Ocean: the Commission for the Conservation of Southern Bluefin Tuna (CCSBT) and the Indian Ocean Tuna Commission (IOTC). The CCSBT is only responsible for stock of southern bluefin tuna (Thunnus maccoyii), while the IOTC manages stock of tuna and tuna-like species. The 2015 bigeye tuna stock assessment indicated that stock was not overfished and not subjected to overfishing (IOTC, 2015).
1.3 Overview of the Indonesian tuna fishery
Indonesian waters are well known for their large productivity of tuna. The country is in the five top largest tuna-producing countries since the 1990s (McElroy and Uktolseja, 1992; Sunoko and Huang, 2014; Williams, 2009). Variability of the tuna production in Indonesia is influenced by the Pacific and Indian Ocean tuna catch. Indonesian tuna management has to consider these different influences in the stock assessment. However, there are many uncertainties in Indonesian tuna catch and effort
Figure 1.7: Spatial distribution of total bigeye tuna catch derived from four types of purse seine sets and other gears during 1981–2014. Codes: PS FS=purse seine free-swimming schools, PS LS=log-associated schools, PS MIX=combination of free-swimming and log-associated schools (Source of data: IOTC).
9
leading primary habitats of the species are currently unidentifiable, and stock vulnerability to both fishing pressures and oceanic-climatic change are unknown. This subsection presents an overview of Indonesian tuna management followed by tuna fishery in both the eastern and western Indonesian waters.
Indonesian tuna management
The Ministry of Marine Affairs and Fisheries of Indonesia issued a decree on April 14, 2014, dividing the Indonesian waters into 11 fishing management zones (FMZs)(Figure 1.8). The decree improved the determination of FMZs in 2009. The establishment of the FMZs was to facilitate the monitoring of fish capture, to develop the aquaculture sector, to determine marine conservation zones, and to regionalize marine and fisheries research. Tuna habitats are covered by five and two FMZs located in the eastern and western Indonesian waters, respectively. The eastern zones include WPP-RI 713 (Makassar Strait and Flores Sea), WPP-RI 714 (Banda Sea), WPP-RI 715 (Ceram Sea, Halmahera Sea and Tomini Bay), WPP-RI 716 (Celebes Sea), and WPP-RI 717 (Cenderawasih Bay, Pacific Ocean) (Error! Reference source not found.). The western zones include WPP-RI 572 (West of Sumatra) and 573 (South of Java, Bali, Nusa Tenggara (Figure 1.8Error! Reference source not found.).
Figure 1.8: Indonesian fishing management zones.
The primary tuna catch of the Indonesian waters comprises skipjack, yellowfin, bigeye, albacore (Thunnus alalunga), and southern bluefin tuna (Williams, 2009). The available catch data from the region are less reliable for tuna population dynamics assessment. Landing catch data have been collected for statistical purposes using
10
Yamamoto’s method since the mid-1970s (Proctor et al., 2003; Retnowati and Satria, 2013). The type of data collected is more useful for assessing annual national fish production than for stock assessment (Proctor et al., 2003). In addition, tuna catches were only grouped into two categories: large tuna consisting of yellowfin, bigeye, albacore, and southern bluefin tuna; and skipjack (Ingles et al., 2008; Ishida et al., 1994; Proctor et al., 2003). Since 2005, each tuna species has its own category in the national statistical system. The national tuna catch during 2005–2014 was largely dominated by skipjack (Directorate General of Capture Fisheries, 2015)(Figure 1.9).
An increasing demand for fishing stock assessment data led the government to inaugurate three programs: observer, vessel monitoring system (VMS), and logbooks. The first program started in 2005 and ran for the following eight years, with scientific observers deployed in 80 longline trips (Satria et al., 2012). The VMS was regulated through ministerial decree No 05/2008 and required fishing vessels of 30 gross tons or above that operated in the Indonesian waters to install the system (Satria et al., 2012). The last program instructed fishing vessels of five gross tons or above to report their catch and effort when returning to the fishing port (Satria et al., 2012).
A national committee for stock assessment was established in 2009 by Minister of Marine Affairs and Fisheries (Ministerial Decree No 9/2009). The committee members consist of selected Indonesian fisheries scientists working over a period of
Figure 1.9: Annual tuna catch captured from the Indonesian waters (Source of data: Directorate General of Capture Fisheries, 2015).
11
three years. The committee is responsible to make a regular fish stock assessment in the Indonesian fishing management areas as a basis for determining a status of fish stock.
Lack of fishing dataset does not allow stock to be assessed annually. The last stock assessment devoted specifically for tuna was conducted in 2011 proposing that maximum sustainable yield (MSY) of 274,000 metric tons whatever tuna species, except for skipjack which 332,900 metric tons (Sunoko and Huang, 2014). According to the threshold, the bigeye tuna stock is classified as “overfishing” in six FMZs (WPP-RI 572, 573, 714-717), while for the Makassar Strait and Flores Sea (WPP-RI 713), the stock is classified as “subject to overfishing” (fishing mortality at the MSY level). The status of tuna stock was adopted through the Marine Affairs and Fisheries Ministerial Decree of August 3, 2011. However, there is scientific demand addressing the determination method and limited information suggests that the committee is using holistic stock assessment method as best compromise with the lack of data.
The eastern region
The tuna catch of the eastern region during 2005–2014 was dominated by skipjack, and the highest annual catch of the species was derived from the Ceram Sea, the Halmahera Sea, and Tomini Bay (WPP-RI 715) (Directorate General of Capture Fisheries, 2015). The annual tuna catch of the region is illustrated in Figure 1.10. The high catch was linked to the wide use of FADs by pole-and-line and purse seine fishery since the 1980s (McElroy and Uktolseja, 1992; Monintja and Mathews, 1999). The tuna catch was dominated by yellowfin captured by longline fishery before the introduction of the FADs (Naamin and Bahar, 1994).
12 Figure 1.10: Annual catch of skipjack, yellowfin, and bigeye from eastern Indonesian waters
(Source of data: Directorate General of Capture Fisheries, 2015).
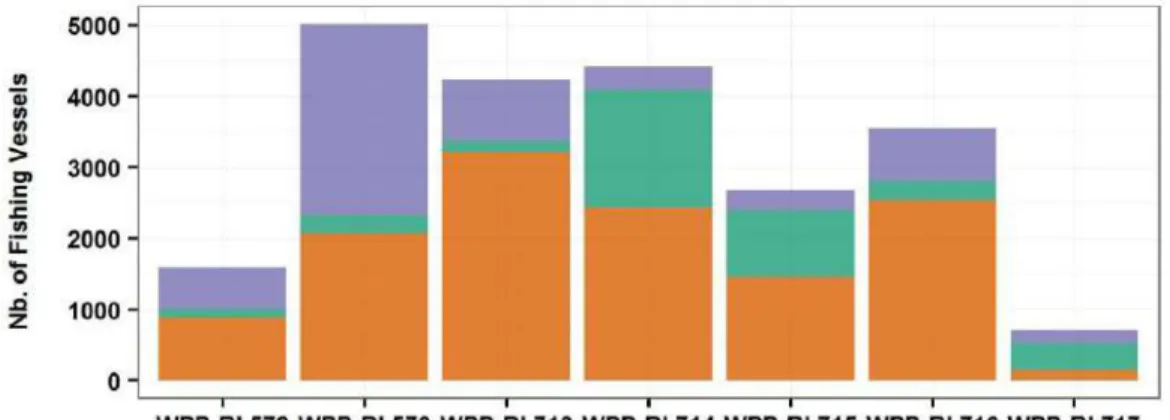
The Directorate General of Capture Fisheries (2015) released number of fishing vessels operating in each FMZ for 2014. The gear classification is based on gear mechanism and does not reflect the fish target. Nevertheless, there are two sub-classifications corresponding directly to a tuna target: pole and line, and tuna longline. For purse seine, the vessel number is aggregated from all types of purse seine targeting various pelagic fish. The vessel number of these three categories for tuna FMZs is illustrated in Figure 1.11. For the eastern region (WPP-RI 713-717), the number of purse seine vessels is generally higher than that of pole-and-line and longline ones (Figure 1.11). A large number of pole-and-line vessels operate in two zones: WPP-RI 714 (1,644 vessels) and WPP-RI 715 (942) (Figure 1.11).
The purse seine and pole and line in the region are widely known to associate with FADs. As the devices aggregate schools of fish, these fisheries benefited from a high income during the early development of FADs through both a reduction in fuel consumption and the use of live bait. Increased fuel prices led to government-subsidized FADs making the devices more intensively deployed (Monintja and Mathews, 1999). The negative effect of the devices on tuna stock occurs when the fishery captures juvenile yellowfin, causing a reduction in growth by overfishing (Ingles et al., 2008). Williams and Terawasi (2013) reported that the domestic surface fisheries of the eastern Indonesian waters captured a large number of small yellowfin ranging from 20 to 50 cm
13
in length. In addition, a yellowfin spawning ground was identified in the Celebes Sea (WPP-RI 716) (Ingles et al., 2008; Yamanaka, 1989).
Figure 1.11: Number of pole-and-line, purse seine, and longline vessels operated in tuna fishing management zones in 2014 (Source of data: Directorate General of Capture Fisheries, 2015).
The western region
In the western region, the tuna catch during 2005–2014 largely came from the south of Java, Bali, and Nusa Tenggara (WPP-RI 573), where the primary tuna catch was skipjack (Directorate General of Capture Fisheries, 2015)(Figure 1.12). Variability of the tuna catch was associated with the type of fishing gear that is largely operated in the region. The skipjack catch has increased since 2009 in the WPP-RI 573 and since 2013 in the WPP-RI 572 (Figure 1.12). Irianto et al. (2013) indicated that the rise of the skipjack catch corresponds to an increase in the number of purse seine vessels landing tuna catches in fishing ports in the WPP-RI 573. The artisanal fishery in association with the FADs captures skipjack along with a large number of juvenile yellowfin tuna and probably bigeye tuna (Proctor et al., 2003). A large yellowfin tuna catch occurred when a high number of shallow longlines were operated before the early 1980s, and since then, deep longlines have been widely used and have led to an increased bigeye tuna catch (Sadiyah et al., 2011). The number of operated longline vessels in the WPP-RI 573 in 2014 was slightly higher than that of the purse seine vessels (2,696 vs 2,068 vessels) (Figure 1.11). Bigeye, yellowfin, albacore, and southern bluefin tuna are also known to spawn in the western region, particularly in the southern Indonesian waters and the northern Australian waters (Farley et al., 2014; Kiyofuji and Ochi, 2016; Proctor et al., 2003; Stobberup et al., 1998; Suman et al., 2013).
14 Figure 1.12: Annual tuna catch derived from the western Indonesian waters
(Source of data: Directorate General of Capture Fisheries, 2015).
1.4 INDESO fish population dynamics
Within the Indonesian Ministry of Marine Affairs and Fisheries (KKP), the INfrastructure DEvelopment of Space Oceanography project (INDESO) was implemented to support the KKP with a set of surveillance technologies to monitor dynamics in the coastal and oceanic ecosystems of Indonesia. The aim of the center will be to predict changes in fishery resources, protect them (mainly from illegal fishing) and develop them. To achieve this, the Balitbang KP has assigned over a hundred Indonesian experts to work on these topics. It has provided them with a large infrastructure including the latest space technologies for acquiring, processing and analyzing high-resolution satellite data, and modeling and forecasting the state of the ocean and the dynamics of several key marine species. The project includes seven applications: control of unregulated illegal fishing, monitoring of fish population dynamics, coral reef monitoring, shrimp farming, seaweed farming, integrated coastal zone and mangrove management, and oil spill monitoring. A capacity building for PhD level studies is included for each application. In collaboration with Collecte Localisation Satellites (CLS), its Marine Ecosystem Department is in charge of developing an operational regional fish population dynamics for three tuna species, skipjack, yellowfin and bigeye. The application should estimate the status of these stocks at large basin
15
scale and then provide the initial conditions to implement the regional version. The present PhD thesis is part of this project and application.
The regional stock assessment is conducted using the Spatial Ecosystem and Population Dynamics Model (SEAPODYM) that was originally developed for highly migratory species of the Pacific Ocean. Therefore variables of the model at basin scale are well parameterized for the region. Since dynamics of Indonesian tuna population is influenced by the Pacific and the Indian Ocean, variables of the model are required to be parameterized for both oceans. A first basin scale configuration is developed at coarse resolution of 2° x month. The basin parameterization requires a standardized geo-referenced fishing dataset from the Indian Ocean Tuna Commission (IOTC). A series of standardization steps is required for preparing the dataset for each species. This standardization of the Indian Ocean bigeye tuna fisheries dataset constitutes the first part of PhD study.
Once the basin parameterization is achieved for both oceans, the spatio-temporal resolution of the model needs to be downscaled to 0.25° spatial and weekly temporal resolution. Then, the output is used as a basis for constructing initial condition and determining open boundary condition (OBC) for regional model (1/12°, daily). The sequential process of constructing regional model is presented in the second part of this PhD study.
SEAPODYM uses both physical and biogeochemical forcings that are derived from numerical models, satellites and in situ climatological observations. The current version of the regional model uses outputs of the Nucleus for European Modelling of the Ocean (NEMO) (Tranchant et al., 2016) as physical forcings. The biogeochemical variables consist of net primary productivity, depth of euphotic layer, and dissolved oxygen. The first and second variables are derived from the Vertically Generalized production Model (VGPM) (Behrenfeld and Falkowski, 1997). The photosynthetic model uses observations of ocean colour satellites. The dissolved oxygen is derived from climatological observation of the World Ocean Atlas (WOA). As part of INDESO project, the model of Pelagic Interactions Scheme for Carbon and Ecosystem Studies (PISCES) is also implemented in the regional INDESO operational modeling system (Gutknecht et al., 2016). The last part of this study will present the preliminary results with SEAPODYM using the biogeochemical model variables replacing the satellite-derived and climatological forcings.
16
1.5 Synthèse de l’Introduction
Les eaux indonésiennes sont bien connues pour leur grande productivité en thons. L’Indonésie est parmi les cinq plus grands pays producteurs de thonidés depuis les années 1990 (McElroy et Uktolseja, 1992, Sunoko et Huang, 2014, Williams, 2009). La variabilité de la production de thon en Indonésie est influencée par la dynamique des stocks du Pacifique et de l'océan Indien.
La WCPFC (2015) a estimé que le total des captures nominales de thon obèse dans l'océan Pacifique ouest et central pour la période 1950-2014 était de 5 808 412 tonnes métriques. La plus grande proportion de données provient des palangres (63%), suivie par les sennes coulissantes (27%) et les canneurs (4,6%). D'autres engins de pêche ont capturé seulement une petite partie de la capture de thon obèse (<2%). Le stock de thon obèse dans la région WCPO est actuellement considéré surpêché (Harley et al., 2014).
Le thon obèse de l'océan Indien est capturé par trois groupes d'engins: les palangres, les sennes coulissantes et une variété d'autres engins. Pour la période 1950-2014, les palangres ont contribué au pourcentage de capture le plus élevé (74,2%), suivies par les sennes coulissantes (18,5%) et les autres engins (7,3%). L'évaluation des stocks de 2015 a indiqué que le stock n'était pas surexploité ni surpêché (IOTC, 2015b). La gestion des ressources thonière de l’Indonésie doit tenir compte de ces différentes influences dans chacun des océans. Les habitats des thons dans la région indonésienne ne sont actuellement pas identifiés et la vulnérabilité des stocks tant aux pressions de pêche qu'aux changements climatiques est inconnue. Les données de captures disponibles dans la région sont également moins fiables pour permettre l'évaluation de leurs dynamiques de populations. Les données sur le débarquement ont été recueillies à des fins statistiques en utilisant la méthode de Yamamoto depuis le milieu des années 1970 (Proctor et al., 2003; Retnowati et Satria, 2013). Le type de données collectées est plus utile pour évaluer la production nationale annuelle de poisson que pour l'évaluation des stocks (Proctor et al., 2003). En outre, les captures de thons ont été seulement regroupées en deux catégories: celles des « gros thons » constituée de l'albacore, du thon obèse, du germon et du thon rouge du Sud; Et celle du listao (Ingles et al., 2008; Ishida et al., 1994, Proctor et al., 2003). Depuis 2005, chaque espèce de thon a sa propre catégorie dans le système statistique national. La demande pressante de données pour l'évaluation des stocks de pêche a incité le gouvernement à
17
inaugurer trois programmes: le déploiement d'observateurs, le système de surveillance des navires (VMS) et l’instauration des journaux de bord des navires. Le premier programme a démarré en 2005 et a continué les huit années suivantes, avec des observateurs scientifiques déployés dans 80 campagnes de pêche à la palangre (Satria et al., 2012). Le VMS a été réglementé par un décret ministériel no 05/2008 qui exigeait d’installer ce système sur les navires de pêche de 30 tonneaux de jauge brute ou plus qui opéraient dans les eaux indonésiennes (Satria et al., 2012). Le dernier programme exigeait que les navires de pêche de cinq tonneaux de jauge brute ou au-dessus déclarent leur capture et effort de pêche lors du retour au port (Satria et al., 2012).
Un comité national pour l'évaluation des stocks a été créé en 2009 par le Ministère Indonésien des affaires maritimes et des pêches (décret ministériel n° 9/2009). Les membres du comité incluent des scientifiques indonésiens sélectionnés qui travaillent sur une période de trois ans. Le comité est chargé d'effectuer une évaluation régulière dans les zones de gestion des pêches en Indonésie afin de déterminer l'état des stockss. Le manque de données de pêche ne permet pas de réaliser un inventaire annuel des stocks. La dernière évaluation consacrée spécifiquement aux thons a été réalisée en 2011, révélant que le rendement maximal soutenu (RMS) était de 274 000 tonnes pour chacune des espèces thonières - thon obèse, albacore, albacore et thon rouge du Sud - alors que pour le listao, il était de 332 900 tonnes (Sunoko et Huang, 2014). Le stock de thon obèse est consideré «surpêché» dans l'océan Indien à l'ouest de Sumatra et dans le sud de Java, la mer de Banda, la mer d'Halmahera, la mer de Célèbes et l’ouest de l'océan Pacifique, tandis que pour le détroit de Makassar et la mer de Flores, il fait l’objet d’une surpêche» (mortalité par pêche au dessus de celle estimée pour le RMS).
Dans le Ministère indonésien des affaires maritimes et des pêches (KKP), le projet Infrastructure de développement de l'océanographie spatiale (INDESO) a été mis en place pour soutenir le KKP avec des technologies de surveillance et de modélisation pour étudier et surveiller la dynamique des écosystèmes côtiers et marins de l'Indonésie. L'objectif du centre est de prévoir les changements affectant les ressources halieutiques, de protéger ces ressources (principalement de la pêche illégale) et de soutenir leur exploitation durablement. Pour cela, le Balitbang KP a assigné plus d'une centaine d'experts indonésiens pour travailler sur ces sujets. Il leur a fourni une grande infrastructure incluant les technologies spatiales les plus récentes pour acquérir, traiter et analyser des données satellitaires à haute résolution et pour modéliser et prévoir l'état de l'océan et la dynamique de plusieurs espèces marines essentiels. Le projet inclut sept
18
applications: le contrôle de la pêche illégale non déclarée et non réglementée, le contrôle de dynamique des populations de trois principales espèces de thons, la surveillance des récifs coralliens, le suivi des fermes aquacoles de crevettes, l'élevage des algues, la gestion intégrée des zones côtières et des mangroves et la surveillance des pollutions par le pétrole et les dégazages en mer. Un accompagnement par des formations doctorales est inclus pour chaque application. En collaboration avec Collecte Localisation Satellites (CLS), son Département des écosystèmes marins est chargé de développer un modèle régional opérationnel de dynamiques des populations de poissons pour trois espèces de thons : le listao, l'albacore et le thon obèse. L'application devrait aider à estimer l'état de ces stocks à l’échelle du bassin océanique pour fournir ensuite les conditions initiales et aux frontières de la version régionale. La présente thèse fait partie de ce projet et de cette application.
Le modèle mis en place est le modèle spatial d'écosystème et de dynamiques de population SEAPODYM qui a été initialement conçu pour les espèces thonières de l'océan Pacifique. Étant donné que la dynamique de la population de thonidés indonésienne concerne également l'océan Indien, les paramètres du modèle doivent être adaptés aux deux océans. Une première configuration à l'échelle du bassin est développée à une résolution grossière de 2 ° x mois. Le paramétrage du modèle nécessite des données de pêche géoréférencées disponibles au près de la Commission des thons de l'océan Indien (IOTC). Néanmoins, elles demandent à être standardisées et ajustées aux captures totales. Cette tâche, concernant le thon obèse, constitue la première partie de cette thèse.
Une fois la paramétrage du modèle acquis pour les deux océans, la résolution spatio-temporelle du modèle doit être réduite à une résolution spatiale 0.25 ° et hebdomadaire. Ensuite, la simulation grande échelle est utilisée comme base pour fournir les conditions initiales et déterminer les conditions aux frontières ouvertes (OBC) du modèle régional (1/12 °, journalier). Le processus séquentiel de construction du modèle régional est présenté dans la deuxième partie de cette étude de doctorat.
SEAPODYM utilise des forçages physiques et biogéochimiques qui sont obtenus à partir de modèles numériques, de satellites et d'observations climatologiques in situ. La version actuelle du modèle régional utilise les sorties du modèle de circulation océanique NEMO (Nucleus for European Modeling of the Ocean) (Tranchant et al., 2016) comme forçages physiques. Les variables biogéochimiques sont la productivité primaire nette, la profondeur de la couche euphotique et l'oxygène
19
dissous. Les deux premières variables sont obtenues à partir du modèle VGPM (Behrenfeld et Falkowski, 1997). Ce modèle utilise des observations satellitaires de la couleur des océans pour estimer la production primaire. La concentration en oxygène dissous est dérivée de l'observation climatologique de l'Atlas de l’océan mondial (WOA). Dans le cadre du projet INDESO, le modèle PISCES est également mis en œuvre dans le système régional de modélisation opérationnelle (Gutknecht et al., 2016). La dernière partie de cette étude présentera les résultats préliminaires avec SEAPODYM en utilisant les variables du modèle biogéochimique en remplaçement des forçages dérivés du satellite et climatologiques.
References
Aires-da-Silva, A. and Maunder, M. N.: Status of bigeye tuna in the eastern Pacific Ocean in 2012 and outlook for the future, in Inter-American Tropical Tuna Commission, Stock Assessment Report, vol. 8, pp. 31–185., 2013.
Allen, R.: International management of tuna fisheries.Arrangements, challenges and a way forward, Food and Agriculture Organization of the United Nations. [online] Available from: http://www.fao.org/docrep/012/i1453e/i1453e00.htm, 2010.
Behrenfeld, M. J. and Falkowski, P. G.: Photosynthetic rates derived from satellite-based chlorophyll concentration, Limnol. Oceanogr., 42(1), 1–20, 1997.
Bigelow, K. A., Hampton, J. and Miyabe, N.: Application of a habitat-based model to estimate effective longline fishing effort and relative abundance of Pacific bigeye tuna (Thunnus obesus), Fish. Oceanogr., 11(3), 143–155, 2002.
Davies, T. K., Mees, C. C. and Milner-Gulland, E. J.: The past, present and future use of drifting fish aggregating devices (FADs) in the Indian Ocean, Mar. Policy, 45, 163–170, doi:10.1016/j.marpol.2013.12.014, 2014.
Directorate General of Capture Fisheries: Statistics of Marine Capture Fisheries by Fisheries Management Area (FMA), 2005-2014, Directorate General of Capture Fisheries Indonesia., 2015.
Farley, J. H., Eveson, J. P., Davis, T. L. O., Andamari, R., Proctor, C. H., Nugraha, B. and Davies, C. R.: Demographic structure, sex ratio and growth rates of southern bluefin tuna (Thunnus maccoyii) on the spawning ground, PLoS One, 9(5), doi:10.1371/journal.pone.0096392, 2014.
Fonteneau, A., Chassot, E. and Bodin, N.: Global spatio-temporal patterns in tropical tuna purse seine fisheries on drifting fish aggregating devices (DFADs): Taking a historical perspective to inform current challenges, Aquat. Living Resour., 48, 37–48, doi:10.1051/alr/2013046, 2013.
Gutknecht, E., Reffray, G., Gehlen, M., Triyulianti, I., Berlianty, D. and Gaspar, P.: Evaluation of an operational ocean model configuration at 1/12 spatial resolution for the Indonesian seas (NEMO2.3/INDO12) - Part 2: Biogeochemistry, Geosci. Model Dev., 9(4), 1523–1543, doi:10.5194/gmd-9-1523-2016, 2016.
20
tuna in the western and central Pacific Ocean, West. Cent. Pacific Fish. Comm. WCPFC-SC10-2014/SA-WP-01, 2014.
Ingles, J., Flores, J., Mustohof, I. and Mous, P.: Getting Off the Hook: reforming the tuna fisheries of Indonesia, WWF-Coral Triangle Initiative., 2008.
IOTC: Status of the Indian Ocean bigeye tuna (BET:Thunnus obesus) resource., 2015. Irianto, H. E., Wudianto, Satria, F. and Nugraha, B.: Tropical Tuna Fisheries in the Indian Ocean of Indonesia, Indian Ocean Tuna Comm. IOTC-2013-WPTT15-20, (October), 1–14, 2013.
Ishida, K., Yamamoto, T. and Gaffa, B.: Development of fisheries for tuna and tuna-like fish in Indonesia with particular reference to the jakarta based tuna longline fishery, Indo-Pacific Tuna Dev. Manag. Program. IPTP/92/WP/26, 37, 1994.
Kiyofuji, H. and Ochi, D.: Proposal of alternative spatial structure for skipjack stock assessment in the WCPO Skipjack distribution and migration, West. Cent. Pacific Fish. Comm. WPCFC-SC12-2016/SA-IP-09, (August), 2016.
Lee, P., Chen, I. and Tzeng, W.: Spatial and Temporal Patterns of Bigeye Tuna (Thunnus obesus) in the Indian Ocean, Zool. Stud., 44(2), 260–270, 2005.
Longhurst, A. R.: Ecological geography of the sea, Academic Press., 2007.
Lopez, J., Moreno, G., Sancristobal, I. and Murua, J.: Evolution and current state of the technology of echo-sounder buoys used by Spanish tropical tuna purse seiners in the
Atlantic , Indian and Pacific Oceans, Fish. Res., 155, 127–137,
doi:10.1016/j.fishres.2014.02.033, 2014.
Majkowski, J., Arrizabalaga, H., Carocci, F. and Murua, H.: Tuna and tuna-like species, in Review of the state of world marine fishery resources, pp. 227–243, Food and Agriculture Organization of the United Nations., 2011.
McElroy, J. K. and Uktolseja, J. C. B.: Skipjack pole-and-line operations in east Indonesia A comparative analysis of catch performance, Mar. Policy, (November), 1992.
Monintja, D. R. and Mathews, C. P.: The skipjack fishery in Eastern Indonesia: distinguishing the effects of increasing effort and deploying rumpon FADs on the stock, in Peche thoniere et dispositifs de concentration de poisons:colloque Caraibe-Martinique, edited by J. LeGall, P. Cayre, and M. Taquet, pp. 435–448, Trois-Ilets 15-19 October 15-1999., 15-1999.
Naamin, N. and Bahar, S.: Interaction in the yellowfin tuna fisheries of the eastern part of Indonesian waters, in Interaction of Pacific Tuna fisheries. Volume 1-Summary report and papers on interaction, edited by R. S. Shomura, J. Majkowski, and S. Langi, pp. 199–212, Food and Agriculture Organization of the United Nations., 1994.
Okamoto, H., Miyabe, N. and Inagake, D.: Interpretation of high catch rates of bigeye tuna in 1977 and 1978 observed in the Japanese longline fishery in the Indian Ocean,
IOTC Proc., 4, 169–190 [online] Available from:
http://www.iotc.org/sites/default/files/documents/proceedings/2001/wpm/IOTC-2001-WPM-01.pdf, 2001.
Pianet, R., Delgado de Molina, A., Doriso, J., Bretaudeau, P., Herve, A. and Ariz, J.: Statistics of the main purse seine fleets fishing in the Indian Ocean (1981-2007),
21
http://www.iotc.org/sites/default/files/documents/proceedings/2008/wptt/IOTC-2008-WPTT-05.pdf, 2008.
Proctor, C. H., Merta, I. G. S., Sondita, M. F. A., Wahju, R. I., Davis, T. L. O. and Andamari, R.: A review of Indonesia’s Indian Ocean Tuna Fisheries, CSIRO Marine Research., 2003.
Retnowati, S. D. and Satria, F.: Received : 20 November 2013 Fishery Statistic Data Collection System in Indonesia, , (November), 2013.
Sadiyah, L., Dowling, N. and Prisantoso, B. I.: Changes in fishing pattern from surface to deep longline fishing by the Indonesian vessels operating in the Indian Ocean, Indones. Fish Resour. J., 17(2), 87–99, 2011.
Satria, F., Suman, A., Widodo, A., Sadiyah, L. and Nugraha, B.: Indonesia National Report to the Scientific Committee of the Indian Ocean Tuna Commission, 2012, Indian Ocean Tuna Comm. IOTC-2012-SC15-NR10 Rev_1, 1–18, 2012.
Sibert, J., Senina, I., Lehodey, P. and Hampton, J.: Shifting from marine reserves to maritime zoning for conservation of Pacific bigeye tuna (Thunnus obesus), Proc. Natl. Acad. Sci. U. S. A., 18221–18225, doi:10.1073/pnas.1209468109, 2012.
Stobberup, K. ., Marsac, F. and Anganuzzi, A. .: A review of the biology of bigeye tuna,
Thunnus obesus, and the fisheries for this species in the Indian Ocean, in Proceedings of
the First World Meeting on Bigeye Tuna (Special Report No 9), edited by R. B. Deriso, W. H. Bayliff, and N. . Webb, pp. 81–128, La Jolla, California., 1998.
Suman, A., Irianto, H. E., Amri, K. and Nugraha, B.: Population structure and reproduction of bigeye tuna (Thunnus obesus) in Indian Ocean at western part of Sumatra and southern part of Java and Nusa Tenggara, Indian Ocean Tuna Comm. IOTC-2013-WPTT15-21, (October), 1–14, 2013.
Sunoko, R. and Huang, H.: Indonesia tuna fisheries development and future strategy, Mar. Policy, 43, 174–183, doi:10.1016/j.marpol.2013.05.011, 2014.
Tranchant, B., Reffray, G., Greiner, E., Nugroho, D., Koch-Larrouy, A. and Gaspar, P.: Evaluation of an operational ocean model configuration at 112 spatial resolution for the Indonesian seas-Part1: Ocean physics, Geosci. Model Dev., 9(4), 1037–1064, doi:10.5194/gmd-9-1523-2016, 2016.
Ward, P. and Hindmarsh, S.: An overview of historical changes in the fishing gear and practices of pelagic longliners , with particular reference to Japan’s Pacific fleet, Rev. Fish Biol. Fish., 17, 501–516, doi:10.1007/s11160-007-9051-0, 2007.
WCPFC: Tuna Fishery Yearbook 2014, Western and Central Pacific Fisheries Commission., 2015.
Williams, P.: Indonesian tuna fisheries: getting to know our neighbours, SPC Fish.
Newsl., (129), 29–33 [online] Available from:
http://www.spc.int/DigitalLibrary/Doc/FAME/InfoBull/FishNews/129/FishNews129_2 9_Williams.pdf, 2009.
Williams, P. and Terawasi, P.: Overview of tuna fisheries in the western and central Pacific Ocean, including economic conditions-2012, in Scientific Committe Ninth Regular Session, Western and Central Pacific Fisheries Commission., 2013.
Yamanaka, K. L.: Age, growth, and spawning of yellowfin tuna (Thunnus albacares) Bonnaterre 1788, in the southern Philippines, University of British Columbia., 1989.
23
Chapter 2 Biology and behavior of bigeye tuna
Contents
2.1 Reproduction ... 23 2.2 Movement ... 24 2.3 Population structure ... 25 2.4 Age and growth ... 25 2.5 Natural mortality ... 27 References ... 27
2.1 Reproduction
Warm tropical waters with a sea surface temperature above 24°C are acknowledged as spawning areas for bigeye tuna (Schaefer, 2001). In the tropical Indian Ocean, the potential area spreads over a wide region, and until now, there have been only limited studies to investigate the presence of sexually mature female and male bigeye tuna. Regions near Timor (Eastern Indian Ocean) were recognized by Japanese scientists as a spawning ground in March because of the appearance of sexually mature female bigeye tuna (Stéquert and Marsac, 1989). The period of spawning is estimated to coincide with the migration of bigeye tuna from subtropical to tropical regions during the summer months (Farley et al., 2006; Mohri and Nishida, 1999). In the Western Indian Ocean, Zudaire et al., 2016 estimated that the spawning period occurs from January to March as indicated by ovaries development of bigeye tuna sampled.
Individual tuna are required to reach a certain age/size to be physiologically capable of producing gametogenesis in response to environmental conditions (Schaefer, 2001). Understanding the first age/size of maturity is important for constructing the structure of a population. In general, bigeye tuna reach the age of first maturity at three years, which corresponds to a size of 85–120 cm (Stéquert and Marsac, 1989; Stobberup et al., 1998; Zudaire et al., 2016). Farley et al. (2006) suggested that the first age of maturity could vary according to area and/or depth sampled. They revealed that the first maturity of bigeye tuna sampled from a handline fishery operating in Northern
24 Queensland is 102.4 cm (~2.4 years old). Using bigeye tuna catch data captured from the eastern Indian Ocean, Notmoorn (2004) found a younger age of maturity: 88.08 cm (~1.97 years) and 86.85 cm (~1.92 years) for female and male bigeye tuna, respectively. Studies on the Indian Ocean bigeye tuna larvae distribution are limited. Only three regions have been recognized to have a high concentration of larvae: the region between southern Indonesia and northern Australia, south of the Bay of Bengal, and off the northeastern coast of the Maldives (Stéquert and Marsac, 1989; Stobberup et al., 1998).
2.2 Movement
Bigeye tuna are known as long-distance-swimming fish (Hampton et al., 1998). Using global tag-recovery data, Fonteneau and Hallier (2015) estimated that the average distance per month traveled by the fish is 728 nautical miles. The estimated distances per month in miles are different for each ocean/sub-ocean: 951 miles for the Eastern Pacific Ocean, 530 miles for the Atlantic Ocean, 918 miles for the Indian Ocean, and 514 miles for the Western Pacific Ocean. With regard to swimming speed, Magnuson (1973) observed that a bigeye tuna with a 55 cm fork length (FL) is able to swim continuously with a minimum speed of 1.08 body lengths per second, while the smaller fish (36 cm FL) are able to move faster (1.36 body lengths per second).
Bigeye tuna stay in the surface layer during the night and migrate vertically between surface and deep layers during the day (Brill et al., 2005; Matsumoto et al., 2013). The ability to penetrate deeper layers develops in direct correlation with increasing body length (Matsumoto et al., 2013). Adult bigeye tuna can dive to an oceanic layer deeper than 500 m and are able to perform normal metabolic processes in layers where the temperature is 5°C and the concentration of oxygen less than 1.5 mL/L (Brill et al., 2005).
Physiological adaptations of bigeye tuna to extreme conditions are supported by two specific systems: a vascular countercurrent heat exchanger and unique blood characteristics (Brill et al., 2005; Lowe et al., 2000). The former system provides thermal inertia to reduce changes of muscle temperature when the fish experience low temperature. The quantity of thermal inertia is proportional to the length of individual tuna; thus, larger bigeye tuna have a larger thermal inertia that enables them to stay for longer periods in low temperatures (Brill et al., 2005). The blood of bigeye tuna has a high affinity for oxygen that enables the fish to be tolerant of hypoxic conditions. The
25 blood characteristic enables bigeye tuna to maintain a normal metabolic rate in a low-oxygen environment (Brill et al., 2005; Lowe et al., 2000). However, the affinity level is reduced when blood is transported to the vascular countercurrent heat exchanger system, which decreases the oxygen supply to muscles. To maintain a muscle temperature above the oceanic temperature, bigeye tuna are required to make extensive vertical excursions to the warmer layers (Brill et al., 2005).
The main purpose of penetrating deeper layers is to search for higher concentrations of prey (Brill et al., 2005; Matsumoto et al., 2013). The vertical movement of bigeye tuna mirrors the vertical movement of small nektonic organisms (Brill et al., 2005). The diet of the fish comprises nektonic organisms inhabiting the epipelagic and mesopelagic layers, and the habitat of the fish also consists of these layers (Stequert and Conand, 2004; Stobberup et al., 1998). The vertical movements of micronekton correspond to predator avoidance; however, the physiological ability of predators (e.g., bigeye tuna) has evolved to enable them to hunt micronekton in deeper layers (Brill et al., 2005). Potier et al. (2004) observed that the crustacean is the exclusive diet of bigeye tuna captured by the purse seine fishery in the western Indian Ocean, whereas diets of bigeye tuna from longline fishery are dominated by cephalopods and mesopelagic fish (Scopelarchidae and Paralepididae). A similar diet composition that consisted of cephalopods, pelagic crab Charibis smithi, and Paralepididae fish was observed in the stomachs of bigeye tuna captured around the Seychelles and Mauritius (Stobberup et al., 1998).
2.3 Population structure
The bigeye tuna of the Indian Ocean are considered to be a single population stock having a different genetic pool from those of the Pacific and Atlantic Ocean. Chiang et al. (2008) analyzed DNA of bigeye tuna derived from the Cocos Islands, the southeastern Indian Ocean, the southwestern Indian Ocean, and the Seychelles and concluded that there is no genetic differentiation among the sampled fish. Farley et al. (2006) proposed to separate stock between the Indian Ocean and the Pacific Ocean, as both populations showed a different growth rate..
2.4 Age and growth
Age-structured stock assessment requires accurate estimation of the fish age to determine growth, age of first maturity, life-span, and natural and fishing mortality