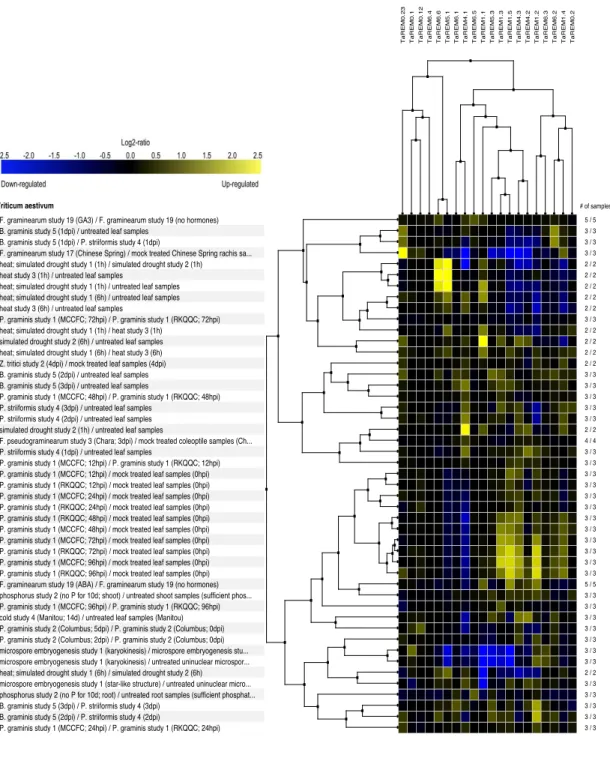
Figure S2. A Gene expression analysis of twenty TaREM genes from published RNA-Seq data. Relative gene expression is presented as a colored heat-map where yellow color indicates up-regulated genes, blue color indicates down-regulated genes and black color represents unchanged relative gene expression. Pearson’s based hierarchical clustering algorithm is used to cluster REM genes and different perturbations based on the pattern of gene expression. The color reflected the log ratio with yellow indicating up-regulation and blue down-regulation.
Figure S2. A Gene expression analysis of twenty
1
0
0
Texte intégral
Figure
Documents relatifs
Depuis la réapparition du tramway dans l’agglomération parisienne (ligne T1 entre Saint-Denis et Bobigny en 1992), s’est tissé un réseau incomplet de neuf lignes (105
In the following, we will also need the fact that if the set of vectors given as input to the LLL algorithm starts with a shortest non-zero lattice vector, then this vector is
In this study, we characterize distribution of glycan receptors going beyond terminal sialic acid linkage in the cranial and caudal regions of the ferret trachea (upper
Response to auxin, gibberellin and brassinosteroid stimuli This category was obtained by merging three different on- tologies (responses to gibberellin, auxin stimulus and
Arrêtons-nous un petit moment, vos caricatures ciblaient surtout les fanatiques et les extrémistes musulmans, de ma part je vous donne bon droit, ces gens là ont tort, ils ont
In this present study, we explored the expression of MMP-9 in relation to the volume of ischemia as assessed in perfusion imaging and the volume of the infarct lesion as assessed
Trouve un nom générique pour regrouper les noms particuliers de chaque liste... la gourmandise - la colère - le mensonge -
Méthode : la population active étant à chaque âge le produit de la population de cet âge par son taux d’activité, son évolution entre deux dates peut s’écrire comme la somme
