HAL Id: tel-01737211
https://tel.archives-ouvertes.fr/tel-01737211
Submitted on 19 Mar 2018HAL is a multi-disciplinary open access archive for the deposit and dissemination of sci-entific research documents, whether they are pub-lished or not. The documents may come from teaching and research institutions in France or abroad, or from public or private research centers.
L’archive ouverte pluridisciplinaire HAL, est destinée au dépôt et à la diffusion de documents scientifiques de niveau recherche, publiés ou non, émanant des établissements d’enseignement et de recherche français ou étrangers, des laboratoires publics ou privés.
Bo Zhang
To cite this version:
Bo Zhang. Stress Recognition from Heterogeneous Data. Human-Computer Interaction [cs.HC]. Université de Lorraine, 2017. English. �NNT : 2017LORR0113�. �tel-01737211�
AVERTISSEMENT
Ce document est le fruit d'un long travail approuvé par le jury de
soutenance et mis à disposition de l'ensemble de la
communauté universitaire élargie.
Il est soumis à la propriété intellectuelle de l'auteur. Ceci
implique une obligation de citation et de référencement lors de
l’utilisation de ce document.
D'autre part, toute contrefaçon, plagiat, reproduction illicite
encourt une poursuite pénale.
Contact : [email protected]
LIENS
Code de la Propriété Intellectuelle. articles L 122. 4
Code de la Propriété Intellectuelle. articles L 335.2- L 335.10
http://www.cfcopies.com/V2/leg/leg_droi.php
Reconnaissance de stress à partir de données
hétérogènes
Thèse
Présentée et soutenue publiquement le 03 juillet 2017 pour l’obtention du
Doctorat de l’Université de Lorraine
(mention Automatique, Traitement du signal et des images, Génie informatique) par
Bo ZHANG
Composition du jury
Laboratoire de Conception, Optimisation et Modélisation des Systèmes Rapporteurs : Christian BERGER-VACHON
Jean-Philippe BLONDÉ Examinateurs : Edwige PISSALOUX
Guy BOURHIS Yann MORÈRE Loïc SIELER
Invités : Jacques FELBLINGER Benoît BOLMONT
Ecole Doctorale IAEM Lorraine
Stress Recognition from Heterogeneous Data
Thesis
Publicly presented and supported on 03 July 2017 To obtain the
Doctorate of the University of Lorraine
(Automation, Signal and Image Processing, Computer Engineering) by
Bo ZHANG
Composition of the jury
Laboratory of Design, Optimization and Modeling of Systems Rapporteurs : Christian BERGER-VACHON
Jean-Philippe BLONDÉ Reviewers : Edwige PISSALOUX
Guy BOURHIS Yann MORÈRE Loïc SIELER
Invited experts: Jacques FELBLINGER Benoît BOLMONT
Acknowledgements
I would like to acknowledge Mr Guy Bourhis, my thesis director, for giving this opportunity to work with him and for helping me to learn how to perform the PhD study. Without his support, I could not carry out the research work of my thesis.
I would like to acknowledge Mr Yann Morère, my thesis co-director, for his support throughout my work and for his scientific and technical advices.
I would like to acknowledge Mr Loïc Sieler, my thesis co-supervisor, for his support and encouragement in the study of the embedded system.
I would like to acknowledge Mr Christian Berger-Vachon, Professor at the University of Lyon 1 and Mr Jean-Philippe Blondé, Associate professor HDR at IUT Louis-Pasteur, for agreeing to be my reviewers and for evaluating my thesis report.
I would like to acknowledge Mrs Edwige Pissaloux, Professor at the University of Rouen, for agreeing to be a member of thesis jury and for reviewing the work of my thesis.
I would like to acknowledge Mr Jacques Felblinger, Professor at the University of Lor-raine, for his presence in my thesis jury and for evaluating my work in the thesis committee.
I would like to acknowledge Mr Benoît Bolmont, Professor at the University of Lorraine, for his presence in my thesis jury and for his support in the design of the experiments.
I would also like to acknowledge Mrs Cécile Langlet for her support in the study of psy-chobiological reaction pattern.
I would also like to acknowledge Mr Camel Tanougast for his help understanding the processing of the embedded system while I studied in his course. I would like to further acknowledge Mr Dominique Méry, Mr Imed Kacem and Mr Marc Dalaut for all their advices in my PhD academic study.
I would like to thank Mr Régis Grasse for his support in the design of the experimental platform for data acquisition and for his help in solving the technical problems faced in the experiments. I would also like to thank Mr Jean-Philippe Hainaut for discussing the signal acquisition and signal analysis. I would also like to thank Mrs Wahida Handouzi, Mr Frédéric Bousefsaf and Mr Lucas Cicero for their helps in introducing the research methodology and writing codes in Matlab and for their great friendships. I would also like to thank all the students that participated in our experiments.
I would also like to thank my parents for their constant love and for their support for me in the hardest times. I would also like to thank my friends, Chaojie Wei, Wen Luo, Hang Chen and Da Li, for their helps in many matters.
Contents
Contents 3 List of Figures 7 List of Tables 9 1 Introduction 11 2 Background 15 2.1 Stress . . . 15 2.2 Stressors . . . 172.3 Modalities for stress recognition . . . 19
2.3.1 Physiological signals . . . 20
2.3.1.1 Blood volume pulse (BVP) . . . 20
2.3.1.2 Electrocardiogram (ECG) . . . 21
2.3.1.3 Respiration . . . 22
2.3.1.4 Electromyography (EMG) . . . 23
2.3.1.5 Skin temperature . . . 24
2.3.1.6 Electroencephalography (EEG) . . . 25
2.3.1.7 Electrodermal activity (EDA) . . . 26
2.3.1.8 Summary of physiological signals . . . 26
2.3.2 Facial features . . . 26 2.3.2.1 Facial expressions . . . 27 2.3.2.2 Eye movements . . . 28 2.3.2.3 Pupil dilation . . . 29 2.3.3 Voice . . . 30 2.3.4 Reaction time . . . 32 2.3.5 Additional modalities . . . 33
2.4 Literature review of the methodologies for stress recognition . . . 34
2.4.1 Stress recognition given physiological signals . . . 35
2.4.2 Stress recognition given facial features and voice . . . 37
2.5 Systems for stress recognition . . . 39
2.5.1 Embedded systems in the laboratory setting . . . 39
2.5.2 Stress monitoring systems in the commercial market . . . 45
2.6 Discussion . . . 47
2.7 Summary . . . 50
3 Experiments for signal acquisition 51 3.1 First design for signal acquisition . . . 51
3.2 Second design for signal acquisition . . . 54
3.2.1 Experimental protocol of the experiment using visual stressor . . . . 54
3.2.2 Experimental protocol of the experiment using auditory stressor . . . 57
3.3 BIOPACTM System and acquisition of physiological signals . . . 59
3.4 Preprocessing of the physiological signals . . . 59
3.5 Statistical analysis . . . 62
3.5.1 Student’s t-test . . . 62
3.5.2 Statistical analysis of the first design of the experiment . . . 63
3.5.3 Statistical analysis of the second design of the experiment . . . 65
3.5.3.1 The experiment of visual stressor . . . 65
3.5.3.2 The experiment of auditory stressor . . . 66
3.6 Discussion . . . 68
3.7 Summary . . . 69
4 Stress recognition 71 4.1 Stress recognition using physiological signals . . . 71
4.1.1 Feature extraction . . . 72
4.1.1.1 Sample mean . . . 72
4.1.1.2 Standard deviation . . . 73
4.1.1.3 First absolute difference . . . 73
4.1.1.4 Second absolute difference . . . 73
4.1.1.5 Normalized first absolute difference . . . 73
4.1.1.6 Normalized second absolute difference . . . 74
4.1.1.7 Feature normalisation . . . 74
4.1.2 Classification . . . 74
Contents 5
4.1.2.2 Our implementation of SVM . . . 77
4.2 Stress recognition using RT . . . 78
4.3 Decision fusion . . . 79
4.4 Test on a published stress data set . . . 82
4.4.1 Description of the stress data set . . . 82
4.4.2 Test results . . . 83
4.5 Test on the recordings of the first design of experiment . . . 83
4.6 Test on the recordings of the second design of experiments . . . 85
4.6.1 The experiment of visual stressor . . . 85
4.6.2 The experiment of auditory stressor . . . 87
4.7 Discussion . . . 91
4.8 Summary . . . 93
5 Implementation of the signal processing 95 5.1 Implementation on Android OS based mobile device . . . 96
5.1.1 ECG based HR computation . . . 96
5.1.2 Processing of classification . . . 97
5.1.2.1 Feature extraction . . . 97
5.1.2.2 SVM classification . . . 98
5.2 Implementation in FPGA . . . 99
5.2.1 ECG based HR computation . . . 99
5.2.2 Processing of classification . . . 101
5.2.2.1 Feature extraction . . . 101
5.2.2.2 SVM classification . . . 101
5.3 Discussion of the feasibility of implementation . . . 102
5.4 Implementation of QRS complex detection . . . 103
5.4.1 The existing FPGA-based algorithms for QRS complex detection . . 103
5.4.2 Theoretical background . . . 104
5.4.2.1 Wavelet transform . . . 104
5.4.2.2 Integer Haar Transform . . . 105
5.4.3 Proposed FPGA-based algorithm for the QRS complex detection . . . 105
5.4.4 Matlab simulation . . . 107
5.4.4.1 Comparison between the proposed detection algorithm and the algorithm proposed by Stojanovi´c . . . 111
5.4.4.2 Comparison in terms of rounding . . . 111
5.4.4.3 Comparison in terms of sampling frequency reduction . . . 114
5.4.5 FPGA implementation . . . 122
5.4.5.1 Hardware architecture of FPGA implementation . . . 122
5.4.5.2 Simulation result of the proposed system . . . 125
5.4.5.3 Hardware performance . . . 126
5.5 Discussion of the implementation in FPGA . . . 127
5.6 Summary . . . 128
6 Conclusions and prospect 131
References 135
A Mathematical functions of the Pan-Tompkins algorithm 149
List of Figures
1.1 Psypocket Project. . . 12
2.1 Central nervous system and peripheral nervous system [2]. . . 16
2.2 Automatic nervous system [1]. . . 17
2.3 An example of the PPG. . . 20
2.4 A normal electrocardiogram [108]. . . 21
2.5 An example of the respiration signal [53]. . . 23
2.6 An example of EMG signal [53]. . . 24
2.7 An example of EDA signal. . . 27
2.8 An example of vision tracking points on subject’s face used in [60]. . . 28
2.9 Illustration of wireless BAN of intelligent sensors in telemedicine [62]. . . . 41
2.10 Illustration of wireless network architecture for iCalm [40]. . . 41
2.11 Illustration of ankle worn band [40]. . . 42
2.12 Illustration of mobile healthcare system [63]. . . 43
2.13 Wearable ECG and PPG sensors [63]. . . 43
2.14 Textile structure [86]. . . 44
2.15 Front view (A) and back view (B) of vest [86]. . . 44
2.16 Left view (A) and right view (B) of ECGZ2 device [86]. . . 45
2.17 Device of StressEraserTM[3]. . . 46
2.18 Device of emWaveTM [5]. . . 46
2.19 Device of ThoughtStreamTMsystem [4]. . . 47
3.1 Display board. . . 52
3.2 BIOPACTM System. . . 53
3.3 Illustration of one RT task in the normal condition. . . 53
3.4 The experimental platform. . . 55
3.5 Schedule of the visual stressor experiment. . . 55
3.7 Stroop test. . . 57
3.8 Illustrations of Stroop task. . . 58
3.9 Schedule of the auditory stressor experiment. . . 58
3.10 The acquisition of EDA. . . 59
3.11 The acquisition of EMG. . . 60
3.12 Illustration of the ECG contamination. . . 61
3.13 Illustration of the removal of ECG contamination. . . 61
4.1 Block diagram of the stress recognition using physiological signals. . . 72
4.2 Block diagram of the stress recognition using RT. . . 79
4.3 Block diagram of decision fusion using three physiological signals and RT. . 80
5.1 Block diagram of the stress recognition. . . 96
5.2 Simplified architecture of the proposed QRS detection algorithm. x(n) is the original ECG record. Pos_QRS is the location of QRS fiducial in the detail signal CD4(n) and Pos_R_peak is the location of real R peak in x(n). . . 106
5.3 Wavelet decomposition scheme. . . 106
5.4 QRS detection using wavelet decomposition. x is the original ECG signal. . . 107
5.5 Real R peak location in the original ECG record. x(n) is the original ECG signal and the detected R peak locations are pointed with the vertical red line. 110 5.6 An example of the distortion of the ECG signal with the multiple factors of 10. 115 5.7 Zone of R peak. . . 115
5.8 Wavelet decomposition scheme. . . 119
5.9 Simplified diagram of FPGA implementation. . . 123
5.10 Architecture of the IHT block. . . 123
5.11 Architecture of one IHD module. . . 124
5.12 Architecture of the DF block. . . 125
5.13 Architecture of CMAX unit. . . 125
5.14 Illustration of the FPGA simulation results. . . 126
List of Tables
2.1 Waves bands, frequency range and individual characteristic in the EEG [116]. 25
3.1 The p-values of t-test for EDA. . . 64
3.2 The p-values of t-test for EMG. . . 64
3.3 The p-values of t-test for HRV. . . 64
3.4 The p-values of t-test for RT. . . 65
3.5 The p-value of t-test for mean (a) and standard deviation (b) of three physio-logical signals (experiment of visual stressor). . . 66
3.6 The p-value of t-test for mean of RT (a) and standard deviation of RT (b) (experiment of visual stressor ) . . . 67
3.7 The p-value of t-test for mean (a) and standard deviation (b) of three physio-logical signals (experiment of auditory stressor). . . 68
3.8 The p-value of t-test for mean of RT (a) and standard deviation of RT (b) (experiment of auditory stressor) . . . 68
4.1 Kernel functions. . . 77
4.2 Classification accuracies on the published stress data set. . . 83
4.3 Classification accuracies of SVM for the first design of experiment. . . 84
4.4 Classification accuracies of decision fusion for the first design of experiment. 84 4.5 Classification accuracies of SVM for low stress vs. high stress (experiment of visual stressor) . . . 86
4.6 Classification accuracies of SVM for medium stress vs. high stress (experi-ment of visual stressor) . . . 87
4.7 Classification accuracies of decision fusion for low stress vs. high stress (ex-periment of visual stressor) . . . 88
4.8 Classification accuracies of decision fusion for medium stress vs. high stress (experiment of visual stressor) . . . 88
4.9 Classification accuracies of SVM for low stress vs. high stress (experiment of
auditory stressor) . . . 89
4.10 Classification accuracies of SVM for medium stress vs. high stress (experi-ment of auditory stressor) . . . 90
4.11 Classification accuracies of decision fusion for low stress vs. high stress (ex-periment of auditory stressor) . . . 90
4.12 Classification accuracies of decision fusion for medium stress vs. high stress (experiment of auditory stressor) . . . 91
5.1 IBI values computed by our proposed detection algorithm. . . 108
5.2 IBI values computed by the algorithm presented in [119]. . . 109
5.3 Mean deviations for the computed IBI values. . . 110
5.4 IBI values with the multiple factors of 1000. . . 112
5.5 IBI values with the multiple factors of 100. . . 113
5.6 Mean deviations for the computed IBI values. . . 114
5.7 IBI values with the sampling frequencies of 1000Hz (QRS fiducial points de-tected in CD4(n)). . . 116
5.8 Mean deviations for the computed IBI values with the sampling frequencies of 1000Hz (QRS fiducial points detected in CD4(n)). . . 117
5.9 IBI values with the sampling frequencies of 500Hz (QRS fiducial points de-tected in CD4(n)). . . 118
5.10 Number of missed R peaks and correct detection accuracy with the sampling frequencies of 500Hz (QRS fiducial points detected in CD4(n)). . . 119
5.11 IBI values with the sampling frequencies of 500Hz (QRS fiducial points de-tected in CD3(n)). . . 121
5.12 Mean deviations for the computed IBI values with the sampling frequencies of 500Hz (QRS fiducial points detected in CD3(n)). . . 122
5.13 Performance of the modified detection algorithm. . . 123
Chapter 1
Introduction
In modern society, people face a variety of stress in their everyday life. Historically, stress has been defined as a reaction from a calm state to an excited state for the purpose of preserving the integrity of the organism [53]. In the psychobiological aspect, stress is regarded as a series of complex psychological, cognitive and behavioural reactions controlled by the human Central Nervous System (CNS) and Peripheral Nervous System (PNS).
We usually distinguish the positive stress and the negative stress [115]. The positive stress is normally beneficial to the subjects and does not need them to deal with complicated problem or adapt themselves to the new situation. If the stress is harmful to the subjects and can bring in negative consequences such as mental and physical problems, this stress is regarded as the negative stress. Normally, when we mention the “stress”, in general terms, it is the negative stress.
It has been found that when the stress derived from family or working environment appears persistently, it has severe impacts on individuals [116]. The researches showed that chronic stress can lead to various mental and physical problems, such as the cardiovascular disease and immune deficiencies [26]. In addition, when the stress is quite powerful, for the people who always face emergency situations (such as fireman or astronaut), it may alter their actions and put them in danger. Therefore, it is quite meaningful to assess the stress of an individual and then provide solutions for feedback to regulate this state.
Traditionally, to provide this assessment, people are asked to fill in standardized question-naire (e.g., Perceived Stress Questionquestion-naire [29]). The questionnaire quantifies and rates the levels of stress on some predetermined scale. However, this subjective assessment requires an individual manually interprets behavioural patterns and the related affective states.
Later, the researchers found that the body expressions such as the physiological responses, facial features (facial expressions, eye gaze and eye blinks) and voice could be the channels to analyze the affective state of an individual [108]. Therefore, the characteristics of these
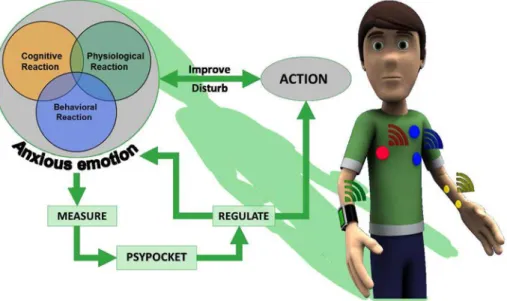
Figure 1.1: Psypocket Project.
body expressions were investigated. The physiological responses were normally analyzed by measuring the characteristics of the physiological signals of an individual such as Electrocar-diography (ECG), Electromyography (EMG) and Electrodermal activity (EDA) under differ-ent affective states [102]. The facial features were normally investigated by measuring the features such as facial expressions, eye movements and pupil dilation from the facial images or videos recorded by the sensors like cameras [37]. The voice was analyzed by measuring the vocal characteristics such as loudness and fundamental frequency from the speech [111]. Meanwhile, the potentials of adopting body expressions for stress recognition were discussed and some detection strategies have been proposed [129]. However, it has been found that the use of body expressions like the physiological signals to recognize the stress state of an indi-vidual is neither an easy nor a direct task. There are no golden rules that have been found and validated.
In our laboratory, attention has been paid to the study of stress recognition. The researchers proposed the Psypocket project which is aimed at making a portable system able to analyze ac-curately the stress state of an individual based on physiological, psychological and behavioural modifications. It should then offer solutions for feedback to regulate this state. The system adopts the data from heterogeneous sources, such as physiological signal, cognitive reaction and behavioural reaction, for stress recognition (see Figure1.1).
The research of this thesis is an essential part of the Psypocket project. We discuss the feasibility and the interest of stress recognition from heterogeneous data and propose an ap-proach to achieve the processing of recognition. In this thesis, not only physiological signals, such as ECG, EMG and EDA, but also reaction time (RT) are adopted to recognize different
13
stress states of an individual. The physiological responses were found to be effective to assess the stress of the subject [53, 83]. However, although some studies have shown a relationship between stress and RT [19, 31], little attention has been paid to use reaction time for stress recognition. The recording reaction time is noninvasive since the subject does not need to be in physical contact with the adhesive electrodes. Besides, in some cases, we monitor the stress of an individual when he is performing a keyboard typing task. Therefore, it is quite mean-ingful to adopt the reaction time to recognize the stress state of an individual. Thus, we adopt reaction time as another input signal of our recognition system and discuss its feasibility of stress recognition. Meanwhile, we also discuss the feasibility of stress recognition by merging the physiological signals and RT and evaluate the performance of the proposed recognition strategy.
Besides, we discuss the feasibility of embedded system which would realize the complete data processing. The embedded system adopts three physiological recordings (ECG, EMG and EDA) and the RT as the input signals. The informative features are extracted from the input signals and the Support Vector Machine is trained with these features to classify differ-ent stress levels. All the processing for stress recognition is performed on-board the system. For the existing commercial stress monitoring systems like StressEraserTM (Helicor) [3] and ThoughtStreamTMsystem (Mindplace) [4], the measure of the stress only depends on the anal-ysis of one type of physiological responses. The study of this thesis can contribute to make a portable system to recognize the stress of an individual in real time by adopting heterogeneous data like physiological signals and RT. Such system can be expected to provide a more reliable recognition of the stress states of an individual.
The following chapters are organized as follows: in the second chapter, we firstly introduce the conception of the stress and indicate the importance of its assessment for an individual. The stressors in the real life and the prototypes to arouse the stress of the subjects in the laboratory settings are presented as well. Then, a variety of modalities of the body expressions, such as physiological responses, facial expressions and voice, are described and their potentials for stress recognition presented in the literature are investigated. The methodologies of automated recognition of stress given body expressions proposed in the literature and the existed stress recognition systems are discussed as well. In the end, we emphasized that it is meaningful to discuss the feasibility of stress recognition given reaction time.
In the third chapter, we present two designs of the experiment to acquire the physiological signals and RT related to the stress. The first design adopts a sound of huge noise (high dB) to elicit the stress of the subjects. The second design adopts respectively a visual stressor (Stroop test) and an auditory stressor (acoustic induction) to elicit it. For each design of the experiment, we describe the experimental protocol, the preprocessing of the physiological
signals and the statistical analysis of the recorded physiological signals and RT. The statistical analysis is applied to find out if a statistical significant difference of the subject’s physiological signals and RT exists when the subject is under different stress levels.
In the fourth chapter, we present our methodology of stress recognition given physiolog-ical signals and RT. The recognition is achieved by using the Support Vector Machines. Be-sides, the approach of decision fusion for stress recognition is also described. The proposed approaches of recognition have been tested on a published stress data set and on the physiolog-ical signals and RT acquired during our designed experiments. The recognition performance is discussed and evaluated in the end of this chapter.
In the fifth chapter, we discuss the feasibility of an embedded system which would realize the complete signal processing of the stress recognition. Two approaches of implementation, Android OS based mobile device and FPGA are analyzed. The FPGA is found to be more suit-able to realize the complete recognition processing. Besides, we present the implementation of the ECG based HR computation in FPGA, which is an important block of our processing of stress recognition.
Chapter 2
Background
In this chapter, we provide a description of the stress of an individual and present the modal-ities and methodologies to recognize the stress. In the first section, we introduce the concept of the stress and indicate the importance of the assessment of the stress of an individual. In the second section, the stressors in the real life and the prototypes to arouse the stress of the subjects in the laboratory settings are presented. In the third section, a variety of modalities of the body expressions, such as physiological responses, facial expressions, voice and reaction time, are introduced and their potentials for stress recognition presented in the literature are investigated.
Then, in the fourth section, the existed methodologies of automated recognition of stress given physiological signals as well as other modalities such as facial features and voice in the literature are discussed. In the fifth section, we review the prototyping of an embedded system for stress recognition and the stress monitoring systems in the commercial market.
Finally, in the sixth section, we propose our choice of the modalities for stress recognition and the studies that are performed in this thesis.
2.1
Stress
Historically, stress has been defined as a reaction from a calm state to an excited state for the purpose of preserving the integrity of the organism [53]. In the psychobiological aspect, stress is regarded as a complex reaction pattern that often has psychological, cognitive and behavioural components [85]. For a human, the Central Nervous System (CNS) controls the reactions of the body and the Peripheral Nervous System (PNS) carries information between the body and the CNS (see Figure2.1) [105]. The PNS can be divided by Somatic nervous sys-tem and Automatic nervous syssys-tem (ANS) . The Somatic nervous syssys-tem controls the skeletal muscles to deal with the voluntary activities such as the body movement and the ANS controls
Figure 2.1: Central nervous system and peripheral nervous system [2].
unconscious actions. The ANS of human beings is consisted of the sympathetic nervous sys-tem (SNS), parasympathetic nervous syssys-tem and enteric divisions [129]. The ANS controls smooth muscles, cardiac muscles and the sweat glands and these ANS related organs will be activated when people deal with the stress and emotional arousal (see Figure2.2). When the stress is perceived by our brain, the SNS stimulates the hypothalamus and the stress hormones are secreted to decrease digestion, increase the heart rate and the metabolic rate, and dilate blood vessel in the heart and muscles which help people to prepare for the stress [7]. Our body will release large amounts of energy during this physical response to stress. When the brain perceives that the stress is over, the parasympathetic nervous system works to return the hormones to the baseline levels so that our body can go back to the resting condition.
In [115], Selye proposed two concepts of the stress: “eustres” which is the positive stress and “distress” which is the negative stress. If the stress can bring in positive changes and does not need the subjects to deal with complicated problem or adapt themselves to the new situation, this stress can be regarded as “eustres”. Eustress is normally beneficial to the sub-jects and can help them achieve their goals. On the other hand, if the stress is harmful to the subjects and can bring in negative consequences such as mental and physical problems, this stress is regarded as “distress”. Normally, when we mention the “stress”, in general terms, it is the “distress”.
2.2 Stressors 17
Figure 2.2: Automatic nervous system [1].
Besides, in [9], the stress is distinguished with three categories: acute stress, episodic stress and chronic stress. This discrimination is based on the time of exposure to stressors. Acute stress is the innate response of an individual when he or she is short lasting exposure to stressors. Normally, this stress do not bring in negative consequences. Episodic stress is normally discovered when an individual experiences a very stressful life [17]. This stress appears when stressful situations occur frequently but cease from time to time. Chronic stress is the stress which appears persistently. This stress is discovered when an individual faces stressors derived from family or working environment [30]. Normally, for an individual, the chronic stress is considered as quite harmful.
It has been found that when the stress is quite powerful, it has severe impacts on indi-viduals [116]. Continuous stress can lead to various mental and physical problems [26]. In 2007, the research indicated that the stress was the second most common work-related health problem in the European Union [41]. In addition, for the people who always face emergency situations (e.g., fireman), stress may alter their actions and put them in danger. Therefore, it is meaningful to provide the assessment of the stress of an individual.
2.2
Stressors
The stressors act as the stimulus to elicit a complex physiological, psychological and be-havioural responses of an individual. These responses can lead to various changes in emotion, cognition and behaviour. For the moment, the categorization of the stressors is still a question to the researchers. A major problem is to figure out whether the brain deals with stressors
categorically. That is to say, we would like to know whether the brain categorizes stressors and give back the specific responses according to the category. However, there are no gen-erally accepted rules which have been found. Normally, categorization proponents gengen-erally suggest that depending on the discrimination of our brain, there are two kinds of stressors [34]. The first kind are the ones which lead to the actual disturbances of physiological sta-tus, such as haemorrhage, immune challenge or infection. These stressors are normally called the physical or systemic stressors. The second kind are the ones which affect the current or anticipated state of an individual, such as social conflict, noise and unsatisfied environment stimulus. These stressors are normally called psychological or emotional stressors.
Since chronic stress can lead to various mental and physical problems, a variety of chronic stressors have been paid attentions. In [58], the surgical stress during general anaesthesia was studied. The researchers found that the surgical nociceptive stimuli was a stressor which could bring in the stress responses during the surgery. They are unconscious response to the injury and trauma, which could lead to autonomic and metabolic changes in heart rate variability and blood circulation.
In [54], the researchers studied nine call center employees for a week and analyzed their stress state at work. The stressful work settings was declared as a stressor which could lead to the chronic stress. This stressor could bring in a negative effect to the employees so that they could not provide a better experience for customers. The researchers said that to manage this chronic stress, it was quite important to recognize precisely when and where the stress appears. This could lead to more timely and reduced-cost interventions and more pleasant environments, so that the employees could better manage their workload in such stressful work settings.
In [9], the researcher declared that even in the normal working environment, the stress also appears which can lead to many health problems and huge economic losses in companies. In this case, the stressors are not only continuous high mental workloads but also the non-stop technological development. These stressors bring in constant changes so that the subjects need for adaptation and their stress are aroused. The researchers said that it is necessary to detect the stress of work in its early stages. In this way, we may manage the stress before it becomes chronic and can further prevent personal and economic damages.
In the real life, an increase in driver workload is another important stressor [53, 108]. Ensuring a safe driving experience is an important concern of the drivers. Real-life car driving requires that a driver should focus all the attentions on road events at all times and make fast and accurate decisions to deal with these events. However, the investigations have shown that an increase in driver workload can arouse the stress of the drivers, which lead to the decrease of the decision making capabilities and the situational awareness [16, 123]. In this way, the
2.3 Modalities for stress recognition 19
driving ability is highly degraded and any form of distraction can cause the fatalities, for example, the car crash [106]. The researchers claimed that most of the accidents of car driving could be avoided if the stress of the drivers could be accurately detected and be appropriately moderated in its early stages.
Besides, in [19], Bolmont et al. designed a chamber which provided a gradual decompres-sion from sea level to 8848 m equivalent altitude. The climbers participated in the simulated climbing experiments in the decompression chamber. They found that the climbers’ stress states may change when they are exposed to high altitude. This research showed that the stress may be aroused by the extreme environment as well.
On the other hand, some stressors have been used to arouse the stress of the subjects in the laboratory settings. The researchers would like to propose the appropriate approaches which is able to recognize the stress levels of the subjects in an unobtrusive way. Normally, the first task of their researches is the design of the prototypes which elicit different stress states of the participating subjects at the pre-determined period in the laboratory settings. By processing the acquired data related to the different levels of stress with their proposed approaches, the researchers could evaluate the detection performance in terms of stress recognition.
In [89], Noteboom et al. studied the effect of anxiety and stressor intensity on arousal and motor performance. In their experiments, the participants received electric shocks to elicit their stress. In [105], P. Rani et al. discussed the stress detection in real time by monitoring the heart rate variability of an individual. In their study, they chose playing video games to generate mental stress. Similarly, in [86], Mohino-Herranz et al. adopted the game “Tetris” to arouse the stress of an individual. In [129], J. Zhai et al. discussed the stress recognition when the user was interacting with the computer. They designed a computer-based “Paced Stroop Test” to elicit the stress. The Stroop test [120] asks the subject to name the font color of the word when the color and the meaning of the words differ (e.g., the word “yellow” printed in green ink instead of yellow ink). This test was also used by many other authors like Hainaut and Bolmont [50] as an effective physiological stressor.
2.3
Modalities for stress recognition
Traditionally, to assess the individual stress state, people are asked to fill in standardized ques-tionnaires (e.g., Perceived Stress Questionnaire [29]). By analyzing the questionnaire, the stress levels are rated on some scale, so that the stress levels of an individual is quantified. However, this subjective assessment strategy requires human intervention, for example man-ually interpreting behavioural patterns and the related affective states. Thus, it cannot enable real-time measures of the individual stress state.
Figure 2.3: An example of the PPG.
Fortunately, the researchers have found that the body expresses the affective state through many channels [108]. Therefore, the body expressions have been studied to find out the reli-able source for understanding the affective state. The body expressions such as facial expres-sions, voice and physiological responses are the widely investigated body expressions for the measures of the affective state, for example the stress [84]. In the following paragraphs, we will introduce these body expressions respectively and present their characteristics.
2.3.1
Physiological signals
2.3.1.1 Blood volume pulse (BVP)
Blood volume is the amount of blood in a blood tissue during a certain time interval, which is an indicator of the flow of blood through the human body. After each heart beat, the blood flows through the blood vessels and leads to their engorgement, which modifies the amount of light that is reflected by the skin’s surface. BVP measures these changes in light reflec-tions. This measurement is achieved by using a back-scatter Photoplethysmography (PPG). The Figure2.3illustrates an example of the PPG.
The PPG emits infra-red or red light on the skin and measures the amount of light that is reflected by its surface. This amount of light can provide the information of the amount of blood present in the region of the measurement. The BVP sensor is placed on the surface of the skin and normally does not need adhesives or gels. It can be placed anywhere on the subject’s body where the skin capillaries are closed to the skin’s surface. However, in the practical application, the PPG is most of the time recorded from the skin capillary of a finger. By analyzing the changes in light reflections recorded by the PPG, we can measure the heart
2.3 Modalities for stress recognition 21
Figure 2.4: A normal electrocardiogram [108].
rate. However, this measurement is subject to many artifacts caused by the placement and motion. Thus, the measurement of the heart rate with the BVP is less precise to evaluate the heart rate variability than the measure with the Electrocardiogram presented in2.3.1.2.
The researchers have found the correlation between the BVP and the stress, where the BVP decreases when the stress of a subject increases. The BVP then increases when the subject is back to the calm state [107]. This is because when the subject is under stress state, his heart rate increases as the heart rate accelerates to send more blood to the muscles. The blood is diverted to the muscles and prepare them for imminent action, such as fight or escape. This means that the blood flow is reduced at the ends and therefore at the fingers. Due to the fact that decrease in BVP is correlated with the increases in stress, the BVP has been used to measure the stress state of an individual [129].
2.3.1.2 Electrocardiogram (ECG)
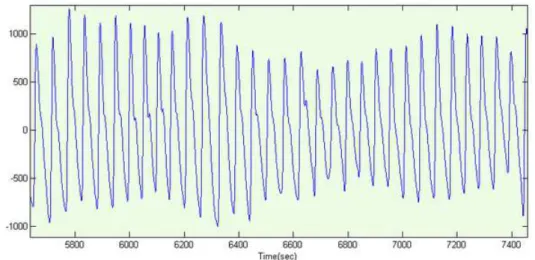
The ECG records the cardiac electrical voltages on the surface of the skin by placing the metal electrodes on the body. To ensure the good quality of the ECG records, normally, the skin should be firstly cleaned by using the alcohol and then the electrodes of the ECG sensor are attached to the skin. The Figure2.4illustrates an example of the ECG signal.
In the normal case, the ECG is periodic (shown in the Figure2.4). The time interval be-tween two heart beats is called inter-beat interval (IBI). The IBI can be calculated by observing the time interval between two consecutive R peaks by detecting the QRS complex, which is used to measure the heart rate and determine the heart rate variability (HRV) [108]. Compared with the BVP, the ECG signal can provide a more precise determination of the heart rate by the detection of the sharp R peaks.
The heart rate (HR) is computed with the Formula2.1where the standard unit of heart beat is beats per minute (bpm). For example, if one heart beat requires 1s (i.e. IBI=1s) then in one minute there are 60 beats, so that we say HR=60bpm is the heart rate against the time.
HR(bpm) = 1
IBI(s)× 60 (2.1)
When a person is under stress, the time between each heart-beat is irregular so that heart rate variability (HRV) provides an important tool to measure this irregularity for stress recog-nition and medical diagnose [113]. When we analyze the frequency spectrum of the HRV, its frequency can be divided into three bands [108]:
• very low frequency (VLF), f < 0.04 Hz
• low frequency(LF), 0.04 Hz < f < 0.15 Hz
• high frequency(HF), f > 0.15 Hz
VLF is indicated as an unreliable measure in short-time recordings (≤ 5 min). However the low frequency band reflects the sympathetic nervous system activity and the high frequency band is associated with the parasympathetic nervous system activity. That is to say, the energy ratio of two frequency bands can be regarded as an indicator for autonomic balance. This energy ratio (Energy RatioECG) can be expressed by the Formula2.2.
Energy RatioECG=
total energy in LF
total energy in HF (2.2)
High Energy RatioECG indicates the dominance of sympathetic activity, i.e. the person is
under mental stress, while low Energy RatioECG indicates the dominance of parasympathetic
activity, i.e. the person returns to the calm state.
2.3.1.3 Respiration
The respiratory rhythm is defined by the regular alternation of inspiratory and exhalation movements, where the volume of the rib cage increases with each penetration of the air (i.e. inspiration) and decreases with each rejection (i.e. expiration).
At each normal breath, 0.5 liters of air enter the lungs. The volume of air during forced inspiration is 2.5 to 3 liters. If the forced expiration is carried out at the end of the normal expiration, the person can still expire 1 liter of air. At the end of forced expiration, there is still 1.5 liters of air in the lungs, so that they can never be emptied completely. The Figure2.5
illustrates an example of the respiration signal. As can be seen, the breath cycle superimposes on the baseline stretch.
2.3 Modalities for stress recognition 23
Figure 2.5: An example of the respiration signal [53].
Normally, when the person is under the state of rest and relaxation, a slower and more superficial breathing is carried out. On the other hand, deeper breaths are usually generated by affective excitement and physical activity. Emotions with negative valency usually cause irregular breathing. A state of stress may therefore be detectable by frequent breathing, how-ever, punctual stressors may cause a momentary stoppage of breathing [43]. Thus, to estimate the levels of stress, the rate and volume of respiration can be used [53]. However, to monitor the respiration, the subjects are normally required to wear a belt around their chest. In the real applications, it may restrict the subjects from carrying out their regular activities. What is more, in [53], the researchers found that compared with other physiological signals, such as the ECG signal and galvanic skin response, the performance of the determination of a driver’s relative stress level during real world driving tasks by adopting the rate and volume of respi-ration was less efficient.
2.3.1.4 Electromyography (EMG)
EMG refers to the muscle activity or electrical tension of a certain muscle. Muscle tissue conducts electrical potentials and the absolute level of the muscle tension depends on the muscle where it is measured. Surface EMG is a method of recording the information present in these muscle action potentials. The Figure2.6illustrates an example of the EMG signal.
It has been shown that muscle activity increases during stress and negative-valent emotions [24]. In terms of stress detection, the EMG signal was adopted to determine a driver’s relative stress level during real world driving tasks in conjunction with other physiological measures [53]. In this study, the electrodes of the EMG sensor have been located in the shoulder of the subject, which measured the electrical tension of the trapezius muscle. Meanwhile, the
Figure 2.6: An example of EMG signal [53].
researchers have found that other physiological signals, such as the ECG signal and galvanic skin response, have a better recognition performance compared with the EMG signal.
2.3.1.5 Skin temperature
The peripheral temperature, as measured on the surface of the skin, varies according to the blood supply to the skin. In the real application, the skin temperature can be measured by placing the sensor on the left thumb [129].
Normally, the variations in the temperature of the skin are related to the vasodilation of the peripheral blood vessels. This vasodilation is induced by an increase in the activity of the sympathetic system. This variation depends on the condition of the subject. If the person is afraid, the blood will be directed to the muscles that control the movement of the body, for example the leg muscle, so that the subject can prepare the escape. This body reaction causes low temperatures at the extremities of the body due to the vasoconstriction.
The researchers have found that for an individual, the skin temperature is negatively cor-related with stress [107]. If the subject is under stress state, the temperature of the extremities of his body decreases. This is because the blood is directed primarily to the vital organs, such as the heart, liver, lungs and stomach, for protection. His fingers then tend to be colder. Later, if the subject is relaxed, the temperature of the fingers increases.
2.3 Modalities for stress recognition 25
Table 2.1: Waves bands, frequency range and individual characteristic in the EEG [116].
2.3.1.6 Electroencephalography (EEG)
It has been known that the neural activity of the brain produces electrical signals. EEG mea-sures the electrical activity of the brain by recording complex electrical waveforms at the scalp formed by action electrical potentials [36]. This measurement is achieved by placing the electrodes on the surface of the head and a full EEG incorporates over 128 electrodes.
The EEG signal is characterised by different frequency components and each component corresponds to some states of an individual. In [116], the authors summarized the indices, waves bands, frequency range and individual characteristic in the EEG (see Table2.1). There are four waves bands which are respectively Beta, Alpha, Theta and Delta waves. When the person is under conscious states, Beta and Alpha are dominant. When the person is under unconscious states, Theta and Delta waves are dominant [55].
The investigations have shown the correlation between the brain activity and the mental stress. Rapid Beta wave frequencies are found to be the main characteristics which indicates that the person is under stress state [90]. In [36], the EEG signal has been used to recognize the levels of stress of the computer game players. By appling the decision tree model, different levels of stress was recognized with the use of the EEG signal. What is more, in [77], the authors have found that the EEG signal showed differences in relaxation levels. However, the differences were not found in blood pressure and heart rate. Since the relaxation is opposite of stress, the authors claimed that the EEG signal may contain more information about levels of stress than blood pressure and heart rate.
On the other hand, in the ambulatory environment, the interpretation of the EEG signal is difficult. The normal body activity such as head movement, the opening and closing of the eyes can usually affect the interpretation of the EEG signal. This disadvantage leads to the fact that few attentions have been paid to adopt the EEG signal for stress recognition in the ambulatory environment.
2.3.1.7 Electrodermal activity (EDA)
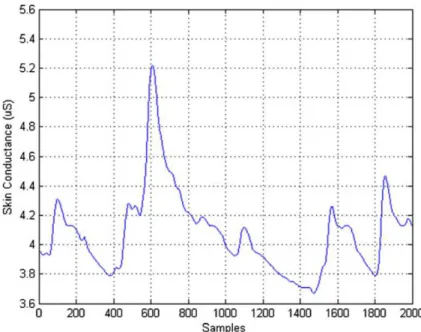
EDA is also known as skin conductance (SKC) or galvanic skin response (GSR). EDA mea-sures the conductivity of the skin, which increases if the skin is sweaty. This activity is one of the physiological indices which is most frequently used in a large number of applications, such as psychology, psychophysiology and cognitive neuroscience. This electrical activity of the skin varies very significantly in the situations where the subject is involved in different affective states [66]. The Figure2.7illustrates an example of the EDA signal.
This signal was found to be a good and sensitive indicator of stress. When a person is more stressed, his skin conductance increases proportionally. This improvement of the conductivity of the skin is due to the the existence of electrical currents associated with sweating. This sweating results from the secretion of sweat glands, which have the particularity of responding to the affective arousal. These glands are located in the palms of the hands and the soles of the feet [118].
The EDA can be typically characterized by two components: a tonic baseline level and short-term phasic responses superimposed on the tonic baseline level [88]. The tonic baseline is an indicator of the general activation of the organism. It may present slow drifts and transient variations, consecutive or not to stimulation or action of the participant (movements, strong respiration). The short-term phasic responses is a transient change, occurring one to three seconds after the onset of an identified cause. The amplitude of the responses reflects the importance of the phasic response to stimulation of an affective state. Any transient variation occurring outside this latency window is considered a spontaneous fluctuation. The EDA can have a stable individual stroke value. This value can be characterized by a high frequency of the spontaneous fluctuation, which is often associated with a lack of habituation of the short-term phasic responses in case of repeated stimulations.
2.3.1.8 Summary of physiological signals
The activation of these different physiological indicators varies according to the levels of stress and the subjects, which induces a pattern of complex body responses making it possible to dis-tinguish the different levels of stress. The question is whether these variations in physiological parameters are or are not specific to a given stress state. There are no golden rules that have been validated, which remains the issue that should be debated.
2.3.2
Facial features
Intuitively, we can observe that when an individual is under different affective states, his facial features may differ. For example, when an individual is quite disappointed, he or she may
2.3 Modalities for stress recognition 27
Figure 2.7: An example of EDA signal.
reveal this affective state by the facial features. Thus, we have a great chance to observe the reduced frequency of the movements of facial muscle from this individual. Meanwhile, different frequencies of head movement and eye movement compare with the normal state may be observed as well. Normally, once these facial features are observed, as a feedback, the persons surrounding him will give the related reactions, such as asking what has happened and encouraging this individual.
In the literature, the facial features such as facial expressions, eye gaze, eye blinks and pupil dilation are widely investigated. The researchers pay attentions to figure out the charac-teristics of these facial features when an individual is under stress state.
2.3.2.1 Facial expressions
The human brain is capable to recognize the affective state of the subjects from their facial expressions. However, the inner modality of this recognition remains to be investigated [116]. To analyze the facial expressions, normally, the researchers focus on some points on the face, eyes and mouth. By analyzing the coordinates of these points, the researchers can get the facial informations, for example, the levels of mouth openness (see Figure2.8). Sometimes, the head movements, such as yaw and roll, are also taken into consideration. The facial expressions have been used to predict unsafe driving behaviors in [60]. The study showed that for a driver assistance system, it is quite meaningful to track the driver facial features, for example, the facial expressions of the drivers. By tracking facial expressions associated with driving
Figure 2.8: An example of vision tracking points on subject’s face used in [60].
accidents, the predictive accuracy of driver assistance systems can be significantly improved. In the study of the emotional responses to the stressors [75], the researchers have found that facial expressions of emotion signal biological reactivity, such as cortisol and cardiovascular responses, when the subjects response to the stressors. The analysis showed that if the subjects had fear of the stressor, the fear facial expressions appeared. If the subjects had more fear of the stressor, their cardiovascular and cortisol responses to stress augmented. Besides, if the subjects showed indignation to the same stressor, the facial expressions of indignation appeared. If the subjects were more indignant to this stressor, their cardiovascular and cortisol responses decreased.
In [37], the researchers detected the changes of facial expressions when people experi-enced both low stress and high stress performance demands. Their study showed that the stress of the subject could be revealed by the facial expressions and related stress recognition strategy was also investigated. In [76], the facial expressions such as facial muscle movement and head movements were used to infer the stress levels of the subject. The researchers found that the increase of head and mouth movements was correlated with a higher stress level. The stress levels recognized by the system were compared with that predicted by psychological theories and the consistence between them was confirmed.
2.3.2.2 Eye movements
We know that eyes are the mean that provides informations to the subjects. In the social interaction, we prefer to infer the emotion and mood of the subjects by looking at their eyes
2.3 Modalities for stress recognition 29
and observing their eyes movements like eye gaze and eye blinks.
Eye gaze can provide the information about the concentration of the subject. Normally, if the subject is focusing on something that he is interested in, a long time eye gaze can be ob-served. That is to say, the eye gaze enables us to infer the affective state of the subject. In [76], the eye gaze was adopted as one of the eye movements to infer the stress levels of the subject. In this study, the participants were asked to use their eyes to focus on a particular object on a computer screen for a long period of time. During this period, gaze spatial distribution and percentage of saccadic eye movements were monitored. The researchers found that frequent focus on the object was correlated with the stress of the subject.
Eye blinks are another important eye movement and its performance when the subject is under stress state has been investigated [49, 76]. In [76], the participating subjects were required to solve mathematical tasks which were shown on the computer while the eye blinks were monitored during the experiment. The researchers have observed that when the subject was under higher stress state, his speed of eye closure was faster. In [49], the eye blinks were monitored while the subjects performed the real driving experiments. However, these two studies gave out opposite results in terms of performance of eye blinks when the subject is under stressful conditions. In [76], the researchers have found that when the subject was under higher stress state, the frequency of his eye blinks were lower. In [49], the frequency of the eye blinks was found to be lower when the stress level of the subject was lower, which indicated that the higher stress state was correlated with higher frequency of the eye blinks. We can not make a decision to tell which conclusion is correct. This is because the fact that the two studies did not use the same prototype to elicit the stress of the subject and thus the analyzed data were obtain from different experiments settings. Besides, in [76], the participants should watched the screen of the computer during the task, which may affect the performance of eye blinks.
2.3.2.3 Pupil dilation
In the real life, the variation of the pupil size can be observed when an individual faces dif-ferent events or under difdif-ferent emotions. In [97], the variation of the pupil size during and after auditory emotional stimulation was studied. The researchers designed an experiment where the subjects listened negative, positive highly arousing and emotionally neutral sounds. During the experiment, the pupil responses of the subjects were monitored. The results of the experiments showed that when the participating subject experienced both emotionally nega-tive and posinega-tive stimuli, their pupil size significantly augmented. Besides, further analysis indicated that the pupil responses of the female subjects were significantly larger than males during the auditory stimulation. Thus, the researchers claimed that it is possible to use the
variation of the pupil size as the input signal for affective computing.
In [100], the researchers tested the hypothesis that the pupil dilation during performance is partially due to a task related anxiety component. For this purpose, the researchers designed an experiment where the subjects processed digit strings of various lengths for immediate recall. During the experiment, the pupil responses of the subjects were measured. By analyzing the pupillary patterns, the researchers found that if the subject was under stressful condition, the diameter of his pupil augmented and the frequency of pupil dilation was higher.
In [129], the pupil dilation was adopted to recognize the stress of an individual. A computer-based “Paced Stroop Test” was designed to elicit emotional stress. During the experiment, the raw pupil diameter signal was recorded by an eye gaze tracking system at rate of 60 sam-ples/sec. A technique of interpolation was applied to fill the artifact gaps due to blinking. The mean value was adopted as the characteristic feature of the pupil diameter. The results of the experiments showed that when the subject was under stressful condition, the mean value of his pupil diameter increased.
2.3.3
Voice
The voice of the subject carries a lot of informations, which can be characterized by two main parts [91]. The first part is the linguistic information where the utterances are made according to the rules of pronunciation of the language. The second part is the non-linguistic information, which is also called paralinguistic information. The non-linguistic information includes intonation, voice quality, prosody, rhythm and pausing of the speech [111]. Similar to the other non-verbal modalities like facial expressions, eye gaze, eye blinks and pupil dilation, these non-verbal contents of the speech can always reveal the messages of the subject, for example, his affective states. However, how to interpret and characterize exactly the affective states of the subject from these non-verbal contents of the voice is still a question to be solved. The researchers have made effort to measure the emotional states of the subject in voice. In [11], the use of prosody to recognize the frustration and annoyance in natural human-computer dialog was investigated. The researchers found that frustration was detected by longer speech durations, slower speech and pitch rates. The accuracy of prediction increased when discriminating only frustration from other utterances. Results showed that a prosodic model could predict the frustration and annoyance from an utterance. A system based on this idea was developed for flight telephone booking.
In [114], the researchers recorded and analyzed the speech data which contained different levels of stress. They used an air controller simulation to induce the stress of the subjects. The speech data were processed with a recurrent neural network. After the training process, the neural network was used to estimate the amount of stress at a frequency of 25 Hz. The results
2.3 Modalities for stress recognition 31
of estimation were better than accuracy achieved by human assessment.
In [91], a system for classification of emotional state from the utterances of speech was proposed. Six categories of emotions, which were Anger, Disgust, Fear, Joy, Sadness and Surprise, were involved for classification. The system adopted short time log frequency power coefficients (LFPC) to represent the features of the speech signals, where short time LFPC represents the energy distribution of the signal in different Log frequency bands. Besides, short time LFPC also provides information on the fundamental frequency of speech. A discrete hidden Markov model (HMM) was used for classification.
The results of the experiments showed that the proposed system could achieve an average accuracy of 77.1% and best accuracy was 89% in the classification of six emotions. The results outperformed the accuracy achieved by human assessment which was only 65.8%. This good classification performance revealed that short time LFPC was an efficient indicator for the classification of the emotions.
Voice stress analysis was originated from the concept that when a person is under stress, especially if a person is exposed to a dangerous environment, his heart rate increases as the heart rate accelerates to send more blood to the muscles. The blood is diverted to the muscles and prepare them for fight or escape. This increases the vibrations of the muscle, which is called micro-muscle tremors (MMT). The muscles that make up the vocal tract can transmit the vibrations through the speech [56].
As for the recognition of the stress state of the subject, the researchers also concentrated on the non-verbal content of the voice [52]. The informative features such as fundamental fre-quency, variation of fundamental frefre-quency, jitter (the perturbation in the vibration of the vocal chords) and high frequency energy ratio were extracted from the voice for stress recognition [111].
In [74], the speech was adopted by the researchers to recognize the stress of the subject. A Bayesian Network was used as the classifier for stress recognition. In [47], the researchers investigated the correlation between demodulated amplitude and frequency variations of the voice and the heart rate of a fighter aircraft flight controller. They applied the amplitude mod-ulation and frequency modmod-ulation to the speech. They found that the peak frequencies in the spectrum of the amplitude envelope followed fundamental frequency. This following phe-nomenon was regardless of the center frequency of analysis. What is more, when the subject was under higher stress level, the energy of high frequency voice components augmented. The results showed that the fundamental frequency could be used as an indicator to measure the stress of the subject.
In [125], the researchers designed the experiments to investigate when the subject per-formed unknown emotionally stressful task in the real life, the fluctuations in fundamental
frequency of the voice. After relaxing for a short period, the participants went through a nat-ural obstacle by way of sliding down a rope and then exposed to the fall. Before the task, the participants were asked to give a standardised speech sample. During this period, the fundamental frequency of the voice and the heart rate of the participant were recorded. The participants repeated the task after 30 min and after 3 days. The repetitions of the task were aimed at finding out whether the repetitions led to a lower emotional load. The results of the experiments showed that when the subject was under higher stress level, the range and rapid fluctuations in fundamental frequency increased. Meanwhile, the repetitions of the task did not lead to significant changes in fundamental frequency.
In [39], the stress of the drivers was analyzed through their speech. The participants were required to performed mental tasks of variable cognitive load while driving in a car simulator. The subband decompositions and the Teager energy operator were applied to extract the fea-tures from the speech of the drivers under stressed conditions. The dynamics of the feature set within the utterance were found to be correlated with the stress of the participants.
A stress monitoring system based on the analysis of the characteristic changes of the voice has been developed for the army users [56]. The performance of this system was evaluated by the Air Force Research Lab in USA. They reported that such stress monitoring system could efficiently monitor the stress of an individual. Through this non-invasive and less obtrusive measure, the army could provide solutions to reduce the workload of their staffs and improve the performance of work, and thus save lives.
2.3.4
Reaction time
Intuitively, we can observe that personal reaction time (RT) may differ when an individual deals with various situations. Several researches in the literature have discussed the relation between the performance in RT and the stress of an individual.
Bolmont et al. [19] presented that the climbers’ mood states may change when they are exposed to high altitude and their performance in RT differs as well. Eight climbers whose age range was from twenty-four to thirty-seven years old have participated in the simulated climb-ing experiments for thirty-one days in a decompression chamber. This chamber provided a gradual decompression from sea level to 8848 m equivalent altitude. The subjects were asked to fill in Spielberger State-Trait Anxiety Inventory (STAI). The STAI is a self-evaluated ques-tionnaire to evaluate state-anxiety responses. During the experiments, the subjects performed a test of binary visual choice. The test required them to press a button corresponding to the side of the light that was flashed. The median value in hundredths of a second for 31 re-sponses was computed and was used to investigate the relationship between the anxiety and performance changes in reaction time. The statistical calculation of the coefficient
correla-2.3 Modalities for stress recognition 33
tion showed a significant positive correlation between the performance in reaction time and changes in anxiety for the climbers. This results suggested that anxiety could augment the reaction time. Since anxiety is a reaction to the stress, this study indicated that the subject’s reaction time of the relatively simple tasks could be correlated with their stress levels.
Coombes et al. [31] investigated how anxiety alters the balance between attentional control systems to impact performance of a goal-directed motor task. The task required the subjects to pinch a force transducer with the thumb and index finger of their right hand while seated in a chair. A LCD monitor was positioned one meter from the chair. The monitor showed the emotion-eliciting distractor images to the subjects. Thus, the subjects executed targeted force contractions with the appearance of emotional and nonemotional distractors and their maximal voluntary contraction was assessed. For the subjects of high anxiety and low anxiety group, their reaction time, root mean square error and peak rate of change of force were computed and their statistical correlation was analyzed. The results showed a significant correlation between the high anxiety and slower reaction time, which could suggest that high anxiety was associated with attenuated performance efficiency.
The results of these researches show that there exists a significant correlation between the reaction time and the stress state. However, we find that in the literature, little attention has been paid to use reaction time for stress recognition.
2.3.5
Additional modalities
Behavior is also an important body expression. A simple idea to understand the human be-havior is to consider the human as a device. This device contains a variety of internal mental states, which can control particular behaviors [101].
Behavioural recognition relies on the technique of computer vision. Normally, to under-stand and recognize the actions in a visual scene, a series of underunder-standable primitive tasks or events should be created and are included in a list. A complex behavior is then divided into many primitive tasks or events. The behavior of the subject is recognized if all these primitive tasks or events are detected in sequence. In the current studies, the techniques such as hidden Markov models and Bayesian classifiers are commonly used for behavioural recognition. For example, in [48, 78], the hidden Markov models were involved for modeling and prediction of human driver behavior.
In terms of stress recognition, the human behavior is also involved. Behavioral scientists showed that high stress state may lead to negative thinking, disruption of attention and reduc-tion of concentrareduc-tion [76]. In [53], the researchers recorded a list of observable actions and events. The analysis of the drivers’ behaviors recorded on the videos could help the researchers to assess driver stress levels manually and thus created a continuous stress metric. But we can
find that the measure of the stress levels by the human behavior are always performed by the human specialists. The automated interpretation of the stress levels of the subjects by using the human behavior remains to be discovered.
Besides, in [53], the gestures of the drivers were also recorded in the videos. The re-searchers found that the stress stimuli could elicit the specific gestures of the drivers so that the gestures were used to help the researchers to assess driver stress levels manually. This showed that it is possible that the gestures of the subjects and the stress stimuli are correlated. In [76], the user’s interaction activities with the computer was monitored when the user was under different levels of stress. The recorded interaction activities were the number of mouse clicks and mouse pressure from fingers. The results of experiments showed that when the user was under a lower stress level, the mouse pressure from fingers was harder. This showed that the interaction features can be also an indicator for the stress of the subject.
2.3.6
Summary of the modalities
Based on the contents of the previous paragraphs, we can see that the measures of the stress from the facial features are achieved by analyzing the features such as facial expressions, eye movement and pupil dilation from the facial images or videos recorded by the sensors like cameras [37]. The measures from the voice analyze vocal characteristics such as loudness and fundamental frequency from the speech [111]. The measures from the physiological responses analyze the characteristics of the physiological signals of an individual such as Electrocardio-graphy (ECG), ElectromyoElectrocardio-graphy (EMG) and Electrodermal activity (EDA) under different stress states. Besides, the researches [19, 31] show that there exists a significant correlation between the reaction time and the stress state. However, little attention has been paid to use reaction time for stress recognition.
2.4
Literature review of the methodologies for stress
recog-nition
In section 2.3, we have presented a variety of modalities of the body expressions, such as physiological responses, facial expressions and voice, and their potentials for stress recog-nition. However, to achieve the automated measures of the individual stress state, attention should be paid to figure out the related strategy as well. Thus, in this section, we review the methodologies of the automated recognition of stress that have been presented in the literature.
![Figure 2.1: Central nervous system and peripheral nervous system [2].](https://thumb-eu.123doks.com/thumbv2/123doknet/14529676.723367/21.892.242.635.180.495/figure-central-nervous-peripheral-nervous.webp)
![Figure 2.2: Automatic nervous system [1].](https://thumb-eu.123doks.com/thumbv2/123doknet/14529676.723367/22.892.196.696.162.459/figure-automatic-nervous-system.webp)
![Figure 2.4: A normal electrocardiogram [108].](https://thumb-eu.123doks.com/thumbv2/123doknet/14529676.723367/26.892.241.665.167.415/figure-a-normal-electrocardiogram.webp)
![Figure 2.5: An example of the respiration signal [53].](https://thumb-eu.123doks.com/thumbv2/123doknet/14529676.723367/28.892.263.635.164.427/figure-example-respiration-signal.webp)
![Figure 2.6: An example of EMG signal [53].](https://thumb-eu.123doks.com/thumbv2/123doknet/14529676.723367/29.892.214.681.164.534/figure-an-example-of-emg-signal.webp)
![Table 2.1: Waves bands, frequency range and individual characteristic in the EEG [116].](https://thumb-eu.123doks.com/thumbv2/123doknet/14529676.723367/30.892.168.724.159.338/table-waves-bands-frequency-range-individual-characteristic-eeg.webp)