HAL Id: insu-02886288
https://hal-insu.archives-ouvertes.fr/insu-02886288
Submitted on 1 Jul 2020
HAL is a multi-disciplinary open access
archive for the deposit and dissemination of
sci-entific research documents, whether they are
pub-lished or not. The documents may come from
teaching and research institutions in France or
abroad, or from public or private research centers.
L’archive ouverte pluridisciplinaire HAL, est
destinée au dépôt et à la diffusion de documents
scientifiques de niveau recherche, publiés ou non,
émanant des établissements d’enseignement et de
recherche français ou étrangers, des laboratoires
publics ou privés.
Correlated observations of the boundary between polar
cap and nightside auroral zone by HF radars and the
DMSP satellite
Catherine Senior, Dominique Delcourt, Jean-Claude Ceriser, C. Hanuise,
Jean- Pierre Villain, R. Greenwald, P. T. Newell, F. J. Rich
To cite this version:
Catherine Senior, Dominique Delcourt, Jean-Claude Ceriser, C. Hanuise, Jean- Pierre Villain, et al..
Correlated observations of the boundary between polar cap and nightside auroral zone by HF radars
and the DMSP satellite. Geophysical Research Letters, American Geophysical Union, 1994, 21 (3),
pp.221-224. �10.1029/93GL02425�. �insu-02886288�
Correlated
observations
of the boundary
between
polar
cap and
nightside
auroral zone by I-IF radars and the DMSP satellite
C, Senior
•, D. Delcourt
•, J.-C. Cerisier
•, C. Hanuise
2, J.-P. Villain
s, R. G.
Greenwald
4, P. T. Newell
4, and F. J. Rich
s
Abstract. Simultaneous observations from HF radars and
the DMSP satellite have been used to relate the ionospheric convection pattern and the nighBide precipitation at the polar cap-auroral zone boundary. The convection is eastward in the
poleward part of the radars field of view and predominantly
westward at lower latitudes. The DMSP-F9 particle spectrograms exhibit energetic precipitating protons at the poleward edge of an "inverted V". The downward H + flow displays spatial filtering effects with a clear energy-latitude dispersion. Single-particle trajectory simulations in appropriate field models demonstrate that these ions were ejected from the neutral sheet near 120 R E geocentric distance. Most notably, the simulations reveal significant azimuthal dispersion during transport, and the source region in the magnetotail is found to
extend over several Earth radii in the dawn-dusk direction,
less energetic particles originating duskward of the high- energy ones. The longitudinal spread of the tail source suggests particle precipitation in the ionosphere over at least one hour magnetic local time. Also, as the downflowing protons travel near the lobeward edge of the plasma sheet, the observations suggest that the convection reversal lies inside the boundary layer plasma sheet (PSBL).
Introduction
Mapping the various regions of the Earth's magnetosphere into the ionosphere forms an important issue when monitoring overall magnetospheric dynamics or investigating coupling processes along the field lines. Such a mapping can be performed either by implementing realistic models of the geomagnetic field or by analyzing the plasma characteristics at low altitudes provided that the magnetospheric source has unambiguous properties [Newell and Meng, 1992]. Analyzing nigthside measurements from the Aureol-3 satellite, Zelenyi et al. [1990] reported velocity dispersed ion structures (VDIS).
More recently, Saito et al. [!992] displayed concurrent
observations from the Akebono satellite. These features are
generally interpreted as downstream consequences of non- adiabatic particle dynamics in the distant tail. The purpose of
1CRPE/CNRS,
Saint-Maur-des-Fossts,
France.
2LSEET, Universit6 de Totdon et du Var, France.
3LPCE,
Orltans
La Source,
France.
4APL,
The
Iohns
Hopkins
University,
Laurel,
MD, USA.
5Physics
Laboratory/GMG,
Bedford,
MA, USA.
Copyright
1994
by the American
Geophysical
Union.
Paper number 93GL02425 0094-8534/94/93 GL-02425503.00
this report is to examine the morphology of particle precipitation, including a VDIS, observed during a specific nightside orbit of the DMSP-F9 satellite. This orbit, which took place on December 6, !989, occurred over the common field of view of the Schefferville and Goose Bay HF radars. It thus allows a detailed comparison with the ambient convection pattern. In addition, the 3-D particle code of Delcotat et al. [1992] is used, together with the radar-measured plasma velocities, to trace the observed VDIS precipitation back to the magnetospheric equatorial plane. This gives some insight into the source region of this structure.
Experimental Results
The HF radars [Greenwald et al., 1985] are located in Goose Bay, Labrador (JHU/APL radar) and Schefferville, Qutbec (French radar). These radars feature a common field of view between 65 ø and 80 ø geomagnetic latitude. The radar beams are scanned in azimuth with a cycle time of 96 sec, and a radial space resolution of 45 km. From the two radar velocity data, it is possible to reconstruct vector velocities in the common field of view [Hanuise et al., 1993]. These vector velocity maps are further corrected by assuming that the flow is everywhere divergence free [Ruohoniemi et al., 1989].
Corrected velocities obtained between 0258 and 0301 UT on December 6 !989 in the nightside sector are presented in Figure 1. A convection boundary is observed, separating a region at high latitudes with eastward flow from a low-latitude one with plasma convection predominantly toward the west. Similar vector velocity maps were obtained somewhat before and after 0258-0301 UT, which suggests a stability of this convection flow morphology for about 20 minutes. During this time period, the IMF remained stable for about 30 minutes, with a positive B z component of the order of 4 nT
and
small
fluctuatin.
g B x and
By components.
On this same day, the DMSP-F9 satellite crossed the radar
field of view at an altitude of 835 km between 0258 and 0300 UT (see the ionospheric footprint of the orbit in Figure 1). The observations made during this path are summarized in Plate 1. Particle data reveal distinct precipitation regions. From 0258:40 to 0259:00 UT, low-energy (typically below 800 eV) electrons are observed simultaneously with energy dispersed ions (labeled region 1 both in Figure ! and Plate 1). From 0259:00 and 0259:32 UT, an "inverted V" structure (labeled region 2) can be seen with a peak energy of --5 keV for the precipitating electrons. The DMSP-F9 drift-meter (upper panel in Plate !) gives the component of the plasma drift perpendicular to the orbit plane. It confirms the radar observations indicating an eastward velocity in region 1, a nearly zero velocity in the inverted V structure (region 2), and a westward velocity equatorward of it. Differences in the
222
Senior et al.: Polar Cap-Auroral Zone Boundary Analysis
79 F--. 75; (.3 Z • 73 71- 69
GOOSE BaY- SCHEFFERVILLE RADARS / DEC 6 1989
0258 - 0301 UT _.. 500 m/s
BOUNDARY
•'--'•'-•....
'--'
:•'%
'""
PLASMA SHEETc•.,,•c,•o, ' ' , .
/
d'3.00:17
Z•"-'•"•-'-'
, , i I • • , I • • , I [ • • 23 0 I 2MAGNETIC LOCAL TIME (hours)
Fig. 1. Convection map deduced from twin HF radar measurements at Schefferville and Goose Bay. The solid line depicts the ionospheric footprint of the DMSP-F9 orbit. Regions marked 1 and 2 are described in the text and
correspond to those in Plate 1.
amplitude of the velocity are due to the smoothing effect of the divergence-free analysis of the radar data.
Discussion
Accumulating evidence suggests that VDIS, similar to that portrayed in the above region 1, result from ExB dispersion of particles ejected from the distant neutral sheet. Indeed,
EFLUX 5 3 lO 8 4 >. 2 m 2 4 ß .
Plate 1. DMSP-F9 observations: (top panel) Plasma convection component perpendicular to the satellite orbit; (middle panel) Electron precipitation spectrogram; (bottom panel) Ion precipitation spectrogram (note the downward increase of the energy). Regions 1 (VDIS) and 2 (inverted V) are identical to those of Figure 1.
particles traveling into the magnetotail do not conserve their first adiabatic invariant as a result of the field reversal near the midplane [see the review by Chen, 1992]. Among the classes
of possible particle orbits, it has been suggested that particles
ejected with small pitch angles near the distant neutral line are responsible for the fast earthward beams observed in the
PSBL
[Takahashi
and
Hones,
1988].
Zelenyi
et al. [1990]
put
forward that the VDIS observed near the poleward edge of the auroral zone form the ionospheric image of these fast ion flows after ExB dispersion in latitude.
The simple model proposed in this latter study (see their
equation 3b) allows a first estimate of the downflowing proton
ejection site. Noting W the ion energy (in keV) and A3, the VDIS latitudinal extension, the energy-latitude dispersion is
W
1/2
= a (A30.
In this
expression,
the
a parameter
is given
by
a = -0.769
104/ViXo,
where
V i is the
north-south
component
of the ion velocity (in m/s) and X o the injection distance in the
magnetotail (in RE). Though some cases (particularly, the
reversed energy-latitude signature) could not be interpreted in terms of ExB dispersion, Zelenyi et al. [ 1990] pointed out
that
such
a description
can
account
for most
of the
VDIS they
observed. For the event presented above, one has a = -0.54
(keV)-l/2(deg)-I
from
the
satellite
data
and
V i = 150
rn/s
from
the
radar
velocity
map,
which
yields
an injection
distance
X 0
of = 95 R E (assuming that the VDIS consists exclusively of protons). This value is in the typical 50-100 R E range put
forward by Zelenyi et al. [ 1990].
On the
other
hand,
in the
latitude
interval
of interest,
Figure
1 displays a prominent eastward component of the convection velocity which is not accounted for in the above W-l/2/A3,
mapping. Upon transport toward the ionosphere, this
component suggests a dispersion of the particles not only in latitude but also in azimuth. To examine this outcome,
trajectory calculations were carried out using the three-
dimensional particle code of Delcourt et al. [1992]. Rather than a simple two-cell model of potential distribution in the
ionosphere, the vector velocity map of Figure 1 was implemented in the calculations, assuming that the field lines are equipotential and adopting a spline interpolation of the
measured electric field. As suggested by the stability of the
radar observations, this convection pattern was assumed to be
steady throughout particle transport from the distant tail. Test protons were thus launched from the spacecraft location with
energies from 2 keV up to 20 keV, and a pitch angle of 50 to conform with the DMSP-F9 detector view angle. These particles were traced backward in time up to the magnetosphere equatorial plane, using the "long-tail" version of the Tsyganenko [1987] ground state model which is consistent with the northward IMF B z prevailing during the
period studied. (Note that this model was assumed to be valid
up to the outermost trajectory apex, viz., =120 RE). The
calculations
were performed
within the guiding
center
approximation which is appropriate for the trajectory sequence
of interest here.
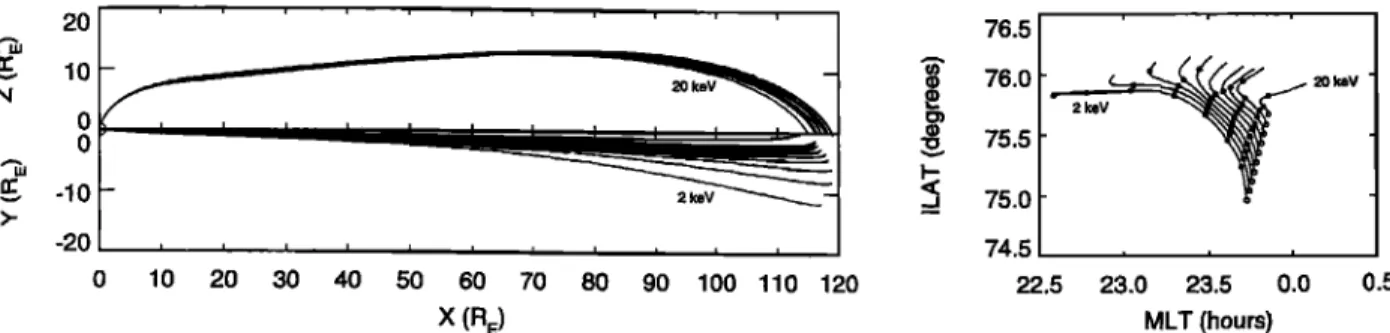
Figure 2 summarizes the results of the simulation. The left
panels
in this
figure
indicate
that
the
precipitating
H + exited
the
neutral
sheet
between
113 and 120 R E geocentric
distance,
i.e., somewhat tailward of the above first order estimate. Most
notably,
it is apparent
from
the
equatorial
trajectory
projections
(lower
left panel)
that less energetic
protons
originate
duskward of the high-energy ones, the source region extending over more than 10 R E in the dawn-dusk direction.
20 lO 76.5 ! ... •' I .... I ... I ! s- ' f. s I •- " i i i ... i .... & i i .... i, i i i , 10 20 30 40 50 60 70 80 90 100 110 120 X (RE)
76.0
75.575.0
-10 -20 74.5 0 22.5 • k•V 23.0 23.5 0.0 0.5 MLT (hours)Fig.
2. Model
trajectories
of the
downflowing
protons:
(Left)
Trajectory
projections
in the
X-Z
plane
(top)
and
in the
X-Y
plane
(bottom).
The X axis
points
tow•ird
the tail, and
the Y axis
from
dusk
to dawn.
(Right)
Trajectory
projections
into the
ionosphere.
Open
circles
depict
the
precipitation
location,
and
heavy
dots
depict
the
particle
time
of flight
by
steps
of 3 minutes.
The ionospheric projection of the H + paths can be appreciated in the right panel of Figure 2 where heavy dots depict the
particle time of flight (by steps of 3 minutes). It can be seen by
comparison with Figure 1 that the projected paths in the fight panel of Figure 2 follow the observed ionospheric drift flow field to the near vicinity of the equatorial plane. In this latter region, enhanced curvature drifts (and, ultimately, adiabaticity breaking near the tail midplane) yield large deviations from the prescribed convection pattern.
Provided that there exists a range of energies at each exit point from the neutral Sheet, the computed paths in the fight panel of Figure 2 allow us to estimate the width of the precipitating ion structure. Indeed, it can be seen in this panel that a 2 keV proton leaves the equatorial plane near 22.6 MLT and reaches the auroral zone after --21 minute time of flight. A 20 keV H + ejected from the same location will follow a similar
ionospheric
projected
path
but
during
a time
interval
in inve3se
proportion to the particle speed (i.e., --6.5 min). It will thus precipitate near 23.2 MLT, which suggests a longitudinal
width of the VDIS of at least one hour MLT.
The precipitating particle history can be further appreciated from Figure 3 which shows, in the X-Y plane, the computed H + paths projected to the equatorial footprint of the magnetic field lines successively encountered during transport (here, solid circles denote the particle ejection sites with energies as indicated, while open circles are the DMSP-F9 observed precipitation positions projected on to the equatorial plane). Also shown in this figure is the equatorial ExB flow field derived from the radar data. it is of interest to note that this
flow
is antisunward
at large
negative
Y values
and
in the
far-
tail (typically, X > 120 R E) close to the noon-midnight meridian, while it reverses in the central nightside sector. Due to negligible magnetic field curvature off-equator, it is again apparent from Figure 3 that most of the particle transport occurs along the convection streamlines. As the particles approach the equatorial plane (and prior to nonadiabatic motion), field line curvature gives rise to a large transverse drift which varies in proportion to the particle parallel energy.
Figure 3 also clearly emphasizes the distinct origins of the downflowing ions. While the high-energy ones originate from the central tail, it can be seen that the 2 keV H + map in a region where the ExB drift has a substantial tailward component, i.e., likely in the low-latitude boundary layer. As a matter of fact, as displayed by the dotted line which relates to a test proton with a presumed 1.5 keV energy, trajectory calculations at low energies (which are absent from the
precipitation spectrograms) reveal an equatorial origin near the
dusk flank of the magnetosphere. In other words, the computed azimuthal dispersion of the particle trajectories which is not accounted for in the two-dimensional ExB
disi•ersion
model of Zelenyi
et al. [1990], links the
precipitating populations to distinct magnetospheric regions. Furthermore, it can be suspected from Figure 3 Lhat low- energy particles, if any, originating from the central tail (e.g., near the 20 keV ejection site) will experience weaker curvature
drifts
and
possibly
be
swept
taftward
by
the
convection
electric
field. Accordingly, upon precipitation into the ionosphere, these particles will be located at higher latitudes than the high- energy ones, hence leading to the reverse energy-latitude dispersion signatures which are o9casionally observed [Zelenyi et al., 1990]. As evidenced from Figure 3, such features are plausible only in narrow longitudinal intervals. Though it is difficult to derive general conclusions from this one-case study, the present three-dimensional simulations thus emphasize the determining role of the actual convection pattern, and particularly of the particle longitudinal drift, in the auroral precipitation morphology as well as in the VDIS characteristic energy range.
... on (•.a) ,'
'. ... , •lil'
.•s '," ' ' ", ." "r •""'"'"7 /
1C)( •05 •10 116 120 126
x(%)
Fig. 3. Model trajectories of Figure 2 projected to the
equat•)riaI fOOt Of the magnetic fie!d lines. Labels denote the
distinct precipitation energies (in keV) and, between parenthesis, the corresponding neutral sheet ejection time (in minutes) as measured with reference to that of the 2 keV H +. The dotted line displays the path of a presumed 1.5 keV proton., while vectors indicate the equatorial pattern of the ExB flow field measured by the radars.
224
Senior
et al.:
Polar
Cap-Auroral
Zone
Boundary
Analysis
In addition to reconstructing the ejection site of the particles
from the neutral sheet, one would indeed be interested in
tracking thek origin prior to encounter with the tail midplane. For such calculations, not only the gross ExB flow morphology is needed, but also the exact spacing of the equipotentials will critically control the net energy gain of the particles during neutral sheet crossing. However, limitations inherent to the velocity amplitude determination (i.e., radar beams geometry) cast serious doubts upon the computed energy of the particles and clearly inhibit further investigation of the initial magnetospheric sector of the downflowing ions.
Also, the numbers between parenthesis in Figure 3 gives the delay, in minutes, between the ejection of the 2-keV protons and those of higher energies. They indicate that the dispersion of travel times from the equatorial plane to the ionosphere is of the order of 15 min, i.e., much larger than the
18-sec duration of the VDIS observation. This clearly rules
out an interpretation in terms of impulsive plasma injections from the distant tail.
At last, by comparison of the above Figure 1 and Plate !, it is possible to get some insights into the magnetospheric projection of the convection reversal boundary. Indeed, it has been assumed for many years that the PSBL is mapping to the discrete auroral zone. This viewpoint was recently challenged by Feldstein and Galperin [1985] who locate discrete auroral forms inside the plasma sheet. G•'ound-based and satellite observations clearly plead for this latter interpretation in which soft electron precipitation and ion beams detected poleward of the auroral arcs account for the ionospheric projection of the PSBL. These structures are precisely those seen in regions 1 and 2 of Figure 1 and Plate 1. Thus, if the high-latitude ion beams are downstream consequences of nonadiabatic particle transport in the distant neutral sheet and occur on closed field lines, then the data suggest that the convection reversal boundary observed equatorward of these beams is a fortiori located on closed field lines. These figures furthermore indicate that this boundary occurs in a narrow latitudinal interval between region 1 (VDIS) and region 2 (inverted V), as schematically shown on the left handside of Figure 1. We are thus led to conclude that the convection reversal boundary lies in the very vinicity of the PSBL, delineating the transition between the PSBL and the plasma sheet proper.
Summary
Simultaneous obsepcations from HF radars and the DMSP- F9 satellite have been used to relate the convection reversal
boundary and the nightside auroral precipitation pattern. This boundary lies near the poleward edge of auroral arcs, but equatorward of characteristic velocity dispersed ion structures at the border between the auroral zone and the polar cap. Three-dimensional trajectory calculations based on the ionospheric electric field measured by the radars reveal that the high-latitude precipitating ions originate from a large (several
RE) Y interval in the distant tail (up to X -- 120 RE). In the
ionosphere, the simulations suggest that this precipitation pattern extends over at least one hour magnetic local time. As these structures mark the ionospheric foot of the PSBL, it appears from the observations that the convection reversal boundary is at the transition between the PSBL and the central plasma sheet.
Acknowldegments. We thank the GSFC IMP-8
magnetometer
team
of for the
use
of their
data.
This
work
has
been
supported
by INSU, NFS, and
by the Air Force
Office
of Scientific Research, under grants GdR Pasmae, ATM- 9003860 and ATM-9108193, and 2311G5.
References
Chen, J., Nonlinear dynamics of charged particles in the
magnetotail, J. Geophys. Res., 97, 15011, 1992.
Delcourt, D.C., T. E. Moore, J. A. Sauvaud, and C. R.
Chappell,
Nonadiabatic
transport
features
in the
outer
cusp
region, J. Geophys. Res., 97, 16833, 1992.
Feldstein, Ya. I. and Yu. !. Galperin, The auroral luminosity structure in the high latitude upper atmosphere :Its
dynamics and relationship to the large-scale structure of the
earth's magnetosphere, Rev. Geophys., 23, 217, 1985. Greenwald, R., K. Baker, R. Hutchins, and C. Hanuise, An
HF phased-array radar for studying small scale structure in the high latitude ionosphere, Radio Sci., 20, 63-79, 1985.
Hanuise, C., C. Senior, J.-C. Cerisier, J.-P. Villain, R. Greenwald, J. Ruohoniemi, and K. Baker, Instantaneous
mapping of high-latitude convection with coherent HF radars, J. Geophys. Res., in press, 1993.
Newell, P., and C.-I. Meng, Mapping the dayside ionosphere to the magnetosphere according to particle precipitation characteristics, Geophys. Res. Lett., 19, 609, 1992.
Ruohoniemi, J., R. Greenwald, K. Baker, J.-P. Villain, C. Hanuise, and J. Kelly, Mapping high-latitude plasma convection with coherent HF radars, J. Geophys. Res., 94,
13463, 1989.
Saito, Y., T. Mukai, M. Hirahara, S. Machida, and N. Kaya, Distribution function of precipitating ion beams with velocity dispersion observed near the poleward edge of the
nightside
auroral
oval,
Geophys.
Res.
Lett.,
19, 2155,
1992.
Takahashi, K., and E. Hones, Jr., !SEE 1 and 2 observations of ion distributions at the plasma sheet-tail lobe boundary, J. Geophys. Res., 93, 8558, 1988.
Tsyganenko, N., Global quantitative models of the
geomagnetic field in the cislunar magnetosphere for
different disturbance levels, Planet. Space Sci., 35, 1347, 1987.
Zelenyi, L., R. Kovrazkhin, and J.-M. Bosqued, Velocity dispersed ion beams in the nightside auroral zone: Aureol-3
observations, J. Geophys. Res., 95, 12119, 1990.
C. Senior, D. Delcourt, and J.-C. Cerisier, CRPE/CNRS, 4 Av. de Neptune, 94!07 Saint-Maur, France.
C. Hanuise, LSEET, Universit6 de Toulon et du Var, BP
132, 83957 La Garde Cedex, France.
J.-P. Villain, LPCE, 3A Av. de la Recherche Scientifique,
45045 Orl6ans La Source, France.
R. G. Greenwald, and P. T. Newell, APL, The Johns Hopkins University, Laurel, MD 20707.
F. J. Rich, Physics Laboratory/GMG, Hanscom Air Force
Base, Bedford, MA 01731-5000.
(Received June 3, 1993; accepted August 10, 1993.)