HAL Id: hal-01694200
https://hal.archives-ouvertes.fr/hal-01694200
Submitted on 7 May 2018HAL is a multi-disciplinary open access archive for the deposit and dissemination of sci-entific research documents, whether they are pub-lished or not. The documents may come from teaching and research institutions in France or abroad, or from public or private research centers.
L’archive ouverte pluridisciplinaire HAL, est destinée au dépôt et à la diffusion de documents scientifiques de niveau recherche, publiés ou non, émanant des établissements d’enseignement et de recherche français ou étrangers, des laboratoires publics ou privés.
Growth undercooling in multi-crystalline pure silicon
and in silicon containing light impurities (C and O)
Thècle Riberi-Béridot, M. G. Tsoutsouva, G. Regula, G. Reinhart, I.
Perichaud, J. Baruchel, Nathalie Mangelinck-Noël
To cite this version:
Thècle Riberi-Béridot, M. G. Tsoutsouva, G. Regula, G. Reinhart, I. Perichaud, et al.. Growth under-cooling in multi-crystalline pure silicon and in silicon containing light impurities (C and O). Journal of Crystal Growth, Elsevier, 2017, 466, pp.64-70. �10.1016/j.jcrysgro.2017.03.025�. �hal-01694200�
1
Growth undercooling in multi-crystalline pure silicon and in silicon
containing light impurities (C and O)
T. Riberi – Béridot(a), M.G. Tsoutsouva(a), G. Regula(a), G. Reinhart(a), I. Périchaud(a), J. Baruchel(b), N. Mangelinck-Noël(a),*
(a)
Aix Marseille Univ, CNRS, IM2NP UMR CNRS 7334, Campus Saint Jérôme, case 142, 13397 Marseille Cedex 20, France.
(b)
ESRF, 71, avenue des Martyrs, CS40220, 38043 Grenoble Cedex 9, France.
Abstract
Undercooling during the solidification of silicon is an essential parameter that plays a major role in grain nucleation and growth. In this study, the undercooling of the solid-liquid interface during growth of multi-crystalline silicon samples is measured for two types of silicon: pure, and containing light elements (carbon and oxygen) to assess and compare their impact on crystal growth. The solid-liquid interface undercooling is measured using in situ and real time X-ray synchrotron imaging during solidification. As a subsequent step, ex situ Electron Backscattered Diffraction (EBSD) is performed to obtain information about the crystalline structure, the grain orientation and the grain boundary character. Two main conclusions arise: i) the undercooling of the global solid-liquid front increases linearly with the growth rate which indicates uniform attachment, i.e. all atoms are equivalent, ii) the same trend is observed for pure silicon and silicon containing carbon and oxygen. Indeed, the growth law obtained is comparable in both cases, which suggests that the solutal effect is negligible as concern the undercooling in the case of a contamination with carbon (C) and oxygen (O). However, there is a clear effect of the impurity presence on the crystalline structure and grain boundary type distribution. Many grains nucleate during growth in samples containing C and O, which suggests the presence of precipitates on which grain nucleation is favored.
*Manuscript
2
Keywords: A1. Directional solidification; A1. Characterization; A1. Growth laws; A1.
Impurities; A2. Growth from melt; B2. Semiconducting silicon.
1. Introduction
Photovoltaic industry needs to produce photovoltaic material faster with always lower cost. The classical fabrication process of silicon ingots is based on directional solidification. Solid-liquid transformation under non-thermodynamic equilibrium implies issues to be tackled such as impurity segregation, grain nucleation and competition dynamics. Moreover, it is essential to develop predictive and quantitative simulations of the silicon solidification processes implying knowledge of the specific silicon growth mechanisms. As such, theoretical, experimental and modeling studies have been carried out in the past 50 years [1-4]. In particular, growth laws need to be determined to obtain reliable simulations of the growing solid-liquid interface. Theoretical growth laws have been proposed but experimental validation although difficult is strongly needed.
Growth laws are classically related to the undercooling above the solid-liquid interface. Liquid undercooling is the phenomenon by which a material remains liquid at a temperature below the equilibrium phase diagram melting point. Undercooling is usually present at the level of the growing interface from the melt in metallurgy or crystal growth due to non-equilibrium conditions during solidification. Growth undercooling has to be distinguished from nucleation Sundercooling necessary for new grains to appear. The total undercooling of the growing solid-liquid interface can be written using the following theoretical equation which separates the main contributions to undercooling and that can be found for example in [5]:
(1)
where , and are respectively the thermal, the constitutional, the curvature and the kinetic undercoolings:
3
- , the thermal undercooling, is due to the rejection of latent heat for the solid-liquid phase transformation and thus at the interface. The effect of latent heat rejection can be to slow down solidification. The dimensionless thermal undercooling can be expressed by [6]:
(2)
where ΔT is the undercooling, CS is the specific heat of the solid material and H is the
heat of fusion.
- , the constitutional undercooling is an important undercooling component in the case of alloys. Indeed, solutes with partition coefficient lower than 1 are rejected in the liquid at the solid-liquid interface, which changes, locally, the thermodynamic equilibrium. The rejected solute accumulates in a limited layer neighboring to the interface, the thickness of this layer can be expressed as [7] :
(3)
where DL is the solute diffusion coefficient and the growth velocity.
The solute concentration in the liquid, for planar front, CL is given by [8]:
(4)
where C0 is the nominal composition and k is the partition coefficient.
The constitutional undercooling is given by the difference between the equilibrium liquidus temperature Teq (z) and the temperature imposed by the temperature gradient
Tm (z).
4
(6)
(7)
where T0 is the pure silicon equilibrium melting temperature, is the liquidus slope
and GL the liquidus temperature gradient.
- , The curvature undercooling is due to the Gibbs Thomson effect that implies that a smaller radius of curvature reduces melting temperature of the crystal. This contribution to the undercooling has been expressed by Herlach [5] :
(8)
where is the anisotropy parameter of the interface energy, is the angle between the normal to the interface and the growth direction, the radius of curvature of the solid and the capillary constant (Gibbs-Thomson parameter) , being the interface energy and the entropy of fusion.
- , The kinetic undercooling depends on the crystallographic orientation and on the atom kinetic attachment mechanism. This term is, in theory, predominant for the undercooling of a pure silicon macroscopically flat growing interface. The growth rate is usually related to the kinetic undercooling by an equation of the type [6]:
(9)
where the function f depends on the atomic attachment mechanism as developed in the following.
For a uniform growth regime (all sites at the interface are favorable for growth) or for a rough interface, growth follows a linear law:
(10)
5
incorporated at the interface, lattice geometric factors and thermodynamic latent heat of solidification.
For a growth regime by bi-dimensional nucleation on a facet (lateral growth), the growth law is exponential:
(11)
with A and B constants. B depends on lattice geometric factors and on the nucleation rate, A depends on a geometric factor and on the surface tension at the interface.
For a growth regime on a facet and facilitated by the presence of screw dislocations, growth is permitted at lower undercoolings than for bi-dimensional growth:
(12)
where is a constant which depends on diffuseness parameter, on lattice geometric factor and on the density of dislocations.
The kinetic undercooling is thus linked to the morphology of the interface and to associated defects. A faceted morphology is associated with a high kinetic undercooling whereas a rough morphology is associated with a low kinetic undercooling because the atom attachment is easier on such surface.
Extensive theoretical, experimental and modelling works have been performed to predict the interface undercooling and in particular for silicon. Voronkov [1] conducted a theoretical study on {111} facet kinetic in silicon and derived the undercooling of silicon facets with and without dislocations. For , the undercooling at a {111} facet in a monocrystal with dislocations was estimated to be , whereas the undercooling in the case excluding the presence of dislocations was estimated to be .
6
Beatty and Jackson [2] conducted Monte-Carlo simulations of the undercooling for two growth orientations <100> and <111>. They found which, for Czochralski growth rates in the [100] direction of silicon around gives
.
Fujiwara et al. [3] determined a relationship between and by conducting silicon growth experiments observed by scanning confocal microscopy. The melting temperature, Tm,
was determined when the interface was motionless. Then, the crystal was melted at a temperature lower than Tm, so that, the crystal could grow in the undercooled melt. Several
undercooling levels were imposed and for each of them, the solid-liquid interface growth rate was measured. Thus, they determined a relationship of the solid-liquid interface growth velocity of Si crystal as a function of the undercooling : . For the establishment of this relationship, there was no control of the seed orientation on the contrary to the study of dendritic growth in the follow-on of the article. This relationship can be considered as the relationship applying to general silicon solid-liquid interface undercooling.
In the present paper, we determine experimentally the undercooling of the solid-liquid interface, in directional solidification conditions, as a function of the growth rate for both pure silicon and silicon containing carbon and oxygen using X-ray radiography. The in situ experiments are completed by ex situ EBSD to further characterize the influence of carbon and oxygen on the grain structure.
2. Experimental methodology
The experiments of directional solidification are carried out in a dedicated Bridgman-type high temperature furnace named GaTSBI (Growth at high Temperature observed by X-ray
7
Radiation Facility (ESRF). This furnace is essentially made of two resistive heating elements and the whole device is adapted to synchrotron imaging, which allows real time and in situ imaging during the solidification and growth of silicon. A detailed description of the device can be found in [8].
The experiments are performed on a sample of pure silicon (6N), and on a sample containing carbon and oxygen. C and O impurities constitute a case study because they are light impurities often introduced during the classical fabrication processes of silicon for PV applications. The sample size is fixed at (length width), and 300 µm in thickness. It is placed in a boron nitride crucible, which is inserted into the furnace. Then, this assembly is introduced in the two-zone furnace.
During growth, the sample is illuminated by a polychromatic (white) X-ray synchrotron beam. To perform X-ray radiography imaging, the beam is monochromated at 17.5 keV by a double Si (111) monochromator after passing through the sample, and the images are recorded on a FReLoN CCD camera. X-ray radiography imaging is based on differences of absorption of the X-ray beam by the solid and liquid phases. In the case of silicon, the density difference between solid and liquid is small ( , ), so that image post processing is necessary [9]. With this technique, we can follow the evolution of the solid-liquid interface during growth in situ and in real-time, with a large field of view (10 mm 6 mm), spatial resolution with a pixel size: 5.8 μm 5.8 μm and acquisition rate of 1 Hz. Calculations of the solid-liquid interface growth rates and its dynamic position are directly measured on the images.
Preparation of the initial solid-liquid interface
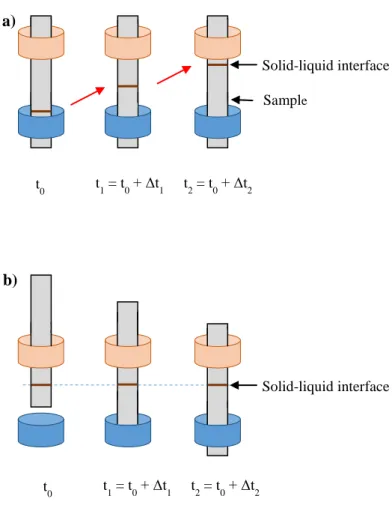
The sample/crucible assembly is initially positioned in the top zone, where the heating resistance is set to a temperature above the silicon melting point (Fig. 1.a) so that the sample
8
is fully melted. Then a first solidification is initiated in the undercooled liquid inducing dendritic growth and few random orientations as proposed by Usami et al. [10]. In a second step, the sample is partially melted to keep a small solid region acting as a seed at the bottom before starting controlled solidification.
Determination of the undercooling
Two types of solidification procedures are performed to measure the temperature gradient, G, and the shift towards the equilibrium position of the growing interface, h, which altogether allow determining the undercooling, T.
Fig. 1. Solidification procedures in the GaTSBI furnace: a) Solidification by cooling down of the heaters, b) Solidification by pulling of the sample inside the furnace.
First of all, the temperature gradient in the sample, G, is calculated during an experiment of controlled cooling (Fig. 1a). An initial temperature gradient is applied on the heaters. The solidification is triggered by applying a cooling rate on both heaters. The same cooling rate is applied on both heaters to maintain a constant temperature gradient. During cooling down experiments, the sample does not move. We measure the position of the interface which moves up during growth and determine the interface growth rate, . The corresponding temperature gradient is calculated knowing the applied cooling rate R and the measured growth rate. We earlier checked that the thermal conditions are reproducible when the same temperature gradient is imposed on both heaters for different experiments. Finally, the temperature gradient G inside the sample is given by the equation:
(13).
The same constant temperature gradient is applied during all the experiments studied here and as a direct consequence; the temperature gradient in the sample is constant as well. The temperature gradient inside the sample calculated with equation (13) is given by
9
for all the experiments described in the following.
On the other hand, to obtain the undercooling of the solid-liquid interface, we measure the shift in position of the growth front compared to the equilibrium position. It can only be measured during pulling experiments (Fig.1 b). In that case, the sample is pulled down from the hot zone to the cold zone at a constant pulling rate inside a constant temperature gradient. In other words, the temperature of both resistances is maintained constant and the sample moves inside the furnace. The interface does not move in the camera frame of reference, because it is moving upwards in the sample frame of reference.
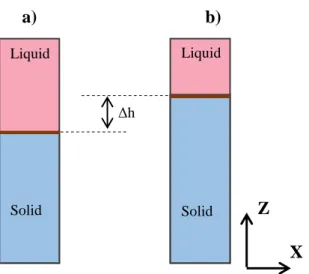
During pulling of the sample, if there is undercooling during growth, the interface is not at the position corresponding to the equilibrium temperature isotherm. If this is the case, when the pulling of the sample is stopped, the interface rises until it reaches its thermodynamic equilibrium position, which corresponds to the isotherm position of the equilibrium melting temperature. In our experiments, we check that this position does not depend on the preceding applied pulling rate which is expected because it corresponds to the phase diagram equilibrium position without any undercooling. For each experiment, we compare the stationary position during growth at a constant pulling rate with the position of thermodynamic equilibrium, as shown schematically in figure 2. The solid-liquid interface position when pulling the sample is always lower than its equilibrium position.
Fig. 2. a) Stationary position of the interface during growth for a given pulling rate, b) Interface at its thermodynamic equilibrium position.
Then, the undercooling is obtained by multiplying the height difference between those two positions by the temperature gradient G:
(14).
10
rates are applied (5, 10, 20 and 30 µm/s) on both studied samples together with a constant temperature gradient in the sample of 15 K/cm determined with the procedure described above.
Ex situ investigation
Additionally, after the last solidification, we carry out ex situ electron back-scattering diffraction (EBSD) to obtain the grain orientations in the three space directions, the twin relationships and the number of grains. In this work, Σ3 〈111〉, Σ9 〈110〉, Σ27a 〈110〉, Σ27b 〈210〉 twin boundaries labeling refer to rotations around 〈hkl〉 that satisfy the misorientation ranges given by the Brandon criterion, which are (60 ± 8.66), (38.94 ± 5), (31.58 ± 2.89) and (35.42 ± 2.89), respectively.
C and O concentrations are determined by instrumental gas analysis (IGA) in the sample containing impurities giving [C] = 1.6 x 10¹⁸ at/cm3 and [O] = 4.74 x 10¹⁷ at/cm3. Moreover, Fourier transform infrared spectroscopy (FTIR) is performed at room temperature on a Bruker Vertex spectrophotometer. Interstitial oxygen ([Oi]) and substitutional carbon ([Cs])
concentrations are determined according to the 1107 cm-1 and 607 cm-1 absorption lines respectively, with respective calibration factors and for [Oi] and [Cs] [11].
3. Results
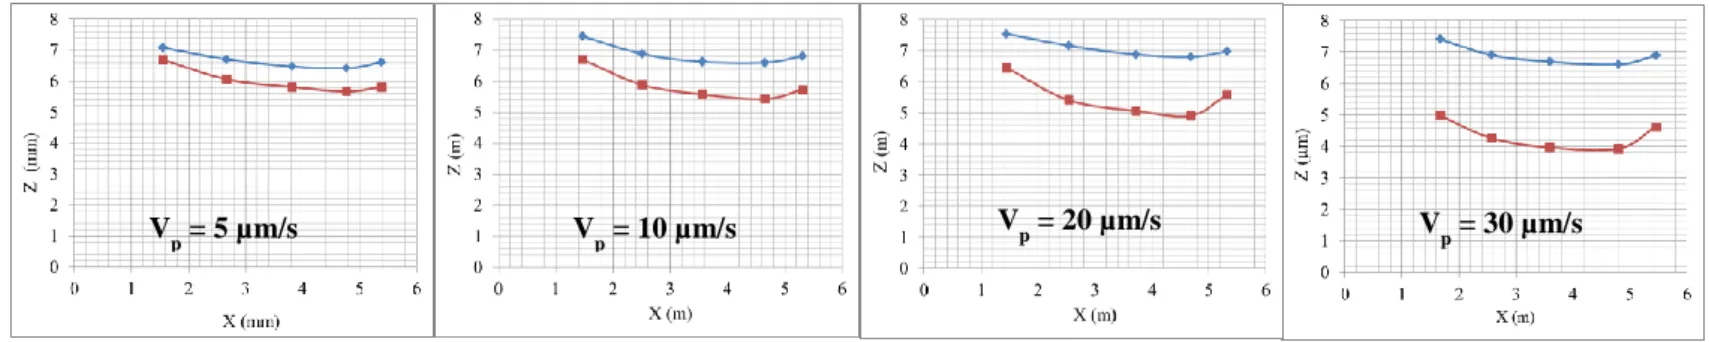
Figure 3 shows the position of the interface, measured at several points along the interface for each pulling rate, during growth (in red), and after stabilization (in blue), for both samples: pure silicon (Fig.3 a) and silicon containing impurities (Fig.3 b).
Fig. 3. Measured position and shape of the solid-liquid interface at different pulling rates (Vp) for a) the pure silicon sample and b) the silicon sample containing C and O. Red curves
11
correspond to the interface position during growth. Blue curves correspond to the interface at its thermodynamic equilibrium position. Error bars are smaller than the point size.
The solid-liquid interface shape differs between both samples. This is due to the local thermal field for each particular sample.
The first most important result is that the equilibrium position of the interface after having stopped the pulling is reproducible for the same sample, confirming that we measure the equilibrium melting isotherm position. The small difference however observed is due to the unavoidable variations of thermal field between experiments. This negligible difference confirms that the thermal conditions are not significantly modified from one experiment to the other for a constant temperature gradient applied to the same sample.
Second, the growth interface has a lower position than the equilibrium melting position. For each pulling rate, the difference between both curves increases with the pulling rate, thus, the undercooling increases with the velocity indicating immediately a kinetic effect.
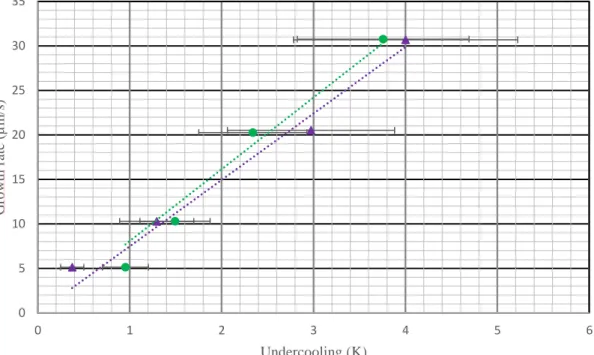
Fig. 4. Growth rate as a function of the undercooling. Points corresponding to pure silicon and silicon containing C and O respectively in green circles and in purple triangles.
The undercooling is calculated with equation 14 and the growth rate is measured by using the in situ images. Finally, the growth rate as a function of the undercooling is plotted on Figure 4. Points corresponding to pure and silicon containing impurities are respectively in green and purple. The trend line was determined assuming that zero velocity implies no undercooling, which is a reasonable assumption according to the theory and to the fact that with no pulling rate applied, the interface remains at the same equilibrium position in all experiments. A linear law is justified by the alignment of the experimental points. We obtain, for pure silicon:
12
(15) The error is calculated as:
(16)
where d(Δh) is the measurement error related to the pixel resolution. dG is calculated by the difference between the temperature gradient calculated for the maximal and the minimal measured growth rate during the experiment of solidification by controlled cooling in a constant applied temperature gradient. This evaluation of the error on the temperature gradient is certainly giving the highest limit of the measurement error.
The same experimental protocol is repeated with the sample voluntarily contaminated with C and O. The growth rate as a function of the undercooling shows a linear dependence similarly to pure silicon. The corresponding linear adjustment leads to the following equation:
(17)
4. Discussion
The undercooling during the solidification of pure silicon was also studied by Fujiwara [3] as mentioned in the introduction. Our results are in agreement with Fujiwara et al. results despite that our conditions and experimental procedure are different. Indeed, the law they derived from their experiments is also linear and is given by:
(18).
On top of the fact that both laws are linear, the coefficients are of the same order of magnitude. This allows us to conclude that boron doping induced by the boron nitride crucible in our experiments, has no effect on undercooling. This agreement also shows that there exists at the global solid-liquid interface of silicon a growth rate dependent undercooling. The linear behavior is consistent with the existence of a kinetic component of the undercooling.
13
to the undercooling. Indeed, the other undercooling components are all negligible as shown in the following.
As concern the dimensionless thermal undercooling, in the case of silicon, , and equation 2 gives :
which is much lower
than 1 and thus it can be neglected.
Additionally, the directional solidification configuration with G > 0 ensures a morphologically stable and smooth interface. The radius of curvature approaches infinity, which means that the curvature undercooling tends toward zero and thus this term is also negligible.
At last, the constitutional undercooling component does not intervene in the pure silicon material therefore, only the kinetic component come into play.
However, in the sample containing C and O, a contribution of the constitutional undercooling could be expected due to the presence of impurities. Calculations are made to estimate the constitutional undercooling and its extension using equations (3-7) and phase diagram data using Thermo-Calc software. Even for the highest velocity, constitutional undercooling on top of the solid-liquid interface is negligible. In fact, this is consistent with the measured undercoolings in the sample containing C and O (Fig. 4). Indeed, we obtain a linear velocity dependence and the same kinetic coefficient, taking into account the error bars, as for the pure sample despite the presence of C and O, which suggests that the carbon and the oxygen do not participate to the undercooling build-up at the front.
However, although the undercooling is not modified by the presence of these impurities, the interface morphology during solidification is significantly different in both samples.
In both cases, we observe an increasing disturbance of the solid-liquid interface with increasing growth rate. Grain boundary grooves formed at the encounter between the solid-liquid interface and grain boundaries can be observed and have been thoroughly studied in our
14
previous work [12]. They reveal the multi-crystalline nature of the sample. Their occurrence is more important in the case of the sample containing impurities even for low growth rates whereas the initial stage is identical which suggests copious nucleation events during growth when C and O impurities are present.
This conclusion is confirmed by the EBSD measurements performed on the samples after the last solidification. Indeed, for both samples, the total number of grains is determined from the EBSD results. For the pure sample and for the sample containing C and O with the same processing conditions, 1221 and 2065 grains are counted respectively. Thus, more grains nucleate during the growth of the sample containing C and O.
As mentioned above, the concentrations in carbon and oxygen in this sample are measured by IGA: and . Additionally, FTIR
measurements are performed. The concentration in substitutional carbon is: and the concentration in interstitial oxygen is: . The
comparison between the total C and O concentrations and the substitutional C and insterstitial O concentrations indicates that part of the carbon is in precipitate form which can be expected, due to the very low solubility limit of carbon in silicon [13] . As a consequence, these impurities are involved in the formation of
precipitates in the material, precipitates on which new grain nucleation is favored which is consistent with the above results. Moreover, data obtained for different processing conditions on several samples during our previous experiments also confirmed that there is a significant increase of the nucleation rate during growth in samples with C & O impurities compared to pure samples even for the concentrations considered here.
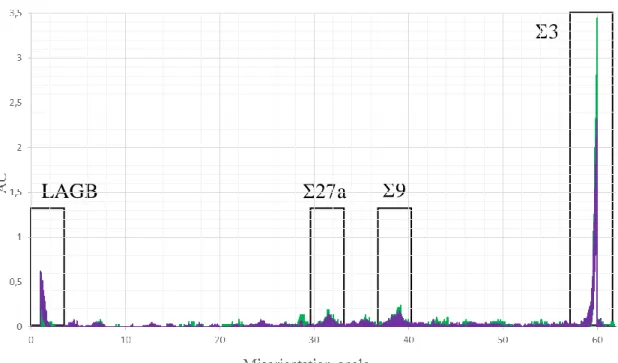
Figure 5 shows the misorientation angle distribution for the two samples. The first zone concerns the low angle grain boundaries, the second zone, corresponds to Σ a twin boundaries, which result from a rotation of 32° around {110}. The third zone
15
rr nd t Σ9 twin b undari whi h r ult fr m a r tati n f ° ar und 0}, and the fourth zone to Σ twin b undari whi h r ult fr m a r tati n f ° around {111}.
Fig. 5. Misorientation angle distribution obtained by EBSD (pure silicon: green, silicon containing C and O: purple). Four particular misorientation regions are highlighted: low
angle grain boundaries (LAGB), Σ27a, Σ9 and Σ3 twins.
There are less Σ3, Σ9 and Σ27a twin boundaries in the silicon sample containing impurities than in the pure silicon sample, which is in favor of random nucleation.
As a conclusion, C and O do not accumulate on top of the solid-liquid interface which explains their low impact on the establishment of the undercooling at the level of the solid-liquid interface. Indeed, these impurities soon precipitate as the solubility limit is reached especially in the case of C [13]. In the subsequent step, the driving force for new grain nucleation is the decrease of the necessary nucleation undercooling due to the presence of precipitates. Beaudhuin et al. [15] observed as well that the addition of carbon creates silicon carbide precipitates which favor nucleation. In pure samples, the formation of new grains is driven by the twinning phenomenon which leads to a majority of twin boundaries in the final ingot grain structure [14]. When precipitates are at stake, no special relationship between the new grain and other grains is expected leading to an increase of random angle grain boundaries.
Conclusion
This work allowed determining the undercooling of the global solid-liquid interface of directionally solidified silicon for growth parameters similar to the ones used in the fabrication of silicon for photovoltaic applications. Under these conditions, the undercooling in silicon is always present and is dominated by its kinetic component. The corresponding law
16
is linear and consistent with uniform attachment or attachment on a rough interface. The presence of grain boundary grooves and grain nucleation during growth does not modify significantly this law. Light impurities like C and O do not affect the undercooling of the global solid-liquid interface but greatly affect the final grain structure.
Acknowledgments
This work was funded by the ANR Projects SiX (N° ANR-08-HABISOL-012-01) and CrySaLID (N° ANR-14-CE05-0046-01). The ESRF (European Synchrotron Radiation Facility) BM05 team is greatly acknowledged for support during the X-ray imaging experiments. Laurent Barrallier and Fabrice Guittonneau are acknowledged for the EBSD measurements. Gildas Guillemot and Charles-André Gandin (Centre de Mise en Forme des Matériaux) are greatly acknowledged for the Thermo-Calc software data.
References
[1] V.V. Voronkov, Supercooling at the face developing on a rounded crystallographic front, Soviet Physics-Crystallography, 17 (1973) 807-813.
[2] K.M. Beatty, K.A. Jackson, Monte Carlo modeling of silicon crystal growth, Journal of Crystal Growth, 211 (2000) 13-17.
[3] K. Fujiwara, K. Maeda, N. Usami, G. Sazaki, Y. Nose, A. Nomura, T. Shishido, K. Nakajima, In situ observation of Si faceted dendrite growth from low-degree-of-undercooling melts, Acta Materialia, 56 (2008) 2663-2668.
[4] W. Miller, Some remarks on the undercooling of the Si(1 1 1) facet and the “Monte Carlo modeling of silicon crystal growth” by Kirk M. Beatty & Kenneth A. Jackson, J. Crystal Growth 211 (2000) 13, Journal of Crystal Growth, 325 (2011) 101-103. [5] D.M. Herlach, Non-equilibrium solidification of undercooled metallic melts, Metals, 4 (2014) 196-234.
[6] M.C. Flemings, Solidification Processing, 1974.
[7] J.P. Garandet, Croissance Cristalline en phase liquide: éléments théoriques., Société Française d'Optique, 8 (2003) 23-55.
[8] A. Tandjaoui, N. Mangelinck-Noël, G. Reinhart, B. Billia, J.J. Furter, T. Lafford, J. Baruchel, X. Guichard, Real time observation of the directional solidification of multicrystalline silicon: X-ray imaging characterization, Energy Procedia, 27 (2012) 82-87. [9] A. Tandjaoui, N. Mangelinck-Noël, G. Reinhart, B. Billia, X. Guichard, Twinning occurrence and grain competition in multicrystalline silicon during solidification, C.R. Physique, 14 (2013) 8.
[10] N. Usami, I. Takahashi, K. Kutsukake, K. Fujiwara, K. Nakajima, Implementation of faceted dendrite growth on floating cast method to realize high-quality multicrsytalline Si ingot for solar cells, Journal of applied physics, 109 (2011) 083527.
17
[11] D. Yang, R. Fan, L. Li, D. Que, K. Sumino, Effect of nitrogen–oxygen complex on electrical properties of Czochralski silicon, Appl Phys Lett, 68 (1996) 487-489.
[12] A. Tandjaoui, N. Mangelinck-Noel, G. Reinhart, B. Billia, T. Lafford, J. Baruchel, Investigation of grain boundary grooves at the solid–liquid interface during directional solidification of multi-crystalline silicon: in situ characterization by X-ray imaging, Journal of Crystal Growth, 377 (2013) 203-211.
[13] F. Durand, J.C. Duby, Carbon solubility in solid and liquid Silicon-A review with reference to eutectic equilibrium, Journal of Phase Equilibria, 20 (1999) 61-63.
[14] T. Riberi-Béridot, N. Mangelinck-Noël, A. Tandjaoui, G. Reinhart, B. Billia, T. Lafford, J. Baruchel, L. Barrallier, On the impact of twinning on the formation of the grain structure of multi-crystalline silicon for photovoltaic applications during directional solidification, Journal of Crystal Growth, 418 (2015) 38-44.
[15] M. Beaudhuin, G. Chichignoud, P. Bertho, T. Duffar, M. Lemiti, K. Zaïdat, Carbon reaction with levitated silicon-Experimental and thermodynamic approaches, Materials Chemistry & Physics, 133 (2012) 284-288.
Fig. 1. Solidification procedures in the GaTSBI furnace: a) Solidification by cooling down of
the heaters, b) Solidification by pulling of the sample inside the furnace.
Fig. 2. a) Stationary position of the interface during growth for a given pulling rate, b)
Interface at its thermodynamic equilibrium position.
Fig. 3. Measured position and shape of the solid-liquid interface at different pulling rates (Vp) for a) the pure silicon sample and b) the silicon sample containing C and O. Red curves correspond to the interface position during growth. Blue curves correspond to the interface at its thermodynamic equilibrium position. Error bars are smaller than the point size.
Fig. 4. Growth rate as a function of the undercooling. Points corresponding to pure silicon and
silicon containing C and O respectively in green circles and in purple triangles.
Fig. 5. Misorientation angle distribution obtained by EBSD (pure silicon: green, silicon
containing C and O: purple). Four particular misorientation regions are highlighted: low angle grain boundaries (LAGB), Σ27a, Σ9 and Σ3 twins.
Sample Solid-liquid interface t 0 t1 = t0 + Δt1 t2 = t0 + Δt2 Solid-liquid interface t 0 t1 = t0 + Δt1 t2 = t0 + Δt2 a)
Fig. 1. Solidification procedures in the GaTSBI furnace: a) Solidification by cooling down of the heaters, b)
Solidification by pulling of the sample inside the furnace.
b)
Δh Solid Liquid a)
Fig. 2. a) Stationary position of the interface during growth for a given pulling rate, b) Interface at its
thermodynamic equilibrium position.
b) Solid Liquid Z X Figure 2
Fig. 3. Measured position and shape of the solid-liquid interface at different pulling rates (Vp) for a) the pure silicon sample and b) the silicon sample containing C and O. Red curves correspond to the interface position during growth. Blue curves correspond to the interface at its thermodynamic equilibrium position. Error bars are smaller than the point size.
a) b) V p = 5 µm/s Vp = 10 µm/s V p = 20 µm/s Vp = 30 µm/s V p = 5 µm/s Vp = 10 µm/s Vp = 20 µm/s Vp = 30 µm/s Figure 3
0 5 10 15 20 25 30 35 0 1 2 3 4 5 6 Gr o w th r ate (µm /s ) Undercooling (K)
Fig. 4. Growth rate as a function of the undercooling. Points corresponding to pure silicon and silicon
containing C and O are respectively in green circles and in purple triangles.
Fig. 5. Misorientation angle distribution obtained by EBSD (pure silicon: green, silicon containing C and O:
purple). Four particular misorientation regions are highlighted: low angle grain boundaries (LAGB), Σ27a, Σ9 and Σ3 twins.