Corey A. Rice, Jan Fulara, Iryna Garkusha, Ádám Nagy,
François-Xavier Hardy, Oliver Gause, and John P. Maier*
Electronic Spectra of Corannulenic Cations
and Neutrals in Neon Matrices and
Protonated Corannulene in the Gas Phase
at 15 K
DOI 10.1515/zpch-2015-0598
Received March 20, 2015; accepted June 14, 2015
Abstract: Three absorption systems starting at624.1,601.2, and590.0 nmwere detected in a6 Kneon matrix following deposition of mass selected𝑚/𝑧 = 250 ions produced from corannulene vapour in a hot cathode ion source. The two lat-ter systems were also observed aflat-ter deposition of neutral corannulene in solid neon with concomitant bombardment of the matrix with argon ions. The fea-tures in the absorption spectrum are assigned to the42A ← 𝑋2Atransition of cylobutadieno-benzo[ghi]fluoranthene cation and to the32A ← 𝑋2Aand
32A ← 𝑋2Atransitions of two Jahn-Teller structures of bowl-shaped coran-nulene cations, respectively. The assignment is based on excitation energies cal-culated with the SAC-CI and CASPT2 methods. The electronic absorption spec-trum of protonated corannulene has onsets at 515.1and398.8 nm in a neon matrix, following deposition of a mass-selected beam produced by reactions of corannulene withEtOH2+. The absorptions are assigned, on the basis of the-oretical predictions, to the3,41A ← 𝑋1A transitions. The electronic spectrum was also recorded in the gas phase using a resonant multiphoton fragmentation technique in an ion trap at vibrational and rotational temperatures of15 K. The
3,41A ← 𝑋1A transitions are observed with origin bands at521 ± 1 nmand
396.4 ± 0.1 nm. The31A excited electronic state indicates fast internal conver-sion of≈ 5 fs, while the41A state has a lifetime of≈ 0.2 ps. A distinct vibrational pattern is discernible in the41A ← 𝑋1A transition.
*Corresponding author: John P. Maier, Department of Chemistry, University of Basel, Klingelbergstrasse 80, CH-4056 Basel, Switzerland, e-mail: [email protected]
Corey A. Rice, Iryna Garkusha, Ádám Nagy, François-Xavier Hardy, Oliver Gause: Department of Chemistry, University of Basel, Klingelbergstrasse 80, CH-4056 Basel, Switzerland
Jan Fulara: Institute of Physics Polish Academy of Sciences, Al. Lotników, 32/46, PL-02-668, Warsaw, Poland
Keywords: Electronic Spectroscopy, Matrix Absorption Spectroscopy,
Corannu-lene Cation, Protonated CorannuCorannu-lene, Ion Traps. ||
Dedicated to Prof. Dr. Dr. h.c. mult. Jürgen Troe on the occasion of his 75thbirthday
1 Introduction
Polycyclic aromatic hydrocarbons (PAHs) are important in terrestrial environ-ments as they are produced in combustion processes and lead to soot forma-tion [1]. They are also of astrophysical interest, appearing to play a major role in the interstellar medium (ISM), because of their association with the unidentified infrared (UIR) bands [2]. Presently, more than150molecules have been confirmed to be in the ISM [3,4], mainly by the analysis of pure rotational transistions. How-ever, some species cannot be observed by radio astronomy because of the lack of a permanent electric dipole moment. Astronomical spectra in the IR and visible may be a technique to prove there existence in the ISM. However, no individual molecule is the cause of these IR features. PAH cations and their derivatives have also been proposed as candidates for the diffuse interstellar bands [5,6], though to date, no specific PAH has been identified.
Corannulene,C20H10, is the smallest known PAH adopting a bowl-like struc-ture composed of five pericondensed benzene rings around a central cyclopen-tadienyl unit. It is a highly symmetric molecule, C5v, with a dipole moment of
2.1 D[7]. It has been studied by microwave spectroscopy and its rotational transi-tions were sought using radio astronomy, but without success [8].C20H10 resem-bles a fragment ofC60and could be an intermediate in its formation, given that fullerenes were detected in planetary nebulae [9,10].
Recently, there is a growing interest among organic chemists in functional-izing corannulene [11–14]. Several reactive corannulene carbocationsC20H10-R+ (R= -methyl, -chloromethylene, -dichloromethine, -CCl3 and -CH2CH2Cl, Br) were synthesised in a reaction of corannulene with halogenated hydrocarbons in the presence of Lewis acids [12,15].C20H10-R+were isolated as salts with an-ions in solutan-ions and solids and were characterized by theH/13CNMR and UV-Vis spectroscopy, as well as X-ray diffraction [12,15]. These and theoretical stud-ies [16] revealed thatR+ binds to the inner five-membered ring of corannulene (hub-position), while -CCl3+ prefers the peripheral benzene carbons (rim). The [C20H10-R+,AlCl4−] salts in organic solvents exhibits strong, broad absorptions in the visible range, e.g.C20H10-CH3+at560 nminCDCl3[15]. Though electronic spectra of complexC20H10-R+carbocations have been reported in solution, there
are no data on the simplest systems:C20H10+andC20H11+. These cations have only been measured in the IR using a free electron laser and compared with pla-nar PAHs [17].
Herein, the electronic absorption spectra of protonated corannulene and its neutral radical counterpart, following mass selection and deposition in6 Kneon matrices are presented. The electronic spectrum of protonated corannulene could also be recorded in the gas phase at15 Kusing an ion trap.
2 Methods
2.1 Experimental
Corannulene,C20H10, was synthesised via a solution-phase reaction [18]. Two ex-perimental techniques were employed to obtain the electronic spectra of corannu-lene species. A gas-phase method which uses the confinement capabilities of an ion trap was used for protonated corannulene. The other in the condensed phase utilises a mass selector to embed cations in a6 Kneon matrix.
2.2 6 K neon matrix
The setup employed for mass-selected matrix isolation of ions is described else-where [19]. Cations were produced in a hot cathode discharge source fromC20H10 mixed with helium. Ions were extracted and guided through an electrostatic ben-der to a quadrupole mass selector (QMS). The𝑚/𝑧 = 250 ionspassed through the QMS and were codeposited with a mixture of neon andCH3Cl(in a20 000 : 1 ratio) onto a rhodium-coated sapphire plate held at6 K.CH3Clacts as an elec-tron scavenger, compensating the positive charge. After a≈ 150 μmthick matrix was produced, electronic absorption spectra were measured in the250–1000 nm range by passing broadband radiation through crystalline neon, parallel to the matrix substrate. The light was wavelength-dispersed by a0.3 mspectrograph and detected with a CCD camera. A photobleaching procedure was employed to distinguish absorptions of cations from those of neutrals. The neon matrix was irradiated with UV light from a medium pressure mercury lamp. Electrons from
Cl−, produced fromCH
3Cl, are set free and neutralise positive species. Absorp-tions which decrease upon UV irradiation have a cationic origin, whereas those which gain in intensity are due to uncharged molecules.
Corannulene cation was also generated byAr+bombardment of a neon ma-trix containingC20H10. A charge-exchange reaction yieldsC20H10+, thus the de-sired cation is produced by a gentler ionization than in the source. The excess energy of this reaction is dispersed into vibrational degrees of freedom and then to the6 Kneon environment.
The protonation reaction C20H10+ C2H5OH2+→ C20H11++ C2H5OH was used to produceC20H11+in the same source. The exothermicity of theH+transfer is due to the difference in proton affinities of≈ −70 kJ, mol−1[20].
2.3 22-pole ion trap
Protonated corannulene,C20H11+, was generated by heating solid corannulene to ≈ 340 K, followed by bombardment with 35–40 eV electrons in a toluene atmosphere within a chemical ionization (CI) source. The proton affinity of C7H8 is lower than that of C20H10, leading to the exothermic reaction
C7H9++ C20H10→ C20H11++ C7H8. Other protonated species, such asC7H9+, were also created through ion-molecule reactions.
The apparatus employed has been described [21]. Ions from a CI source were deflected by90∘and injected into a440 mmlong radio frequency (rf)-only
6-pole in order to narrow the kinetic energy distribution of the cations from the CI source by collisions with helium.C20H11+,𝑚/𝑧 = 251, was mass-selected by a quadrupole (± 0.5 u) and electrostatically turned by90∘into an rf-only octupole and then transported into a22-pole rf trap [22], thermalizing cations for≈ 50 ms with6 Khelium buffer gas (one collision per microsecond). This was followed by laser irradiation, extraction and analysis by a second quadrupole.
The dissociation yield ofC20H10+was monitored as a function of laser wave-length to obtain the electronic spectrum ofC20H11+. Radiation from a tunable dye laser (0.07 cm−1bandwidth with≈ 5 mJenergy per pulse) was used to record the rotational contour of the origin band and excited state vibrational transitions. The spectrum was calibrated with an external wavemeter and power corrected.
2.4 Computational
Equilibrium coordinates of the lowest energy C20H10+ and C20H11+ isomers (Chart 1SI and 2SI) and their neutrals were calculated with density functional theory (DFT) using the PBE0 functional [23,24] and cc-pVDZ basis set [25]. For selected isomers the B3LYP functional [26,27] was also applied to compare the results with the literature data obtained with a larger basis set [28]. The
calcu-lations have been carried out with the Gaussian 09 program package [29]. Ver-tical excitation energies of species with a singlet ground state were calculated with time dependent (TDDFT), symmetry-adapted cluster configuration interac-tion (SAC-CI) [30,31] implemented in Gaussiann 09, and multistate multiconfig-urational second-order perturbation (MS-CASPT2) methods [32], the latter uses the Molcas software [33]. For molecules with a doublet multiplicity ground state the two latter methods were used. To obtain dipole-allowed electronic transitions with energy below5 eV, a different number of calculated roots were chosen – the higher the molecular symmetry the smaller number of excited states was calcu-lated. SAC-CI calculations were computed with unrestricted Hartree–Fock (UHF) for singlets and restricted open-shell HF (ROHF) for doublets. About300orbitals with an energy< 3Hartree were exploited. In CASPT2 calculations, state averag-ing was utilised; wavefunctions were optimized for the mean energy of the elec-tronic states computed (usually5–8states depending on symmetry of molecule). An active space was constructed from twelve electrons distributed over twelve or-bitals (12,12) in case of singlets and (11,12) for doublets.
3 Results and discussion
3.1 Corannulene cation and neutral
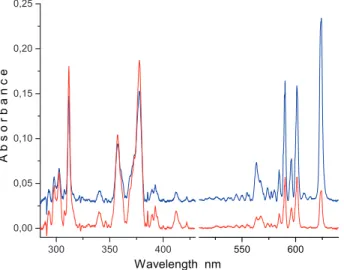
Mass selected deposition ofC20H10+ions (𝑚/𝑧 = 250) in a neon matrix produces the spectrum shown in Figure1(blue trace). Strong absorptions are present in the540–630 nmand290–410 nm regions. The features in the visible dimin-ish, whereas the ones in the UV increase upon irradiation of the matrix with
𝜆 > 260 nmphotons (red trace). This suggests that the former originate from the cationic carrier and the latter belong to a neutral molecule. The prominent band at624.1 nmand the absorption system starting at601.2 nmdecay at a different rate upon UV irradiation; hence, they belong to two cationic species. Scaling the spectra measured after deposition of𝑚/𝑧 = 250cations and after irradiation to the intensity of the624.1 nmband and subtracting each other, a ‘clean’ absorp-tion system with an onset at601.2 nmis obtained (magenta trace of Figure2). Repeating the same procedure when the601.2 nmband is normalized, the ‘clean’
624.1 nmabsorption system is produced (green trace, Figure2). The wavelengths of the band maxima of the two cationic species are collected in Table1.
In another experiment, corannulene (Cora) vapour was trapped in solid neon with concomitant bombardment of the neon surface with a20 nAbeam ofAr+. The spectrum obtained is shown in the black trace of Figure2and is identical with
Figure 1: Electronic absorption spectra recorded after deposition of mass selectedC20H10+ions produced from corannulene vapour in a hot cathode ion source and trapped in a6 K neon matrix (blue trace) and after subsequent irradiation with𝜆 > 260 nm photons (red trace). Absorptions which diminish after UV irradiation originate from cations and those which gain in intensity are due to neutral species.
Figure 2: Absorption spectrum of corannulene cation in a6 K neon matrix (magenta trace) obtained after scaling the spectra shown in Figure1to the intensity of the624 nm band and subtracting the blue trace from the red one. The green trace shows the42A ← 𝑋2A electronic transition of planarC20H10+cation obtained using the same procedure by normalizing to the601.2 nm band. The black trace was obtained after deposition of neutral corannulene in a neon matrix and ionization with argon ion beam.
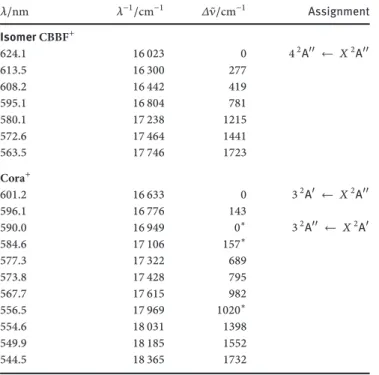
Table 1: Band maxima (± 0.1 nm) in the electronic absorption spectrum of corannulene cation and isomer CBBF+observed in a6 K neon matrix and suggested assignment.
𝜆/nm 𝜆−1/cm−1 𝛥 ̃𝜈/cm−1 Assignment IsomerCBBF+ 624.1 16 023 0 42A ← 𝑋2A 613.5 16 300 277 608.2 16 442 419 595.1 16 804 781 580.1 17 238 1215 572.6 17 464 1441 563.5 17 746 1723 Cora+ 601.2 16 633 0 32A ← 𝑋2A 596.1 16 776 143 590.0 16 949 0∗ 32A ← 𝑋2A 584.6 17 106 157∗ 577.3 17 322 689 573.8 17 428 795 567.7 17 615 982 556.5 17 969 1020∗ 554.6 18 031 1398 549.9 18 185 1552 544.5 18 365 1732
∗bands belong to the590 nm system of Cora+
the601.2 nmabsorption system. The strong band at624.1 nmand the weaker ones that belong to this system are absent in the spectrum. The experiment proves that two cationic species are present in the matrix after trapping mass selected
C20H10+. The601.2 nmabsorption system corresponds to the electronic transi-tion of Cora+because the cations are formed under milder conditions than in the ion source, i.e. via a charge-exchange reaction of Cora withAr+, where the excess energy is dissipated to a neon lattice. The absorption system starting at624.1 nm likely belongs to a higher energy isomer ofC20H10+, formed in the ion source or during trapping into solid neon.
Neutral coranulene (Cora) was deposited in a neon matrix and the spec-trum obtained is the magenta trace of Figure3. Absorptions were detected in the
340–420 nmrange. Below340 nmthe matrix was not transparent due to light scattering or strongly absorbing species. Cora was studied previously in an argon matrix. An intense feature is seen at249.5 nmand two weaker systems around
opti-Figure 3: Electronic absorption spectrum of neutral corannulene (magenta trace) measured after deposition of the neutral corannulene in a6 K neon matrix. Green trace shows the absorption spectrum of planarC20H10obtained after deposition of mass selectedC20H10+and subsequent UV irradiation.
cal transitions of the21E1,11E1and11A1excited states from the𝑋1A1ground state of Cora, based on TD DFT calculations. There are also three lower energy electronic states,11A2,11E2and21E2at3.53,3.56, and3.83 eV, which are not dipole accessible from the ground state. Absorptions detected in the present study are in the range where forbidden transitions are expected. The detection system used here is about two orders of magnitude more sensitive than that in the pre-vious study [28] due to a longer path length,≈ 20 mm, compared to a fraction of a mm in traditional matrix isolation. The high sensitivity enables the detection of weak transitions. Moreover, symmetry forbidden transitions in the gas phase can become allowed in the matrix due to perturbations by the neon environment.
Vertical excitation energies of Cora were calculated with the TDDFT, SAC-CI and MS(8)-CASPT2 (12,12) methods. TDDFT give the same results [28] though a larger basis set (cc-pVTZ) was used in the latter. The excitation energies calcu-lated with three methods are presented in Table2. TDDFT and SAC-CI give a sim-ilar order of excited states except that the 11A2 and11E2 states are reversed. CASPT2 calculations have been carried out in Cssymmetry, and as a result the formerly forbidden transitions become allowed with low oscillator strengths. The vertical excitation energies calculated with the three methods agree with the neon matrix transitions of Cora.
After irradiating the matrix with𝜆 > 260 nmphotons, the absorption spec-trum of neutral species produced from electron recombination is obtained
(Fig-Table 2: Vertical excitation energies ineV and oscillator strengths of the electronic transitions of neutral isomers ofC20H10. Cora and CBBF calculated with the TDDFT, SAC-CI, and CASPT2 using the equilibrium coordinates obtained from DFT/PBE0.
Cora CBBF
State TDDFT SAC-CI CASPT2 TDDFT SAC-CI CASPT2
11A 3.62 0.0 3.72 0.0 3.92 0.001 2.66 0.004 2.53 0.01 3.19 0.03 21A 3.66 0.0 3.72 0.0 3.93 0.001 3.15 0.04 3.04 0.05 3.66 0.06 31A 3.66 0.0 3.81 0.0 4.17 0.02 3.35 0.001 3.60 0.006 3.96 0.02 41A 3.93 0.0 4.15 0.0 4.35 0.04 3.69 0.007 3.84 0.03 4.31 0.03 51A 3.93 0.0 4.16 0.0 4.45 0.1 3.88 0.05 4.17 0.2 4.75 0.04 61A 4.16 0.01 4.47 0.03 4.68 0.04 4.04 0.03 4.37 0.09 4.79 0.002 71A 4.48 0.3 4.74 0.3 4.80 0.3 4.19 0.06 4.66 0.2 5.30 0.04 81A 4.48 0.3 4.76 0.3 5.05 0.1 4.28 0.1 4.78 0.1 91A 5.42 0.3 5.68 1 5.90 0.3 4.62 0.7 4.93 0.9 101A 5.42 0.3 5.70 1 6.11 0.3 4.75 0.1 5.42 0.4
ure3, green trace). The neon lattice efficiently quenches the excitation energy during neutralization of cations; therefore, the structure of the molecular ion is retained upon charge cancellation. The bands of Cora are barely observable, sug-gesting that the oscillator strengths of the601.2and590.0 nmsystems of Cora+ are stronger than the one of the forbidden transition of Cora in the340–420 nm range. The new absorptions detected in the same spectral region as that of Cora (magenta trace) belong to the neutral counterpart of the other cation responsible for the624 nmsystem.
Two absorption bands at 601.2 and 590.0 nm dominate the spectrum of Cora+. The590.0 nmband lies316 cm−1above onset of the system. Cora+ pos-sesses several low frequency vibrations. DFT calculations, using B3LYP functional and cc-pVDZ basis set, predict two normal modes of energy295and305 cm−1 (Table 1SI) close to the value316 cm−1derived from the spectrum. However, the relative intensities of these two bands in the spectrum of Cora+suggest that the overtone of316 cm−1around579 nmshould also be detected in contrast to the ob-servation. Therefore, the601.2and590.0 nmabsorptions belong to two different electronic systems. Two weaker bands≈ 150 cm−1above each origin are present in the spectrum shown in magenta in Figure2. This energy is close to the143 cm−1 ground state frequency of Cora+calculated with the DFT method. The other pair of bands≈ 1000 cm−1above the origins is also observed in Figure2.
To deduce whether these two systems are two electronic transitions of Cora+, or belong to two structures of the cation, calculations of the excitation energies have been carried out with the SAC-CI and MS(8)-CASPT2 (11,12) methods us-ing the DFT/PBE0 coordinates. Vertical excitation energies of Cora+obtained in
Table 3: Vertical excitation energies ineV and oscillator strengths of the electronic transitions of Cora+and CBBF+calculated with SAC-CI and MS(8)-CASPT2 (11,12) using geometries from DFT/PBE0.
Cora+𝑋2A CBBF+𝑋2A
State SAC-CI CASPT2 SAC-CI CASPT2
12A 0.44 0.001 0.46 0.01 1.04 0.003 1.09 0.03 22A 2.84 0.001 2.68 0.002 1.47 0.007 1.63 0.004 32A 3.51 0.002 3.53 0.007 1.82 0.03 1.90 0.05 42A 3.68 0.004 3.94 0.1 2.87 0.09 1.97 0.05 52A 4.74 0.005 4.15 0.02 3.80 0.01 2.76 0.06 62A 5.66 0.0 4.35 0.001 4.51 0.001 3.25 0.04 72A 5.45 0.06 3.33 0.06 12A 0.36 0.001 0.34 0.02 22A 0.48 0.0 0.95 0.004 32A 2.78 0.2 2.24 0.2 42A 3.03 0.007 2.59 0.02 52A 3.51 0.001 3.55 0.06 62A 3.94 0.0 3.62 0.04 72A 5.03 0.0 4.21 0.05
these calculations are compared in Table3. Both calculations predict a strong
32A ← 𝑋2A electronic transition of Cora+ in the visible region: CASPT2 at
2.24 eV and SAC-CI at2.78 eV, which can be compared with the experimental value2.06 eV. There is no other intense transition around this energy. The other intense42A ← 𝑋2Atransition is predicted at3.94 eVby CASPT2, which was not detected in this experiment, and the large oscillator strength,𝑓 = 0.12, can be an artefact of the method. The CASPT2 diagnostic tools indicate that the ac-tive space used (11,12), is too small to accurately describe higher excited states of Cora+due to a number of low energy occupied orbitals in the cation. In the case of SAC-CI calculations,≈ 300 orbitalswere used and the results obtained are more reliable, though the excitation energies are overestimated by≈ 0.7 eV.
Because only one strong transition is predicted in the visible range, the601.2 and590 nmsystems are due to different structures of Cora+. Neutral corannu-lene has C5vsymmetry and an𝑒2HOMO. Upon ionization, the degeneracy of the
𝑒2orbitals is removed by a Jahn–Teller (JT) distortion in the𝑋2E2ground state. The C5vgeometric structure is compressed or elongated with respect to the𝜎v mir-ror plane, resulting in an electronic ground state of either2Aor2Asymmetry.
C20H10+ has five C
sminima located around the C5vJT conical intersection. The barrier between the minima has been estimated to be18 cm−1inC20H10−, via ESR spectroscopy [35]. The computed energy barrier forC20H10+using a DFT method
is6 cm−1[17]. Therefore, the pseudo-rotation inC20H10− would be expected in
C20H10+as well, resulting in a dynamic JT effect. Because the barrier is low, two forms (Aand A) of Cora+are trapped in the matrix and the601.2and590 nm ab-sorption systems are assigned to the32A← 𝑋2Aand32A← 𝑋2Aelectronic transitions of these JT distorted structures.
The carrier of the prominent 624 nm absorption system is an isomer of
C20H10+ which is produced in the ion source, or during deposition, at energies of≈ 50 eV. If a fragment is responsible for the624 nmband, the most plausible candidate isC20H9+, formed by a cleavage of theC−Hbond. Vertical excitation energies ofC20H9+were calculated with TDDFT, SAC-CI, and MS(8)-CASPT2 and for neutralC20H9using the latter two methods. The results are shown in Table 2SI.
C20H9+andC
20H9possess weak electronic transitions which do not match nei-ther the624 nmnor the UV systems.
A candidate for the624 nmabsorption is another isomer ofC20H10+. One is
A+, benzo[ghi]fluoranthene cation with an ethynyl group attached, and can be formed by cleavage of one benzene ring of Cora+. The realitive energy is predicted
125 kJ, mol−1above Cora+at the DFT/PBE0 level. The excitation energies ofA+ and A calculated in similar manner, as in the case ofC20H90/+, are shown in Ta-ble 3SI. They do not correlate with the observations.
Three other isomers (B+− D+) ofC20H10+ were also considered as carriers of the624 nm system (Chart 1SI). B+, C+, andD+, fluoranthene cations with two ethynyl groups, can be produced from Cora+ by cleavage of two benzene rings. They lie≈ 300 kJ, mol−1above Cora+. Excitation energies of these isomers were calculated with SAC-CI and CASPT2 and results are given in Tables 4SI. The strongest, lowest energy transitions of these cations are predicted in the near in-frared at1.2–1.5 eV– far from the observation (1.99 eV); therefore, the624 nm system does not originate from these cations.
Isomer CBBF+(Chart 1SI) is91 kJ, mol−1above Cora+in energy, having a sim-ilar structure toA+. The geometry ofA+ has an ethynyl group, forming a four member carbon ring with an adjacent benzene ring and migration of one hydro-gen atom. SAC-CI calculations predict a moderately intense (𝑓 = 0.089) electronic transition for this cation2.86 eV close to the predicted2.87 eV for Cora+ with this method (Table3). MS(8)-CASPT2 (11,12) calculations predict three moder-ately intense transitions in the1.90–2.76 eVenergy range close to the observa-tion at1.99 eV(624 nm). However, due to a small active space limited by com-putational reasons, and a number of low energy occupied orbitals of CBBF+, the CASPT2 results give a crude approximation of the energy levels of the cation. Ver-tical excitation energies of neutral CBBF using the TDDFT, SAC-CI, and MS(8)-CASPT2 (Table2) revealed that this is the only structure which can be responsible for the absorptions detected in the310–400 nmrange after deposition of
mass-selectedC20H10+ in a neon matrix (Figure3). The most prominent absorptions are observed at around313,358, and378 nm–3.96,3.46, and3.28 eV, respec-tively, which are close to moderately intense electronic transitions of CBBF at4.17,
3.84, and3.04 eVpredicted by SAC-CI and at3.96,3.64and3.19 eVaccording to CASPT2. Therefore, the624 nmband system is assigned to the42A ← 𝑋2A electronic transition of CBBF+and the UV absorptions at313,358, and378 nmto the4,3,21A ← 𝑋1A, respectively.
3.2 Protonated corannulene
3.2.1 6 K neon matrix
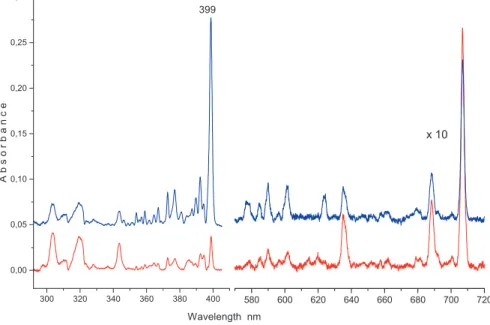
Deposition of𝑚/𝑧 = 251 cationsproduced in the reaction of Cora withEtOH2+ resulted in strong absorptions starting at398.8 nmand an order of magnitude weaker system at707.0 nm(Figure4, blue trace). The399 nmsystem diminishes while the one at707 nmgains in intensity after irradiation𝜆 > 260 nmof the matrix (red trace), pointing to a cationic carrier of the former and neutral for the latter. Weak absorptions of Cora+at624.1,601.2, and590.0 nmoverlap with
Figure 4: Electronic absorption spectra recorded after deposition of mass selectedC20H11+in a6 K neon matrix (blue trace) and after neutralization of ions with 𝜆 > 260 nm photons (red trace).
the707 nmsystem. These are present either because the13Cisotopologue has the same mass as protonated corannulene (HCora+), or are due to an insuffi-cient mass resolution. The399and707 nmsystems are unique for deposition of
𝑚/𝑧 = 251 ions. A number of protonated PAHs (of naphthalene [36], anthracene, phenanthrene [37], pyrene and coronene [38]) were produced in a similar fashion; therefore, the new399 nmabsorption system is assigned to HCora+. The absorp-tions starting at707 nmare of HCora.
Corannulene possesses three energetically non-equivalent protonation sites:
hub, rim, and spoke (Chart 2SI). According to DTF/PBE0 andri-MP2 calculations, the lowest energyC20H11+structure is thehub-isomer. The next in energy, rim, is located7and20 kJ, mol−1abovehub by these methods. The relative energies of protonated corannulenes shown in Chart 2SI agree well with the ones calculated using the larger cc-pVTZ basis set [16].
Vertical excitation energies of the three isomers of HCora+were calculated with TDDFT, SAC-CI, and the second-order approximated coupled cluster (CC2) method implemented in Turbomole [34]. The equilibrium coordinates obtained from the to DTF/PBE0 andri-MP2 calculations were used. The excitation ener-gies and the oscillator strengths ofhub- and rim-HCora+are given in Table4and forspoke in Table 5SI, because it is less likely produced in the source. It can be expected that bothhub and rim structures ofC20H11+ should be present in the matrix, as was observed for other protonated PAHs [37,38] when the ground state energies of isomers do not differ much.
All the methods predict two strong electronic transitions with𝑓 > 0.1to the
11Aand31Aexcited electronic states ofhub cation in the energy range below
4 eV. The11Astate is predicted to be1.8–2.7 eVabove𝑋1Adepending on the method used (Table4). The calculations locate the31Astate3.6–4.0 eVabove
𝑋1A. Computations at the same level of theory onrim-C
20H11+also predict two strong electronic transitions in the energy range below4 eV. The transition is pre-dicted at the31A excited state, lying in a similar energy range (1.9–2.6 eV) to the
11Astate of thehub-isomer. The next one is found at the41A excited state located at3.0–3.5 eVabove the𝑋1A one (Table4).
The electronic spectrum measured following mass-selective deposition of
𝑚/𝑧 = 251 ionsin a neon matrix is dominated by the strong absorption system (Figure4) commencing at≈ 399 nm(3.10 eV). A weak, broad, cationic feature is observed in a neon matrix at≈ 515 nm, not shown in Figure4. Corannulene cation substituted with a methyl, chloromethyl, di- and tri-chloromethyl groups were in-vestigated in solutions with an absorption at≈ 588 nminC6D6[15]. The wave-length of the absorption is far from the present observation for HCora+, but quite close to the origin of Cora+ in a neon matrix (601.2 nm). This suggests that the substitution of corannulene cation with a methyl or chloromethyl group slightly
Table 4: Excitation energies ineV and oscillator strengths of hub- and rim-isomers of HCora+ calculated with TDDFT, SAC-CI, and CC2 methods using ground state equilibrium structures obtained from DFT/PBE0 and ri-MP2.
hub-𝑋1A
TDDFT/PBE0 SAC-CI/PBE0 SAC-CI/MP2 CC2/MP2
11A 2.67 0.09 1.80 0.1 1.77 0.1 2.53 0.1 21A 3.74 0.03 3.34 0.05 3.22 0.04 3.61 0.06 31A 3.89 0.02 3.52 0.01 3.56 0.005 3.90 0.005 41A 4.22 0.2 3.94 0.3 3.80 0.3 4.13 0.3 51A 4.45 0.03 4.28 0.004 4.21 0.004 4.27 0.004 11A 2.32 0.004 1.75 0.03 1.77 0.06 2.35 0.02 21A 2.66 0.05 1.82 0.04 1.79 0.0 2.54 0.05 31A 3.96 0.2 3.82 0.2 3.57 0.2 3.88 0.2 41A 4.66 0.0 4.47 0.04 4.61 0.05 4.57 0.02 51A 4.80 0.04 5.00 0.5 4.78 0.05 rim-𝑋1A
TDDFT/PBE0 SAC-CI/PBE0 SAC-CI/MP2 CC2/MP2
11A 1.88 0.003 1.19 0.003 1.15 0.003 1.78 0.007 21A 2.14 0.007 1.54 0.01 1.46 0.01 2.11 0.01 31A 2.60 0.09 1.94 0.08 1.88 0.08 2.46 0.1 41A 3.47 0.1 3.03 0.2 3.01 0.2 3.37 0.2 51A 3.78 0.02 3.64 0.02 3.50 0.02 3.81 0.03 61A 4.00 0.06 3.95 0.09 3.83 0.1 4.09 0.06 71A 4.30 0.01 4.29 0.03 4.18 0.04 4.31 0.006 81A 4.32 0.02 4.36 0.05 4.24 0.05 4.35 0.02
perturbs the energy levels of Cora+. A similar regularity was observed for diacety-lene [39] and triacetylene cations [40] substituted withCH3, where the origin of the first electronic transition is blue shifted by≈ 16and2 nm, respectively, in comparison to unsubstituted cations. Addition of a hydrogen atom to polyacety-lene cations greatly changes the electronic structure. The wavelength of the elec-tronic transition, e.g. triacetylene cation is blue shifted by≈ 226 nmunder pro-tonation [39]. A similar trend is also observed for Cora+ and HCora+where the wavelengths of the origins differ by≈ 200 nm.
Though thehub- and rim-structures of HCora+have similar ground state en-ergies (Chart 2) only one isomer is observed in a neon matrix. The calculated exci-tation energies ofrim-HCora+are in agreement with the origin at399 nm; there-fore, this band system is assigned to the41A ← 𝑋1A electronic transition of this cation. The strongest feature is the origin band, and a distinct vibrational struc-ture is apparent in the spectrum (Figure4). Due to the low symmetry, excitation of all87normal modes is allowed; therefore, no specific vibrational assignment
of the absorption bands has been made. One of the strongest features in the spec-trum of HCora+ above the origin is the1450 cm−1band. This is most probably due to a scissor-like vibration of theCH2group with a characteristic frequency of
1465 cm−1[41].
Calculations (Table4) predict another strong transition ofrim-HCora+in the
1.9–2.6 eVenergy range. At515 nm(2.41 eV) a weak, broad, cationic feature is observed in a neon matrix (not shown in Figure4). This absorption is assigned to the31A ← 𝑋1A electronic transition ofrim-HCora+.
Because the absorptions ofrim-HCora+were detected in a neon matrix, the features which gain intensity after neutralization of the cations belong to neutral hydrogenated corannulene. These are: the707.0 nmsystem and absorptions at
385.4, 343.6,319.3,303.7 nm(Table5). To assign them to a specific electronic transition, SAC-CI and MS(8)-CASPT2 (11,12) calculations have been carried out. The excitation energies of HCora are given in Table6. According to SAC-CI the first electronic transition is at2.94 eVwith𝑓 = 0.004, which can be compared with the
1.75 eV(707 nm) experimental value. An error of≈ 1.20 eVis too large for these calculations to be used for an assignment of the HCora spectrum. The lowest en-ergy transition,12A ← 𝑋2A, calculated with CASPT2 is at2.20 eVwith𝑓 = 0.01, close to the observed absorption, and the adiabatic excitation energy should be
≈ 0.5 eVlower. The calculations predict several electronic transitions in the UV where absorptions of HCora were detected and assignments are given in Table5.
3.2.2 Gas phase at 15 K
HCora+, produced in reactions of protonated toluene with Cora within the source, was studied in the gas phase at15 Kby observing theC20H10+yield from pho-todissociation. The31A excited state lies below the ≈ 2.5 eV thermodynamic threshold forHloss. Therefore, one photon promotesC20H11+to a level of the
31A state and the second into the fragmentation continuum. A weak electronic transition around520 nmand a much stronger one commencing at396.55 nm were detected (Table5). The520 nmfeature is broad and no vibrational structure in the31A ← 𝑋1A electronic transition is discernible. The fwhm of this absorp-tion points to a≈ 5 fslifetime in the31A state.
The397 nmsystem is compared with the spectrum ofrim-HCora+measured in a6 Kneon matrix (Figure5). The origin of the41A ← 𝑋1A electronic transi-tion in the gas phase is blue shifted by≈ 140 cm−1with respect to the position in a neon matrix. The gas-phase to matrix shift is within the expected1%energy range of the electronic transition [42]. Excess excitation energy of41A was suffi-cient for photodissociation; however, two photons were absorbed so thatC20H10+
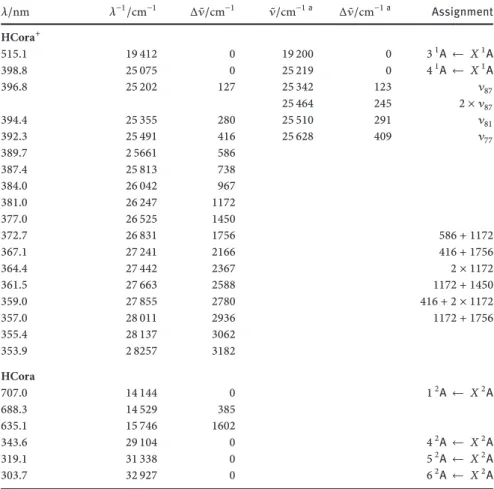
Table 5: Observed band maxima in the3,41A ← 𝑋1A electronic transitions of protonated corannulene in a6 K neon matrix and the gas phase at 15 K. The absorptions in the
1,4,5,62A← 𝑋2A electronic transitions of hydrogenated corannulene in a6 K neon matrix are also presented. 𝜆/nm 𝜆−1/cm−1 Δ ̃𝜈/cm−1 ̃𝜈/cm−1 a Δ ̃𝜈/cm−1 a Assignment HCora+ 515.1 19 412 0 19 200 0 31A ← 𝑋1A 398.8 25 075 0 25 219 0 41A ← 𝑋1A 396.8 25 202 127 25 342 123 𝜈87 25 464 245 2 × 𝜈87 394.4 25 355 280 25 510 291 𝜈81 392.3 25 491 416 25 628 409 𝜈77 389.7 2 5661 586 387.4 25 813 738 384.0 26 042 967 381.0 26 247 1172 377.0 26 525 1450 372.7 26 831 1756 586 + 1172 367.1 27 241 2166 416 + 1756 364.4 27 442 2367 2 × 1172 361.5 27 663 2588 1172 + 1450 359.0 27 855 2780 416 + 2 × 1172 357.0 28 011 2936 1172 + 1756 355.4 28 137 3062 353.9 2 8257 3182 HCora 707.0 14 144 0 12A ← 𝑋2A 688.3 14 529 385 635.1 15 746 1602 343.6 29 104 0 42A ← 𝑋2A 319.1 31 338 0 52A ← 𝑋2A 303.7 32 927 0 62A ← 𝑋2A agas-phase values
was detectable on a microsecond timescale. The origin band of the41A ← 𝑋1A electronic transition ofC20H11+was scanned with a dye laser; however, no rota-tional structure was apparent. The width of the origin band points to a≈ 0.2 ps lifetime in the41A state.
Well-resolved vibrational structure is seen for the41A ← 𝑋1A electronic transition ofC20H11+ in the gas phase. The next most intense absorption lies
123 cm−1to higher energy of the origin band. In the matrix spectrum, a weak shoulder127 cm−1to the blue of the origin is present. This band is assigned to
Table 6: Excitation energies ineV and oscillator strengths of rim-HCora calculated with SAC-CI and MS(8)-CASPT2 (11,12) using equilibrium coordinates obtained from DFT/PBE0.
CASPT2 SAC-CI 𝑋2A 𝑋2A 12A 2.20 0.01 12A 2.94 0.004 22A 2.53 0.004 22A 3.25 0.01 32A 2.75 0.003 32A 3.36 0.01 42A 2.93 0.06 42A 4.27 0.04 52A 3.15 0.03 52A 5.45 0.04 62A 4.12 0.007 62A 5.51 0.02 72A 4.28 0.002
Figure 5: The41A← 𝑋1A electronic transition of protonated coranulene detected in a6 K neon matrix (black trace) and the spectrum in the gas phase at15 K (red trace).
theCH2rocking mode𝜈87of the protonation site on the basis of the vibrational frequencies calculated with the DFT method (Table 1SI). The calculated energy of this mode is127 cm−1. This excited-state frequency of𝜈87is more than double in protonated pyrene and coronene for a similar nuclear motion [43,44]. This is due to the tertiary structure ofC20H11+. Double quanta excitation of𝜈87 in the41A state is also observed at 25464 cm−1. The𝜈87,2𝜈87,𝜈81and𝜈77vibronic bands in the41A excited state have50–90%of the intensity of the origin and are stronger than these observed in the neon matrix. This reflects a dependence of the dissoci-ation rate on the excess excitdissoci-ation energy supplied to the cdissoci-ation.
Photofragmen-tation takes place from an highly excited vibration in the ground state of HCora+ and leads to the formation of Cora+and H. This is similar for protonated pyrene and coronene [43,44]. The band maxima of the41A ← 𝑋1A transition are given in Table5.
4 Concluding remarks
Three structural forms of C20H10+: cyclobutadieno-benzo[ghi]fluoranthene cation (CBBF+) and two J-T distorted Cora+ structures were detected in a6 K neon matrix following deposition of𝑚/𝑧 = 250 ions. Cora+ was also produced via a charge-exchange reaction of Ar+ with neutral corannulene and only the latter two structures were detected. The absorptions of C20H10+ at624.1,
601.2, and590.0 nmwere assigned to the42A ← 𝑋2A,32A ← 𝑋2A, and
32A ← 𝑋2A electronic transitions of CBBF+ and bowl-shaped Cora+ struc-tures, respectively, based on calculated excitation energies.
Protonated and hydrogenated Cora were studied in a6 Kneon matrix and the former also in the gas phase at15 Kin an ion trap via two-photon disso-ciation. Corannulene possesses three energetically non-equivalent protonation sites:hub, rim, and spoke. The former is the lowest energy isomer of C20H11+ and a structure lies slightly higher in energy. Excitation energies of
rim-C20H11+, calculated with TDDFT, SAC-CI, and CC2 methods, are in better agree-ment with the observed electronic spectrum than that of the hub-isomer. The strong, well-structured absorptions starting at around399 nm are assigned to the41A ← 𝑋1A transition ofrim-HCora+. HCora+is the second largest PAH sys-tem after protonated coronene [38] for which an electronic absorption spectrum has been measured. In contrast to protonated pyrene and coronene, the strongest electronic transition of HCora+falls in the long-wavelength UV range, where DIBs have not yet been detected. Among the three H-PAHs+, the487 nmband system of HPyr+ is the most intense. That of HCor+at696 nmis two times less intense compared to HPyr+, while that of HCora+at399 nmis about ten times weaker. All transitions were normalized to the same deposited charge within the matrix.
Acknowledgement: This work was supported by the European Research
Coun-cil (ERC-AdG-ElecSpecIons:246998) and the Swiss National Science Foundation (Project No. 200020-124349/1). The Siegel Group, especially A. Butterfield, is thanked for the sample preparation.
References
1. C. Jäger, F. Huisken, H. Mutschke, I. L. Jansa, and T. Henning, Astrophys. J.696 (2009) 706. 2. A. Pathak and S. Rastogi, Astron. Astrophys.485 (2008) 735.
3. P. Thaddeus, Philos. T. R. Soc. B361 (2006) 1681.
4. http://www.astro.uni-koeln.de/cdms/molecules(cited March 12, 2015). 5. T. P. Snow and, V. M. Bierbaum, Annu. Rev. Anal. Chem.1 (2008) 229. 6. A. Tielens, Annu. Rev. Astron. Astr.46 (2008) 289.
7. F. J. Lovas, R. J. McMahon, J.-U. Grabow, M. Schnell, J. Mack, L. T. Scott, and R. L. Kuczkowski, J. Am. Chem. Soc.127 (2005) 4345.
8. P. Pilleri, D. Herberth, T. F. Giesen, M. Gerin, C. Joblin, G. Mulas, G. Malloci, J.-U. Grabow, S. Brünken, L. Surin, B. D. Steinberg, K. R. Curtis, and L. T. Scott, Mon. Not. R. Astron. Soc. 397 (2009) 1053.
9. J. Cami, J. Bernard-Salas, E. Peeters, and S. E. Malek, Science329 (2010) 1180. 10. O. Berné and A. G. G. M. Tielens, P. Natl. Acad. Sci. USA109 (2012) 401.
11. L. T. Scott, H. E. Bronstein, D. V. Preda, R. B. M. Ansems, M. S. Bratcher, and S. Hagen, Pure Appl. Chem.71 (1999) 209.
12. A. V. Zabula, S. N. Spisak, A. S. Filatov, A. Y. Rogachev, and M. A. Petrukhina, Angew. Chem. Int. Ed.50 (2011) 2971.
13. S. N. Spisak, A. V. Zabula, A. S. Filatov, A. Y. Rogachev, and M. A. Petrukhina, Angew. Chem. 123 (2011) 8240.
14. M. Juríček, N. L. Strutt, J. C. Barnes, A. M. Butterfield, E. J. Dale, K. K. Baldridge, J. F. Stod-dart, and J. S. Siegel, Nat. Chem.6 (2014) 222.
15. C. Dubceac, A. V. Zabula, A. S. Filatov, F. Rossi, P. Zanello, and M. A. Petrukhina, J. Phys. Org. Chem.25 (2012) 553.
16. A. Y. Rogachev, A. S. Filatov, A. V. Zabula, and M. A. Petrukhina, Phys. Chem. Chem. Phys. 14 (2012) 3554.
17. H. A. Galué, C. A. Rice, J. D. Steill, and J. Oomens, J. Chem. Phys.134 (2011) 054310. 18. J. Seiders, E. L. Elliott, G. H. Grube, and J. S. Siegel, J. Am. Chem. Soc.121 (1999) 7804. 19. P. Freivogel, J. Fulara, D. Lessen, D. Forney, and J. P. Maier, Chem. Phys.189 (1994) 335. 20. E. P. L. Hunter and S. G. Lias, J. Phys. Chem. Ref. Data27 (1998) 413.
21. F.-X. Hardy, C. A. Rice, O. Gause, and J. P. Maier, J. Phys. Chem. A119 (2014) 1568. 22. D. Gerlich, Adv. Chem. Phys.82 (1992) 1.
23. J. P. Perdew, K. Burke, and M. Ernzerhof, Phys. Rev. Lett.77 (1996) 3865. 24. J. P. Perdew, K. Burke, and M. Ernzerhof, Phys. Rev. Lett.78 (1997) 1396. 25. J. Dunning and T. H., J. Chem. Phys.90 (1989) 1007.
26. A. D. Becke, J. Chem. Phys.98 (1993) 5648.
27. C. Lee, W. Yang, and R. G. Parr, Phys. Rev. B37 (1988) 785.
28. G. Rouillé, C. Jäger, M. Steglich, F. Huisken, T. Henning, G. Theumer, I. Bauer, and H.-J. Knölker, ChemPhysChem9 (2008) 2085.
29. M. J. Frisch, G. W. Trucks, H. B. Schlegel, G. E. Scuseria, M. A. Robb, J. R. Cheeseman, G. Scalmani, V. Barone, B. Mennucci, G. A. Petersson, H. Nakatsuji, M. Caricato, X. Li, H. P. Hratchian, A. F. Izmaylov, J. Bloino, G. Zheng, J. L. Sonnenberg, M. Hada, M. Ehara, K. Toyota, R. Fukuda, J. Hasegawa, M. Ishida, T. Nakajima, Y. Honda, O. Kitao, H. Nakai, T. Vreven, J. A. Montgomery Jr., J. E. Peralta, F. Ogliaro, M. Bearpark, J. J. Heyd, E. Broth-ers, K. N. Kudin, V. N. Staroverov, R. Kobayashi, J. Normand, K. Raghavachari, A. Rendell,
J. C. Burant, S. S. Iyengar, J. Tomasi, M. Cossi, N. Rega, J. M. Millam, M. Klene, J. E. Knox, J. B. Cross, V. Bakken, C. Adamo, J. Jaramillo, R. Gomperts, R. E. Stratmann, O. Yazyev, A. J. Austin, R. Cammi, C. Pomelli, J. W. Ochterski, R. L. Martin, K. Morokuma, V. G. Zakrzewski, G. A. Voth, P. Salvador, J. J. Dannenberg, S. Dapprich, A. D. Daniels, Ö. Farkas, J. B. Fores-man, J. V. Ortiz, J. Cioslowski, and D. J. Fox, Gaussian 09 Revision D.01, Gaussian Inc., Wallingford CT (2009).
30. H. Nakatsuji and K. Hirao, J. Chem. Phys.68 (1978) 2053. 31. H. Nakatsuji, Chem. Phys. Lett.67 (1979) 329.
32. J. Finley, P. Malmqvist, B. O. Roos, and L. Serrano-Andrés, Chem. Phys. Lett.288 (1998) 299.
33. F. Aquilante, L. De Vico, N. Ferré, G. Ghigo, P. Malmqvist, P. Neogrády, T. B. Pederson, M. Pitoňák, M. Reiher, B. O. Roos, L. Serrano-Andrés, M. Urban, V. Veryazov and R. Lindh, J. Comput. Chem.31 (2010) 224.
34. R. Ahlrichs, M. Bar, M. Haser, H. Horn, and C. Kolmel, Chem. Phys. Lett.162 (1989) 165. 35. T. Sato, A. Yamamoto, and H. Tanaka, Chem. Phys. Lett.326 (2000) 573.
36. I. Garkusha, A. Nagy, J. Fulara, M. F. Rode, A. L. Sobolewski, and J. P. Maier, J. Phys. Chem. A117 (2013) 351.
37. I. Garkusha, J. Fulara, A. Nagy, and J. P. Maier, Astrophys. J.728 (2011) 131. 38. I. Garkusha, J. Fulara, P. J. Sarre, and J. P. Maier, J. Phys. Chem. A115 (2011) 10972. 39. J. P. Maier, O. Marthaler, and E. Kloster-Jensen, J. Chem. Phys.72 (1980) 701. 40. A. Chakraborty, J. Fulara, and J. P. Maier, Aust. J. Chem.67 (2013) 416.
41. D. Lin-Vien, N. B. Colthup, W. G. Fateley, and J. G. Grasselli, The Handbook of Infrared and
Raman Characteristic Frequencies of Organic Molecules, Elsevier, San Diego (1991).
42. M. E. Jacox, J. Phys. Chem. Ref. Data27 (1998) 115.
43. F.-X. Hardy, O. Gause, C. A. Rice, and J. P. Maier, Astrophys. J. Lett.778 (2013) L30. 44. C. A. Rice, F.-X. Hardy, O. Gause, and J. P. Maier, J. Phys. Chem. Lett.5 (2014) 942.
||
Supplementary material: The online version of this article