Bulletin suisse de linguistique appliquée © 2018 Centre de linguistique appliquée No 107, 2018, 97-112 • ISSN 1023-2044 Université de Neuchâtel
EMI lecture quality parameters: the student
perspective
Curtis GAUTSCHI
ZHAW Zürcher Hochschule für Angewandte Wissenschaften Gertrudstrasse 15, 8400 Winterthur, Switzerland
La capacità dei docenti di gestire lezioni nei quali la lingua di insegnamento è l'inglese (English-medium Instruction: EMI) è una componente chiave per la garanzia della qualità dei programmi internazionali universitari. Un metodo per valutare la preparazione dei docenti in questo senso è l'osservazione e la valutazione degli stessi da parte di esperti specificamente formati in materia. Tuttavia, in quanto soggetti centrali in tema di istruzione, le prospettive degli studenti sono anch'esse una componente essenziale nella valutazione delle competenze dei docenti. Questo studio esamina le valutazioni degli studenti con due obiettivi. Il primo è quello di convalidare i criteri utilizzati nella valutazione della qualità delle lezioni EMI da parte di esperti. I parametri di qualità in questione sono stati sviluppati nell'ambito del progetto "Internationalisation of Universities of Applied Sciences" (ved. anche Studer questo numero). Il secondo obiettivo è quello di sviluppare un pool di elementi per questionari di feedback ad uso degli studenti, da utilizzare in contesti EMI. I dati studente-specifici supportano l'inclusione di criteri di valutazione in senso linguistico, communicativo e didattico sia per la valutazione da parte da esperti che per gli strumenti di feedback degli studenti.
Parole chiave:
Feedback degli studenti, garanzia della qualità, istruzione terziaria, convalida delle valutazioni, inglese come lingua di insegnamento.
Keywords:
Student feedback, quality assurance, internationalisation in higher education, assessment validation, English-medium instruction.
1. Introduction
Fluent English proficiency is clearly a requirement when lecturing through the medium of English. Several specific facets of language competence have been noted as indicators of EMI lecturing competence. For instance, Schaller-Schwaner (2005) postulate that a minimal vocabulary range in technical language should be a prerequisite for foreign language subject teaching. Londo (2011: 97) also reports that lecturers cite limited vocabulary and language problems as challenges in EMI. It is, therefore, not surprising that some quality assurance approaches to EMI focus primarily on linguistic competence, as measured by recognised foreign language general proficiency assessment (e.g., TOEFL) or tests of English for Academic Purposes (e.g., TOEPAS - Kling & Stæhr 2012). Language competence is under constant scrutiny by higher education authorities in the interest of quality assurance (Ball & Lindsay 2013). However, acknowledging the complexity and uniqueness of EMI settings (Smit 2013: 13) has led to the understanding that language proficiency criteria alone are an insufficient basis for the assessment of lecturers' EMI suitability (Wilkinson 2008; Klaassen & Räsänen 2006). This is supported by several
studies. For example, Klaassen (2001) found that while effective language behaviour did impact students' perceptions of understanding, it did not impact student learning, neither was language competence found to be a significant predictor of lecture clarity, nor did it correlate with effective lecturing behaviour or with student learning. Björkman (2011) reports that a high level of language competence is not a prerequisite to effective language use in EMI. Pilkinton-Pihko (2013) found that comprehensibility goals override native-like language proficiency in intercultural EMI settings. Finally, in an analysis of students' interpretive repertoires collected in group discussions elicited by video recordings of EMI lectures, Studer (2015) found that positive EMI experience "crucially depends on the lecturers' ability to negotiate communicative-didactic rather than linguistic competence".
In this light, more comprehensive quality approaches have been developed (e.g., the University of Freiburg EMIQM project - Gundermann & Dubow 2017; Aalto University Language Guidelines - Plym-Rissanen & Suurmunne 2010) that integrate EMI-specific linguistic and communicative/didactic competences. Continuing in this direction, the 2015-2017 "Internationalisation of Universities of Applied Sciences" project, funded by Swissuniversities and co-led by the Bern and Zürich Universities of Applied Sciences, developed an assessment tool to measure this range of competences in live EMI lecturing performances. This tool is intended to be used by EMI-trained raters during single classroom observations.
2. Theoretical Framework
A central question in the assessment of lecturer competence is how the student perspective can be used. One method is to implement student feedback questionnaires alongside trained-rater assessments. Another under-researched use for the student perspective is the validation of trained-rater instruments themselves.
According to Bachman (2004: 264-279), assessment instrument validation begins at the start of the design process with reference to the instrument's purpose, use, and interpretations and decisions to be made based on resulting evaluations. This implies that scores from trained-raters should also be a reflection of the perceptions of stakeholders, thus ensuring that scores are properly interpreted. While it is obvious that the student perspective would be the basis for the development of a student feedback questionnaire, it is argued that student perceptions also play an important role in the design and validation of trained-rater assessment tools. Their perspective should be taken alongside other validation considerations related to stakeholders in the education enterprise, such as the institution, policymaking bodies, or those representative of the post-education workplace. Since the purpose of the rater assessment tool in question is to measure the quality of EMI lecturing, students necessarily
represent a key target stakeholder group, whose perceptions of lecture quality should be reflected to some degree in trained-rater assessment scores. The importance of students' perspectives, given their position as the users of EMI lectures, is also demonstrated by the body of studies that focus on the student view (e.g., Chang 2010; Suviniitty 2012; Jensen et al. 2013). If true that the starting point in any model of teacher competence is linked to facets that impact students (Roelofs 2007: 127), and that any "meaningful testing should reflect the target situation" (Pilkinton-Pihko 2013: 3), it follows that the student perspective have a central role in the development of lecturer competence assessment tools.
The use of student feedback to assess the quality of teaching generally and in higher education in particular is not new. Such feedback plays an important role in quality assurance and accountability in education (Leckey & Neill 2001), and is often used to provide diagnostic feedback on, and determine the degree of, teaching effectiveness, to facilitate administrative decision-making, or for research purposes (Marsh & Dunkin 1992). Specifically with regard to EMI, research has examined student attitudes towards and experiences with English-taught programmes (e.g., Airey & Linder 2006; Karakaş 2017). Rarely, however, has empirical data from student reactions to live performances of EMI lecturers been used to facilitate the selection and verification of criteria for EMI quality assessment. In addition, student survey practices tend to be idiosyncratic and may often lack validation, reliability evidence as well as evidence of dimensionality through quantitative analysis (see Alderman, Towers & Bannah 2012: 261-263).
In view of these considerations, the present study examines the student perspective through the analysis of student reactions to EMI-lectures for two specific purposes. The first is to validate the trained-rater assessment tool specifically with respect to the linguistic, communicative and didactic competences. This is achieved by comparing student and trained-rater assessments and identifying items that are related to students' perception of EMI-lecture quality. The second objective is to construct a pool of empirically-tested items for use in EMI student feedback instruments and test items using newly developed reliability indices to assist in item decision making.
3. Method
3.1 Instruments
Student data was collected via two paper-based questionnaires. The first contained items that were strictly based on the original trained-rater assessment tool, and contained 15 items, plus a response variable to measure students' satisfaction with overall lecture quality, representing the construct under study, namely, EMI lecture quality. Items were simplified to compensate for students'
lack of specific training, while capturing the central meaning of the original trained-rater items (see Appendix for full wording of student items).
Student items were measured on a 4-point Likert scale (strongly disagree, disagree, agree, strongly agree). Each item was assigned to one of three analytic categories under study: language competence (LC), communicative competence (CC) or didactic competence (DC). These categories correspond to configurations of sub-competences in Celce-Murcia, Dörnyei & Thurell's model of Communicative Competence (1995) and Celce-Muria's subsequent revision (Celce-Murcia 2008). In these models, linguistic competence is identified as a bottom-up microlevel consisting of lexico-grammatical and phonological components. Interactional, discourse and strategic (an inventory of strategies that speakers draw on to facilitate communication) competences work together to facilitate communicative purpose, and are thus grouped together under CC (e.g., conversation, interacting with students via questions, verifying student comprehension). DC items are related to EMI-context-bound didactic goals or facilitating learning (e.g., drawing attention to the value of multicultural settings, the use of learning aids).
Data collected was used to validate the trained-rater questionnaire using two approaches. First, comparisons of student and trained-rater assessments were made to evaluate the correspondence between the two groups and the effectiveness in capturing the student perspective. This was done by means of a) direct comparisons of student and trained-rater assessments with statistical tests and b) Cohen's kappa coefficient, a chance-corrected measure of rater agreement (Everitt 1998: 202). The second approach was via regression modelling, which provides the basis for studying and characterizing the construct of interest. This is achieved through the formulation of a realistic mathematical model of the relationship between the outcome variable and the quality parameter variables (Everitt 1998: 319).
The second student questionnaire was subsequently developed based on the findings of the first questionnaire and by adding other items from other sources. This second questionnaire was then used to test a) the new items (see Appendix) and b) newly designed indices to facilitate decision making regarding item selection, both of which contribute to the development of an empirically-based pool of student feedback items for EMI.
3.2 Questionnaire 1 results
All statistical analyses were performed using R statistical software (R Core Team 2017 - Version 3.4). Complete datasets, additional plots, analyses and R-scripts, together with the original questionnaires, are available as online supplementary material.
The first student questionnaire was implemented together with the original EMI-trained-rater assessment tool in the fall of 2016, in 10 teaching units of the bachelor-level Business Administration International Programme, at the Bern University of Applied Sciences. The dataset contained 151 student evaluations and evaluations from six trained-raters (who observed in pairs or as individuals) of eight lecturers. Most students were German/Swiss German native speakers (75%), followed by Vietnamese (8%), English (8%), Russian (5%), French (5%), with the remainder Chinese, Albanian, Kurdish, Spanish, Portuguese, Indonesian and Arabic. Trained-raters were from Spain, Germany and Switzerland.
3.2.1 Comparison of students' and raters' evaluations
Trained-rater evaluations used the common Swiss grading-scale with grades of 3, 4, 5 and 6, 4 representing a minimum pass. This scale has a different acceptable/unacceptable threshold compared to the students' Likert scale. The two scales were harmonized by collapsing factor levels into three ordinal categories, namely, fail, sufficient and exemplary (the highest possible grade), thus facilitating the comparison of trained raters' with students' assessments. The collapsing of ordinal categories is a common procedure (Healey 2012: 307) and acceptable on the condition that data structure remains intact (Kateri 2014: 208-211). This was verified by comparing correlations before and after combining categories (Castiglioni & Dalla Zuanna 1992: 554). While some information is lost with any such merging, this was found to be minimal considering the nearly identical correlations revealed after the harmonization (see supplementary material for full details).
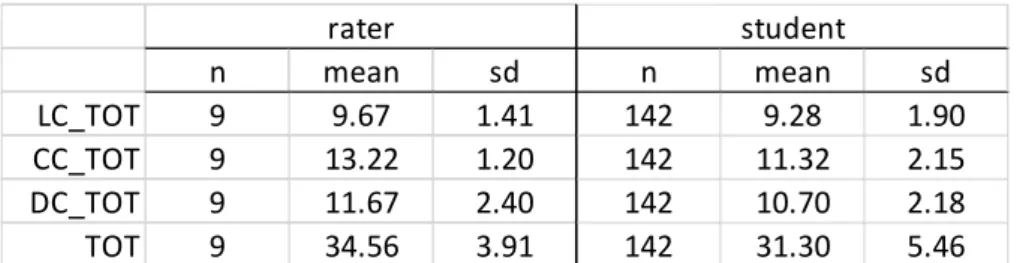
Student and rater assessments were analysed by comparing mean assessments of each questionnaire item at the class level as well as total scores in each analytic category (LC, CC, DC), plus an overall score based on the total sum of all items (see Tables 1 and 2 for summary statistics). Missing data was deleted listwise resulting in 142 complete student and nine rater cases for analyses.
Table 1: Summary statistics for total scores in linguistic, communicative and didactic categories, with overall sums of all items.
n mean sd n mean sd LC_TOT 9 9.67 1.41 142 9.28 1.90 CC_TOT 9 13.22 1.20 142 11.32 2.15 DC_TOT 9 11.67 2.40 142 10.70 2.18 TOT 9 34.56 3.91 142 31.30 5.46 rater student
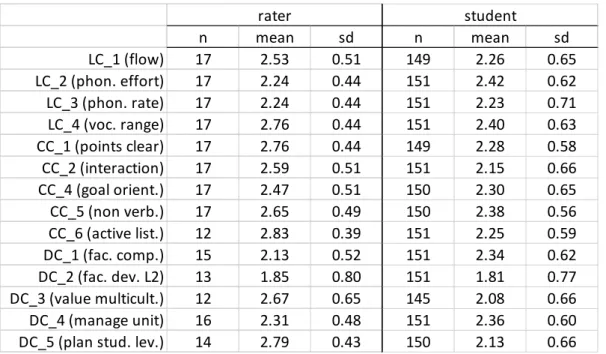
Table 2: Summary statistics for all items in questionnaire 1. No comparison for CC_3 (discussions) as trained raters did not evaluate this item.
Figure 1: Trained-rater (R) vs. student (S) assessment distributions for total scores in A) LC category, B) CC category, C) DC category and D) sum of all items for all participants. Wilcoxon tests indicate statistically significant differences between students and trained-raters.
n mean sd n mean sd LC_1 (flow) 17 2.53 0.51 149 2.26 0.65 LC_2 (phon. effort) 17 2.24 0.44 151 2.42 0.62 LC_3 (phon. rate) 17 2.24 0.44 151 2.23 0.71 LC_4 (voc. range) 17 2.76 0.44 151 2.40 0.63 CC_1 (points clear) 17 2.76 0.44 149 2.28 0.58 CC_2 (interaction) 17 2.59 0.51 151 2.15 0.66 CC_4 (goal orient.) 17 2.47 0.51 150 2.30 0.65 CC_5 (non verb.) 17 2.65 0.49 150 2.38 0.56 CC_6 (active list.) 12 2.83 0.39 151 2.25 0.59 DC_1 (fac. comp.) 15 2.13 0.52 151 2.34 0.62 DC_2 (fac. dev. L2) 13 1.85 0.80 151 1.81 0.77 DC_3 (value multicult.) 12 2.67 0.65 145 2.08 0.66 DC_4 (manage unit) 16 2.31 0.48 151 2.36 0.60
DC_5 (plan stud. lev.) 14 2.79 0.43 150 2.13 0.66
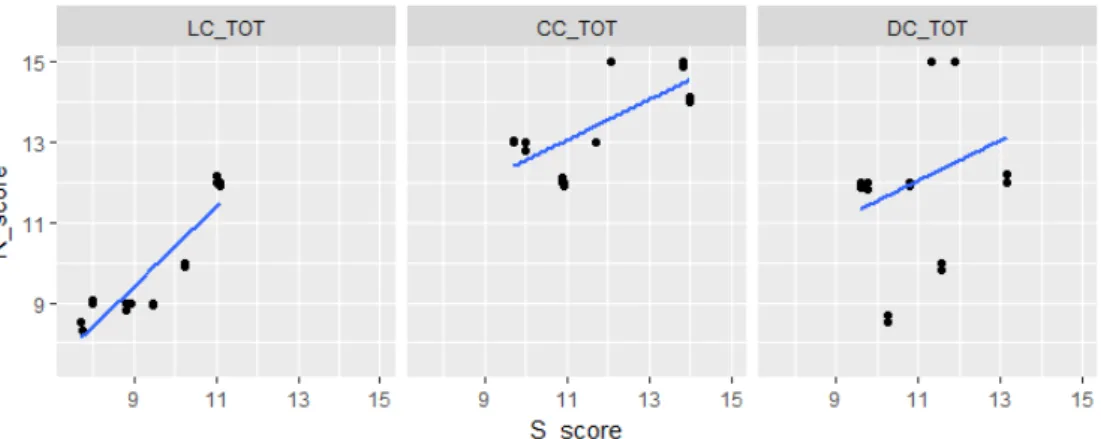
Figure 2: Scatterplots showing spread of mean category total scores for each teaching unit.
Figure 3: Distributions of mean evaluations for each item for each teaching unit.
The overall relationship between student and rater assessments was found to be uneven. While mean scores of all variables in all teaching units are statistically similar, the relationship is weak (Spearman's r = 0.17, n = 138, p = 0.05). Differences in total score distributions were not significant for LC or DC, but were for CC (Fig. 1). In addition, at the level of analytic categories (linguistic competence, communicative competence and didactic competence), the relationship appears strong for LC but weaker for CC and DC, as seen in the spread away from the blue lines in Fig. 2. Together this suggests that linguistic
features are perceived and conceptualized in a similar fashion, while communitive and didactic items are to a lesser degree.
An uneven level of agreement is also indicated by Cohen's kappa coefficients (weighted). Based on Landis & Koch's (1977: 165) rule of thumb, agreement is slight at the level of mean assessments for all items in all teaching units (κ = 0.17, n = 138, p = 0.02), and moderate for category totals for all teaching units (κ = 0.40, n = 24, p = 0.03) and overall score sums (κ = 0.50, n = 8, p = 0.04). This unevenness is also seen at the class level (Fig. 3) where significantly different score distributions were found in three of the ten classes.
3.2.2 Model of student perception of lecture quality
Three main regression models were developed to examine the construct of EMI lecture quality:
• Model.step: step-wise based on the Akaike information criterion (AIC),
• Model.fa: factor analysis,
• Model.corrstruct: variable-network structure based on the Fruchterman-Reingold algorithm.
Given that the outcome variable (perception of lecture quality) is ordinal, the ordinal regression model method was used implementing Cumulative Link Models (CLM) for ordinal data as described in Mangiafico (2015: 374-380). The models were then compared on the criterion of explained deviance, with significant differences indicated via ANOVA. The best fitting parsimonious model (i.e., maximizing explained deviance with a minimum of variables) was found to be model.step (see Table 3). However, this model is strict, with only six items. While this approach to regression modelling is ideal for outcome prediction alone, the main interest here is to understand functional relationships among variables related to lecture quality (see McDonald 2014: 231; Everitt 1998: 319). Consequently, a more cautious approach is preferred.
Factor analysis and principal component analysis, which deconstruct correlations and covariances to impute underlying factors that variables are related to (Everitt 1998: 140), were used to identify two distinct clusters of variables (see supplementary material). The secondary cluster, consisting of interaction, planning for student level, discussion and promotion of multilingual settings, was flagged for removal in the model.fa formula.
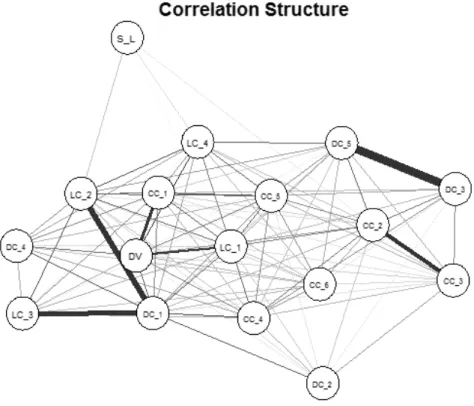
Model.corrstruct relies on the Fruchterman-Reingold algorithm, wherein forces within the data (here, the degree of relationship as expressed by correlation coefficients) are visualized. Low covariance is a repulsing force in the visualization, high covariance, an attracting force. In this way, the graph in Fig. 4 identifies groups of variables that are related to each other by considering all
forces within the dataset rather than individual pairwise comparisons of correlations (see Fruchterman & Reingold 1991: 1129-1132; Epskamp et al. 2012: 36). Variables that are most distant from the dependent variable (DV) in Fig. 4 are deselected in the model formula (development of L2, discussion, and promotion of multilingual-settings – the latter two are in common with model.fa). An analysis of variance was used to compare how well the models fit the data. None of the models showed significant differences in fit. However, the DC_3 variable (promotion multilingual-settings) caused model.fa to violate the proportional odds assumption for ordinal regression models (Mangiafico 2014: 375). While this was overcome by adjusting the model formula, the model.corrstruct was preferred in the interest of caution.
Figure 4: Variable-network structure based on the Fruchterman-Reingold algorithm. Items CC_3, DC_2 and DC_3 (development of L2, discussion, and promotion of multilingual settings) are those least related to DV (response variable: quality). S_L is student confidence in English.
Table 3: Analysis of deviance table for model.step.
In summary, based on the regression models, there is strong evidence that all three categories (linguistic, communicative and didactic) are essential components in the construct of EMI lecture quality in students, thus validating their inclusion in the trained-rater tool. However, given the lack consistent agreement in assessments, there is some evidence of the counterclaim that the tool will not lead to scores that consistently represent the student perspective in its current form. The trained-raters also gave higher evaluations compared to students. This could be improved through a training program especially on the communicative and didactic scales. The higher assessments are likely related to unexpectedly high EMI lecturing quality compared to their local environment. Regarding the items that the preferred model identified as candidates for removal, it is possible that these were not pertinent to the type of lecture assessed. CC Formal discussion and meetings, DC: Facilitating development of communication skills in L2 and DC: emphasizing value of multicultural setting) were not found to be relevant to lecture quality among students based on the data, but may be relevant in other types of learning units, especially if they are explicit learning goals. This suggests the need for different assessment instruments depending on the type of learning setting in question.
4. Questionnaire 2/Item Pool development
The second student questionnaire was subsequently developed to test items, contributing to a pool of empirically-tested items for use in EMI student feedback instruments, through newly developed reliability indices. The questionnaire was constructed by a) removing those items flagged above, b) adding items and c) adding variables to collect item-reliability data (students' understanding of, perception of relevance of, and ability to recall the questionnaire items). The added items were, by category: LC: 1) students' understanding of lecturer's words; CC: 2) whether the Lecturer asked students questions to involve them; DC: 3) classroom atmosphere, 4) flow of information, 5) lecturer's knowledge of topic, 6) content relevance, and 7) whether students improved their knowledge. These items are based on the Freiburg University EMIQM student forms and
LR Chisq Df Pr(>Chisq) Sig.
CC_1 (points_clear) 7.797 1 0.0052 ** LC_4 (voc_range) 10.543 1 0.0012 ** LC_1 (flow) 7.685 1 0.0056 ** DC_4 (manage_unit) 8.203 1 0.0042 ** CC_2 (interaction) 3.479 1 0.0622 . DC_5 (plan_stud_lev) 2.581 1 0.1082 Signif. codes: 0 ‘***’ 0.001 ‘**’ 0.01 ‘*’ 0.05 ‘.’ 0.1 ‘ ’ 1
student feedback forms used at the ZHAW (Gautschi & Studer 2017). This questionnaire (with no corresponding trained-rater assessment) was implemented in five classes (within the same Business administration programme) in the spring of 2017. This expanded student form used continuum scales (ticks marked on a line where end points are defined) rather than Likert scales to reduce loss of information from ordinal data.
To determine the degree to which students understood items, found them relevant to the lecture, and were able to remember the item at the end of the lecture, reliability indices were newly developed and calculated (u-index, rel-index and rem-rel-index respectively). These indicate the probability of scores
above a threshold of 75% on each index1. Possible values range from 0 to 1.
The discrimination index, which measures the degree to which items distinguish between performances, is a commonly used measure. Values of .40 and greater indicate good items, .30 to .39 are reasonably good with the possibility of improvement, .20 to .29 need revision, and below .19 are considered poor (Ebel & Frisbie 1991: 232). Discrimination is important to show that questionnaire items gather meaningful information. In addition to discrimination, demonstrating that students understand questionnaire items, are able to recall the requested information, as well as find them relevant, adds to the value of the questionnaire. To our knowledge, such indices have not been tested in prior studies.
4.1 Results
In total, 67 students evaluated five lecturers. Overall, the understanding-index shows that items were well understood, ranging from a minimum of 0.7 (indicating a 70% chance of being rated "I understand this well") to 1 (100% chance of being rated "I understand this well"). Regarding the relevance-index and the remember-index, while most items had values above 0.5 (50% chance of "This is relevant" or "I can remember this"), many had poor values in more than one index. For example, students had difficulty recalling, or seeing the relevance of rating lecturers' technical vocabulary range (rem-index=0.35; rel-index=0.28) or whether lecturers checked student comprehension (0.33 and 0.36 respectively). Surprisingly, lecturers' ability to interact with students scored low in terms of recall and relevance (0.5 and 0.56). Items had poor discrimination index values overall, most likely due to the high quality of the sample lectures under study. Thus, this index is not a suitable reliability indicator for the present dataset. No particular patterns within categories were found. The consolidation of item characteristics for both questionnaires 1 and 2 provide valuable information for the validation and continued development of both the
1 Each index uses an AUC (area under the curve) approach: ( ) = ( ) ( )
( ) , where ( ) is the probability distribution curve of variable scores with scores ranging from 0 to 100.
student questionnaire and the trained-rater tool. Analyses provide an empirical basis for subsequent action in the iterative process of assessment tool development (see column ACTION in the Appendix). It should be noted that this information, which reflects student perspectives, must be taken together with other validation considerations (Messick 1990: 21). For example, items that have been identified here as not contributing to the student perspective of quality (e.g., Didactic: emphasize value of multicultural lesson) may, upon review, be deemed necessary. If, as part of programme quality, drawing attention to this aspect is an explicit programme goal, then it may be appropriate for this item to be part of a programme evaluation, but not necessarily in student feedback forms.
5. Conclusion
In summary, the present study has shown that there is student-specific validation support for the original trained-rater assessment tool. All categories contributed to student perceptions of quality, thus confirming that communicative and didactic competences, in addition to linguistic, are essential to successful management of EMI settings. However, individual items, especially in the communicative and didactic scales, lack evidence, suggesting that further modifications to the rater tool is necessary as part of the ongoing process of assessment tool design. The study has also, through the development and implementation of original tools and approaches, contributed to a pool of assessment items that provides an empirical basis for the development of assessment instruments. In addition, the study has demonstrated that the combination of statistical modelling and item analysis can provide quantitative evidence of EMI lecture quality measurement.
Notwithstanding, questions remain. For instance, while the approach used is to take student assessments as evidence, it may be rightly asked to what degree the student perspective should be reflected in a rater tool. It is also recognized that student feedback has limitations especially in terms of the quality and reliability of responses (tickbox instruments may result in superficial, let's-get-this-over-with answers), or concerns regarding the comprehensiveness of information gathered (Hand & Rowe 2002: 149). Furthermore, student feedback, especially with respect to the chosen dependent variable of satisfaction with quality, may be idiosyncratic, and entail multiple latent variables such as lecturer personality and class entertainment value that go unmeasured in the present study. Also, with respect to the dimensionality of the construct of lecture quality, random effects such as individual students who evaluated more than one lecturer were not measureable due to missing student identity data in the anonymous paper-based survey.
While there is a good number of student assessments in the data collected, the number of raters and lecturer performances is small. In addition, the high quality
of the lecturing performances makes it difficult to assess the ability of the tools to distinguish between performances. Further research would therefore benefit from a broader quality range and number of classes observed to verify the findings presented here, as well as more in-depth analysis of random effects such as individual raters, accurate student English proficiency levels and other attitudinal factors that may impact student evaluations. It is also suggested that the construct of EMI lecture quality be examined more closely by means of a questionnaire design that incorporates a validated scale of lecture quality, consisting of a number of items rather than a single response variable. This would lead to improved psychometric properties in subsequent questionnaires. This would also facilitate the reduction of the number of items per category to a more manageable number without sacrificing information on the construct of interest.
REFERENCES
Airey, J. & Linder, C. (2006). Language and the experience of learning university physics in Sweden.
European Journal of Physics, 27, 553-560.
Alderman, L., Towers, S. & Bannah, S. (2012). Student feedback systems in higher education: A focused literature review and environmental scan. Quality in Higher Education, 18(3), 261-280.
Bachman, L. F. (2004). Statistical Analyses for Language Assessment. New York/Cambridge UK: Cambridge University Press.
Ball, P. & Lindsay, D. (2013). Language demands and support for English-medium instruction in tertiary education. Learning from a specific context. In A. Doiz, D. Lasagabaster & J. M. Sierra (eds.),
English-medium instruction at universities: Global challenges (pp. 44-64). Bristol: Multilingual
Matters.
Björkman, B. (2011). English as a lingua franca in higher education: Implications for EAP. Ibérica, 22, 79.
Castiglioni, M. & Dalla Zuanna, G. (1992). On The Homogeneity Criterion For Determining Whether Categories Of Categorical Variables Could Be Combined. Statistica Applicata, 4(4), 553-563.
Celce-Murcia, M. (2008). Rethinking the role of communicative competence in language teaching. In E. Alcon Soler & M. P. Safont Jorda (eds.), Intercultural language use and language learning (pp. 41-57). Dordrecht NL: Springer.
Celce-Murcia, M., Dörnyei, Z. & Thurrell, S. (1995). Communicative competence: A pedagogically motivated model with content specifications. Issues in Applied Linguistics, 6(2), 5-35.
Chang, Y. (2010). English-medium instruction for subject courses in tertiary education: Reactions from Taiwanese undergraduate students. Taiwan International ESP Journal, 2, 55-84.
Ebel, R. L. & Frisbie, D. A. (1991). Essentials of Educational Measurement. New Delhi: Prentice Hall of India.
Epskamp, S., Cramer, A. O. J., Waldorp, L. J., Schmittmann, V. D. & Borsboom, D. (2012). qgraph: Network Visualizations of Relationships in Psychometric Data. Journal of Statistical Software,
48(4), 1-18.
Everitt, B. (1998). The Cambridge Dictionary of Statistics. New York/Cambridge UK: Cambridge University Press.
Fruchterman, T. M. J. & Reingold, E. M. (1991). Graph drawing by force-directed placement. Software:
Gautschi, C. & Studer, P. (2017). The impact of internationalisation on tertiary-level educational social spheres. Bulletin Suisse de Linguistique Appliquée, No spécial 2017(1), 51-62.
Gundermann, S. & Dubow, G. (2017). Defining appropriate quality criteria to certify teachers in English-taught programs. In 10th Conference of the Association of Language Centres in Higher Education
(ACLES) - The role of Language Centres in the internationalization strategy of universities. University of Vigo (Spain), 29 June - 1 July 2017.
Hand, L. & Rowe, M. (2002). Evaluation of student feedback. Accounting Education, 10(2), 147-160. Healey, J. F. (2012). The Essentials of Statistics: A Tool for Social Research. Cengage Learning. Jensen, C., Denver, L., Mees, I. M. & Werther, C. (2013). Students' attitudes to lecturers' English in
English-medium higher education in Denmark. Nordic Journal of English Studies, 12(1), 87-112. Karakaş, A. (2017). The Forgotten Voices in Higher Education: Students' Satisfaction with
English-medium Instruction. Journal of English as an International Language, 12(1), 1-14.
Kateri, M. (2014). Contingency Table Analysis: Methods and Implementation Using R. New York: Springer.
Klaassen, R. (2001). The international university curriculum: challenges in English-medium engineering
education (Doctoral dissertation). Delft: Technische Universiteit Delft.
Klaassen, R. & Räsänen, A. (2006). Assessment and staff development in higher education for English-medium instruction: a question-raising article. In R. Wilkinson, V. Zegers & C. Van Leeuwen (eds.), Bridging the Assessment Gap in English-Medium Higher Education (pp. 235–253). Bochum: AKS-Verlag.
Kling, J. & Stæhr, L. S. (2012). The development of the Test of Oral English Proficiency for Academic
Staff (TOEPAS). Centre for Internationalisation and Parallel Language Use, University Of
Copenhagen.
Landis, J. R. & Koch, G. G. (1977). The measurement of observer agreement for categorical data.
Biometrics, 33(1), 159-174.
Leckey, J. & Neill, N. (2001). Quantifying quality: the importance of student feedback. Quality in Higher
Education, 7(1), 19-32.
Londo, M. (2011). Optimising EMI in higher education through CLIL. Case study at Vienna University of Technology.
Mangiafico, S. S. (2015). An R companion for the handbook of biological statistics, version 1.21. Marsh, H. W. & Dunkin, M. J. (1992). Students' evaluations of university teaching: A multidisciplinary
perspective. Higher Education: Handbook of Theory and Research, 143-233.
McDonald, J. H. (2014). Handbook of Biological Statistics. Baltimore, Maryland: Sparkly House Publishing.
Messick, S. (1990). Validity of Test Interpretation and Use. Princeton N.J.: Educational Testing Service. Pilkinton-Pihko, D. (2013). English-Medium Instruction : Seeking Assessment Criteria for Spoken. Plym-Rissanen, L. & Suurmunne, M. (2010). Aalto University Language Guidelines. Aalto University. R Core Team. (2017). R: A Language and Environment for Statistical Computing. Vienna, Austria. Roelofs, E. (2007). Towards a framework for assessing teacher competence. European Journal of
Vocational Training, 40, 123-139.
Schaller-Schwaner, I. (2005). Teaching ESAP at Switzerland's bilingual university: The case of English for psychology. In A. Gohard-Radenkovic (ed.), Plurilinguisme, interculturalité et didactique des
langues étrangères dans un contexte bilingue. Mehrsprachigkeit, Interkulturalität und Fremdsprachendidaktik in einem zweisprachigen Kontext (pp. 73-88). Frankfurt: Peter Lang.
Smit, U. (2013). Learning Affordances in Integrating Content and English as a Lingua Franca ("ICELF"): on an Implicit Approach to English Medium Teaching. Journal of Academic Writing, 3(1), 15-29.
Studer, P. (2015). Coping with English: students' perceptions of their teachers' linguistic competence in undergraduate science teaching. International Journal of Applied Linguistics, 25(2), 183-201. Suviniitty, J. (2012). Lectures in English as a Lingua Franca: Interactional Features. University of
Helsinki.
Wilkinson, R. (2008). English-taught study courses: principles and practice. In C. Gnutzmann (ed.),
English in Academia: Catalyst or Barrier? (pp. 169-182). Tübingen: Narr.
Additional documents
Appendix – summary of all analyses
Ticks indicate items included in the respective questionnaires. Disc – discrimination (<0.3 poor) , U, Rel, Rem: Understand, Relevance and Recall, respectively (<0.7 poor). Dark grey indicates poor values, light grey acceptable values. ACTION is marked "review" if two or more indices are poor
Ite m ID Ite m Ite m s Be st mo de l Di sc (+/ -) Ite m s U inde x Rel inde x Rem index Di sc (70%) ACT IO N LC _1 Th e le ct ur er e ff ec tiv el y found a w ay to k ee p the fl ow of h is /h er c om m uni ca tio n ev en w he n en co un ter in g di ff ic ul ties (e. g. , s ea rc hi ng fo r w or ds ). OK LC _2 I unde rs tood the le ct ur er 's pr onunc ia tion w ithout any e xt ra e ff or t. OK LC _3 I w as a bl e to fo llo w th e lec tu re r's s peec h ra te (s peed o f s pea kin g) . OK LC _4 Th e le ct ur er h as lan gu ag e an d vo ca bu lar y to e xp re ss h im -/ he rs el f a nd to suppor t th e co nt en t of the le ss on. re vi ew LC _c om fo rt _i n_ E Th e le ct ur er s pok e ea si ly a nd co nf id en tly a bo ut thi s topi c in Eng lis h. OK LC _vo c_fa m It w as e as y to unde rs ta nd th e le ct ur er ’s E ng lis h (wor ds , phr as es) . re vi ew CC _1 Th e le ct ur er intr oduc ed a nd ex pl ai ne d to pi cs c le ar ly a nd co nvi ncin gl y. OK CC _2 Th e le ct ur er k ne w how to ta lk wi th u s to cr ea te a li ve ly a nd in te re st in g le ar ni ng en vi ro nm en t. re vi ew CC _3 Th e le ct ur er inv ite d count er a rg um en ts a nd st im ul at ed d is cu ss io n/ de ba te a bo ut th e su bj ect . re vi ew CC _4 Th e le ct ur er g av e us o ppor tuni tie s to co nt ribute a nd ch ec ke d ou r unde rs ta ndi ng . OK CC _5 Th e le ct ur e’s b od y la ng ua ge sh ow ed c on fid en ce in tea ch in g th ro ugh E ng lis h. re vi ew CC _6 Th e le ct ur er c he ck ed tha t he /s he unde rs tood st ude nt s’ c ont ribut io ns b y as ki ng que st io ns to cl ar ify . OK CC _c he ck _S _u nd er Th e le ct ur er c he ck ed tha t w e unde rs tood com m uni ca tion in th e cl as s. re vi ew CC _i nv ol ve _S s Th e le ct ur er fr eque nt ly g ot the s tude nts in vo lv ed b y as ki ng que st io ns . OK DC _1 Ai ds (pow er poi nt , ha ndouts , w or dl is ts , v oc abul ar y w or k) e ff ec tiv el y he lpe d m y unde rs ta ndi ng a t a n appr opr ia te E ng lis h le ve l. OK DC _2 Th e le ct ur er e ff ec tiv el y cr ea ted o pp or tu ni ties fo r u s to c om m un ic at e in E ng lis h (g ro up a ct iv itie s, p re se nta tio ns ). re vi ew DC _3 Th e le ct ur er d re w a tt ent io n to the v al ue o f a m ul tic ul tur al or m ult ilin gu al cl assr oo m . re vi ew DC _4 Th e le ct ur er e xp la in ed w he re w e w er e an d w ha t w e w er e do in g at ev er y st ag e dur in g t he le ss on . OK DC _5 Th e le ct ur er took o ur le ve l o f E ng lis h and di ff er en t c ul tur al b ac kg ro unds into co ns id er at io n w he n pl anni ng th is le ss on . re vi ew DC _a tm os Th e at m os ph er e w as g oo d. re vi ew DC _f low _inf o Th e flo w o f i nfo rm at io n w as g ood (n ot to o slow o r fas t). re vi ew DC _L _kn ow s_t op Th e le ct ur er h as g oo d kn ow led ge o f t he to pi c. OK DC _rel co nt en t Th e co nt en t w as re le va nt and pr ac tic al . OK DC _S _l ea rn M y subj ec t k nowl edg e im pr ov ed fr om thi s le ss on. re vi ew Q ue st io nn air e 1 Q ue st io nn ai re 2