HAL Id: hal-00304665
https://hal.archives-ouvertes.fr/hal-00304665
Submitted on 1 Jan 2002HAL is a multi-disciplinary open access archive for the deposit and dissemination of sci-entific research documents, whether they are pub-lished or not. The documents may come from teaching and research institutions in France or abroad, or from public or private research centers.
L’archive ouverte pluridisciplinaire HAL, est destinée au dépôt et à la diffusion de documents scientifiques de niveau recherche, publiés ou non, émanant des établissements d’enseignement et de recherche français ou étrangers, des laboratoires publics ou privés.
Europe
S. E. Machefert, N. B. Dise, K. W. T. Goulding, P.G. Whitehead
To cite this version:
S. E. Machefert, N. B. Dise, K. W. T. Goulding, P.G. Whitehead. Nitrous oxide emission from a range of land uses across Europe. Hydrology and Earth System Sciences Discussions, European Geosciences Union, 2002, 6 (3), pp.325-338. �hal-00304665�
Nitrous oxide emission from a range of land uses across Europe
S.E.Machefert
1, N.B.Dise
1, K.W.T.Goulding
2and P.G.Whitehead
3 1Department of Earth Sciences, The Open University, Milton Keynes, MK7 6AA, UK2Agriculture and Environment Division, IACR Rothamsted, Harpenden, AL5 2JQ, UK
3Aquatic Environments Research Centre, Department of Geography, University of Reading, Reading, RG6 6AB, UK
Email for corresponding author: s.e.machefert@open.ac.uk
Abstract
The results of a literature study examining quantitative estimates of N2O emission rates are presented for a range of land-uses across Europe.
The analysis shows that the highest N2O emission rates are for agricultural lands compared to forests and grasslands. The main factors
regulating these rates are available mineral nitrogen, soil temperature, soil water content and the available labile organic compounds. These
controls operate across different time-scales, all must exceed a certain threshold for N2O emission to occur. The results support the need for
an emission factor function of land-use and climate within models describing nitrogen dynamics in catchments. This would allow the assessment
of the net N2O emission within catchments in terms of current levels and potential changes associated with climate variability, climate change
and land use change.
Keywords: nitrous oxide, soil water content, inorganic N, soil temperature, ecosystems, land-use management, soil type
Introduction
Soils are the most important source of atmospheric nitrous
oxide (N2O), contributing an estimated 70% to the total
globally emitted N2O (Bouwman, 1990). To the extent that
soils are managed, especially if they receive nitrogen fertilisers, or are impacted upon by atmospheric N
deposition, they are also an anthropogenic source of N2O.
Other sources of N2O are the oceans, biomass burning and
emissions from industrial processes and automobiles (Bange, 2000). Nitrous oxide is of great interest from an environmental point of view because it is an important greenhouse gas present in the lower atmosphere (the
troposphere) at about 0.00003%. Although N2O constitutes
only 6% of the anthropogenic greenhouse effect (Bouwman, 1998), it has a radiative forcing 180 times greater than carbon dioxide (Lashof and Ahuja, 1990; Mogge et al., 1998). It also contributes to the depletion of stratospheric ozone. Over
the last 25 years the concentration of N2O in the atmosphere
has risen by about 0.25% per year (Flessa et al., 1995). In comparison, the atmospheric concentration of carbon dioxide has been increasing at about 0.3% per year since the 1960s and that of methane, another greenhouse gas, by 1% per year.
N2O is both emitted and absorbed by soils, but the net flux
is almost always emission. Due to seasonal and spatial
variation, N2O emissions are difficult to quantify (Smith et
al., 1994) and the estimation of annual emissions from a
small number of observations may lead to considerable errors. This emphasises the need for long-term studies to overcome the problem.
A recent review by Wrage et al. (2001) brought together
information on N2O fluxes, but only for nitrifier
denitrification. This paper provides a more comprehensive
review of N2O fluxes for a range of land-uses across Europe
from all sources. This work aims to identify the main factors
influencing these emissions and to compare N2O emission
estimates for different ecosystems (forests, grasslands and agricultural land).
Processes
Two mechanisms are mainly responsible for N2O emissions
from soils: microbial nitrification and denitrification (Table 1). A third, not well known process has recently been studied by Wrage et al. (2001): nitrifier denitrification. This process
is carried out by autotrophic nitrifiers that oxidize ammonia
(NH3) to nitrite (NO2-) and then reduce NO
2- to nitric oxide
(NO), nitrous oxide (N2O) and molecular nitrogen (N2).
Nitrifier denitrification can lead to substantial N2O emissions
especially when low oxygen conditions are coupled with low organic carbon contents of soils and low pH. The
maximum amount of N2O lost via nitrifier denitrification in
soils represents about 30% of the total N2O production
(Webster and Hopkins, 1996).
Nitrification consists of the oxidation of ammonium
(NH4+) to nitrite (NO
2-) and then nitrate (NO3–). It is an
aerobic process carried out by a few genera of autotrophic bacteria able to use the energy generated from these processes. The best studied are the obligate chemoautotrophs, Nitrosomonas and Nitrobacter species (Robertson and Kuenen, 1991). At sub-optimal oxygen
concentrations oxidation into NO3– is incomplete and some
of the NH4+ is channelled into the production of NO and
N2O (Poth and Focht, 1985). Bremner and Blackmer (1981)
report that N2O production is higher with added nitrifiable
nitrogen (e.g. urea or ammonium containing fertiliser). Nitrification occurs most rapidly when soil pH is between 5.5 and 6.5 (Kasica, 1997). For instance, nitrification rates from pasture soils have been found to be higher in the zone of the soil with a pH value of 5.7 than in a deeper soil layer with a pH value of 4.7 (Black et al., 1998). In the field, nitrification can also be controlled by the moisture content and temperature of the soil.
Denitrification is the anaerobic process by which nitrate
(NO3–) and nitrite (NO
2–) are reduced to give nitric oxide
(NO), nitrous oxide (N2O ) and dinitrogen (N2). It requires
a ready supply of reduced carbon for energy and NO3– as a
substrate. A wide range of micro-organisms can denitrify.
They are facultative anaerobes and switch to NO3– as a
terminal electron acceptor when oxygen is unavailable. Important environmental controls for denitrification include temperature, soil moisture and pH. Denitrification will have different products depending on the level of soil moisture,
with NO favoured by lower soil moisture grading into N2
favoured at the highest soil moisture. However, it is still unclear exactly what level of soil moisture will lead to
primarily NO, N2O or N2.
The extent to which these two processes, nitrification and
denitrification, contribute to N2O emission will vary with
climate, soil conditions and soil management. Generally, high rainfall, poor drainage, fine soil texture and high organic carbon content promote denitrification whereas low rainfall, good drainage and aeration and coarse texture promote nitrification (Groffman, 1991). However, due to the complex interactions of the factors influencing the processes, it is difficult in most soils to determine which process prevails and what proportion of the nitrogen released
is N2O. The processes of denitrification and nitrification
can also co-occur at the same time in a single site due to micro-scale soil heterogeneity and the balance between the two processes can switch very rapidly.
Material description and methods
The analysis was made by compiling data from reviews and
site-specific field experiments on N2O flux controls for a
variety of European ecosystems (Appendix 1). The 33 individual experiments from 13 references are from grasslands (fertilised or non-fertilised), forests (subjected to variable amounts of atmospheric N deposition) and agricultural sites (different crop types) across Europe. Only studies with at least 1 year’s data are included. The
determination of N2O emission rates for all of the 13
references considered was made using the closed chamber method (Hutchinson and Mosier, 1981) and gas samples were then analysed by gas chromatography. The standard soil- and weather-dependent parameters were measured in most cases. These include monitoring of precipitation, air temperatures, soil temperatures at different depths (digital thermometer), water-table levels and pH of soil in water. Soil water content was determined and results were given either as volumetric water content, gravimetric water content (wt/wt) or as water filled pore space. Soil analysis for nitrate
and ammonium concentrations (KCl or KAl(SO4)2, Papen
Table 1. Factors favouring Nitrification and Denitrification
processes
Nitrification Denitrification
Substrate NH4+, urea, NO
3
-availability amino acids
O2 high low
concentration
reduced No effect high
carbon (energy source)
moisture intermediate high
(water filled 30-70 % WFPS 55-100 % WFPS
pore space)
soil high high
temperature (within range) (within range)
and Butterbach-Bahl, 1999, extractions) were also performed. The water-soluble organic carbon compounds were determined in the method described in Burford and Bremner (1975) and the soil organic matter as Loss-On Ignition method.
Results
Brumme et al. (1999) report a study of eleven forest ecosystems in Germany comprising mainly alder, beech and spruce (Table 2). Element budgets and soil characteristics were measured in these forests and showed distinct differences between sites, including pH ranging from 3.6 to 5.6. Nitrogen deposition ranged from 20 to 41 kg N
ha–1yr–1. In these ecosystems, the soil surfaces were more
or less covered by herbaceous vegetation. Nitrous oxide emissions were measured weekly or biweekly over one year with closed chambers.
Brumme et al. (1999) distinguished three types of emission patterns determined by the differences in temporal variation: (a) ‘seasonal’ emission pattern, (b) ‘event-based’ emission pattern and (c) ‘background’ emission pattern. The ‘background’ pattern is characterised by low annual fluxes. They found that most sites show background emission patterns, with low emissions during the whole year and low
annual site means ranging from 0.17 to 0.80 kg N2O-N
ha–1 yr–1 (Table 2). Similar and relatively constant N
2O
emissions were found in one forest in Finland (Martikainen
et al., 1994), three forests in the UK (Skiba et al., 1996),
one other forest in Germany (Mogge et al., 1998) and two forests in Denmark (Ambus and Christensen, 1995), with
annual emissions ranging from 0.12 to 0.8 kg N2O-N ha–1
yr–1 (Appendix 1). Only two of the sites studied by Brumme
et al. (1999) appeared to display ‘seasonal’ patterns. Such
sites are characterised by a period of elevated rates in summer. These two sites had much higher annual fluxes:
3.0 and 7.3 kg N2O-N ha–1 yr–1 (Table 2). Some of the
forested sites listed in Appendix 1 show similar fluxes. The ‘event’ emission pattern is characterised by short peaks of
N2O emission during or following periods such as frost or
thaw. Brumme et al. (1999) observed this type of emission
at a drained site in Germany, with N2O flux changing from
100 µg N2O-N m–2 h–1 to about 500 µg N2O-N m–2 h–1 with
the onset of the spring thaw in 1996.
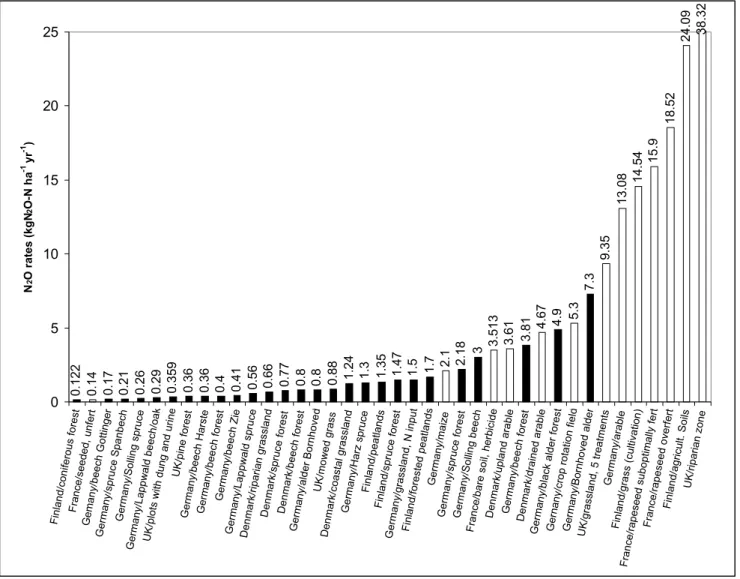
The results from the 33 sites together with the data from Brumme et al. (1999) are presented in Fig. 1. These data
indicate a gradient of N2O emissions with low fluxes for
forests and grasslands, and higher emissions from
agricultural fields. However, five forested sites show N2O
emissions within the same range obtained for the arable agricultural sites; these are in Höglwald (two sites), Solling, Schelswig-Holstein and Bornhöved in Germany. Annual
emissions were 2.18 kg N2O-N ha–1 yr–1, 3 kg N
2O-N ha–1
yr–1, 3.81 kg N
2O-N ha–1 yr–1, 4.9 kg N2O-N ha–1 yr-1 and 7.3
Table 2. Annual losses of nitrous oxide and some site characteristics
Site location Vegetation N2O Soil Bulk density Precipitation Nc deposition Type of
kg N2O-N ha–1 yr–1 (0-5 cm) mm yr–1 Kg N ha-1yr-1 flux g cm–3 Bornhoved (d) alder 7.3 0.48 697 33 s Solling beech 3.0 1.01 1090 35 s Harz spruce 1.3 1.2 1239 20 b Bornhoved alder 0.80 - 697 33 e Lappwald spruce 0.56 1.2 650 - b Zierenberg beech 0.41 0.75 700 21 b Harste beech 0.36 1.17 750 26 b Lappwald beech/oak 0.29 0.85 650 - b Solling spruce 0.26 0.91 1090 41 b Spanbeck spruce 0.21 1.01 650 31 b
Gottinger Wald beech 0.17 0.79 680 28 b
Data from Brumme et al. (1999) (d) – drained
c Throughfall of NH
4+ + NO3– + Norg
Fig. 1 Nitrous oxide emission rates for different European ecosystems - Black bars represent the forested and grassland ecosystems. White bars
represent the agricultural ecosystems
0.122 0.14 0.17 0.21 0.26 0.29 0.359 0.36 0.36 0.4 0.41 0.56 0.66 0.77 0.8 0.8 0.88 1.24 1.3 1.35 1.47 1.5 1.7 2.1 2.18 3 3.513 3.61 3.81 4.67 4.9 5.3 7.3 9.35 13.08 14.54 15.9 18.52 24.09 38.32 0 5 10 15 20 25 Finland/coniferous fores t France/seeded, unfert Gemany/beech Gottinge r Germany/spruce Spanbech Germany/Solling spruce Germany/Lappwald beech/oa k
UK/plots with dung and urin e
UK/pine forest
Germany/beech HarsteGermany/beech forest Germany/beech Zie
Germany/Lappwald spruceDenmark/riparian grasslan d
Denmark/spruce forestDenmark/beech forest Germany/alder Bornhove d UK/mowed grass Denmark/coastal grassland Germany/Harz spruce Finland/peatlands Finland/spruce forest Germany/grassland, N inpu t Finland/forested peatland s Germany/maize Germany/spruce forestGermany/Solling beech
France/bare soil, herbicid e
Denmark/upland arableGermany/beech forestDenmark/drained arable Germany/black alder fores
t
Gernany/crop rotation fiel d Germany/Bornhoved alde r UK/grassland, 5 treatments Germany/arable Finland/grass (cultivation )
France/rapeseed suboptimally fer t France/rapeseed overfer t Finland/agricult. Soils UK/riparian zone N 2 O rates (kgN 2 O-N ha -1 yr -1 )
kg N2O-N ha–1 yr–1 respectively. Germany is among the
European countries receiving the highest atmospheric N deposition as oxidised or reduced nitrogen. The mean annual precipitation for these regions is about 850 mm. The soils are acidic and mostly organic.
Discussion
Nitrous oxide emissions from soils have been widely studied in the past decades and it is generally agreed that the main processes responsible for emissions, namely nitrification and denitrification, are not controlled by only one parameter but by several interacting parameters making predictions very difficult.
SOIL MOISTURE, BULK DENSITY, RAINFALL
Hydrological factors seem to exert the strongest controls
on annual N2O emissions for most of the sites studied by
Brumme et al.(1999). These factors affect nitrification and denitrification in different ways. Denitrification will be favoured by high moisture contents whereas nitrification will occur in drier soils. For instance, it has been observed (Davidson, 1991) that nitrification is the dominant source
of N2O when water filled pore space (WFPS, calculated
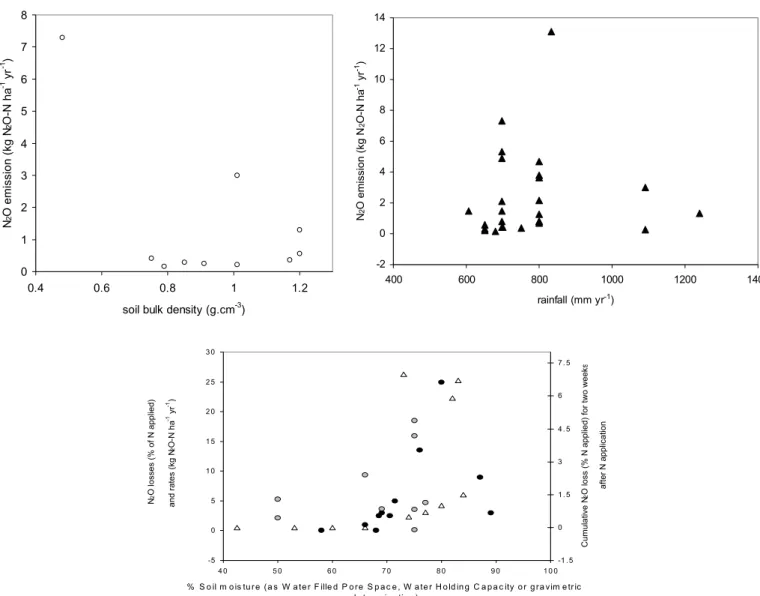
using gravimetric water content) is less than 60% and that denitrification is the predominant source when WFPS is greater than 60%. By comparison, Fig. 2 shows the
relationship between annual N2O emissions and bulk density
(data from Brumme et al., 1999). There is no strong correlation. In addition, the data obtained by Brumme et al.
0 1 2 3 4 5 6 7 8 0.4 0.6 0.8 1 1.2
soil bulk density (g.cm-3)
N2 O emission (kg N 2 O-N ha -1 yr -1) -2 0 2 4 6 8 10 12 14 400 600 800 1000 1200 1400 rainfall (mm yr-1) N 2 O emission (kg N 2 O-N ha -1 yr -1)
Fig. 2. Relationships between annual nitrous oxide emissions and soil bulk density, annual precipitation and soil moisture. (▲) All data (13
references from Appendix 1 and Brumme et al., 1999). () Data points from Brumme et al., 1999. (z) Data set for sugar cane, banana and pasture in the tropics of Costa Rica. The data were redrawn from Veldkamp et al. (1998). (∆) Data points from managed grassland in W.
Europe (Dobbie et al., 1999). Grey circles represent the data from agricultural soils in Europe (see studies in Appendix 1). The scale for the N2O data from the tropical soils and from the agricultural data is on the left side of the graph, from the grassland data on the right side of the graph. -5 0 5 1 0 1 5 2 0 2 5 3 0 4 0 5 0 6 0 7 0 8 0 9 0 1 0 0
% S o il m o is tu r e (a s W a te r F ille d P o re S p a c e , W a te r H o ld in g C a p a c ity o r g ra vim e tr ic d e te r m in a tio n ) N 2 O losses (% of N applied) and rates (kg N 2 O-N ha -1 yr -1) -1 . 5 0 1 . 5 3 4 . 5 6 7 . 5 Cumulative N 2
O loss (% N applied) for two week
s
after N application
(1999) and those from the 13 references considered in Appendix 1 show that no strong relationship exists between
N2O emissions and rainfall (Fig. 2).
High N2O emissions measured by Brumme et al. (1999)
took place when the soil water content was near field capacity (~1kPa) and lasted until the soil water suction
reached 2kPa. Once this threshold was reached, N2O
emissions decreased. In the study of Skiba et al. (1996) daily and even seasonal changes in moisture were not very well
correlated with N2O fluxes. However, they observed a strong
correlation between annual precipitation and annual N2O
fluxes. Their data for a coniferous forest in central Scotland gives some clues about the relative importance of temperature and soil moisture. They observed, for the same
soil, that wetter soil at lower temperatures had higher fluxes
than drier soil at higher temperatures (0.47 kg N ha–1 with a
mean soil moisture content of 34% of soil dry weight and average soil temperature of 10ºC for 1993; and 0.3 kg N
ha–1 with a mean soil moisture content of 25% of soil dry
weight and average soil temperature of 12ºC for 1994). Mogge et al. (1998), in their study of two forest sites in Höglwald, Germany, show that an increase in soil moisture,
due to precipitation, contributed to the high N2O emissions
observed at both sites (precipitation recorded from July to September and in December). The same positive correlation was reported in another of their studies (Mogge et al., 1999). The literature also suggests that a threshold for soil gravimetric water content of about 60–70% exists above
which significant N2O emission can be obtained. In temperate climates (Dobbie et al., 1999) as well as in the
tropics (Veldkamp et al., 1998), maximum N2O emissions
have been found to occur at a water filled pore space (WFPS) of 75–85% (weight/weight, Fig.2). This has also been found across Europe for different ecosystems (Mogge et al., 1998; Ruser et al., 1998). As well as regulating the emission rate,
water filled pore space regulates the proportion of N2O
emission from nitrification and denitrification due to its
effect on O2 diffusion. In soils with good oxygen supply,
emission of NO should dominate while N2O may be the
main product in moderately aerated soils. Nitrous oxide and NO losses are both high in poorly aerated soils and only in very poorly aerated soils (waterlogged soils with Eh close
to 0V) does N2 emission dominate.
Soil moisture is clearly influencing N2O emissions
whereas rainfall shows no clear relationship with fluxes. This may be a result of the different response soils have to rainfall according to their nature. For instance, where soils contain higher percentages of clay, diffusion of the water through the soil will be slower and high rainfall will not necessarily result in higher soil moisture content. Also, part of the rainfall will be accounted for as runoff water. N INPUT, N OUTPUT, N FERTILISATION, N SATURATION
Nitrogen availability is another control for nitrification and denitrification, but different forms of inorganic N will have
different effects: NH4+ availability will influence
nitrification, and denitrification will be affected by NO3–
availability (Table 1). However, the two processes are
closely linked, since NO3– ions are produced by nitrification
of NH4+. It is still unclear what the minimum concentrations
for NO3– and NH
4+ are below which denitrification or
nitrification will not occur.
Data on forested ecosystems in Europe (NITREX, Matzner, 1989) showed that nitrogen deposition affects the excess of nitrogen in the soil solution. Brumme et al. (1999)
did not find any effect of N deposition on N2O emissions
from sites with background emissions, presumably where N deposition did not result in excess mineral N in the soil.
However, they observed high N2O emissions from the two
sites where ‘seasonal’ emissions were observed. It is unclear why such high emissions were found at the Solling beech stand and in the case of the drained alder forest in Bornhöved it could be explained by the fact that alders are N-fixing species which can exude nitrate into the soil from their nodules and also produce leaf litter with a high N content. The Intergovernmental Panel on Climate Change (1997) estimated that 1% of the N supplied by atmospheric
deposition to natural soils is emitted as N2O. This is a simple
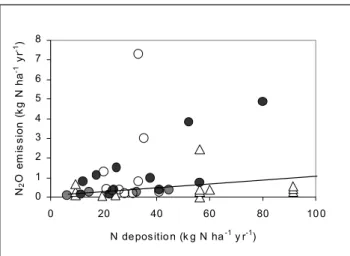
estimate (or ‘default value’) based on readily available input data. In Fig. 3, the data points significantly above the 1% IPCC default line are from sites which had received continuous elevated N deposition rates for many years. Many of the values below this line but receiving high N deposition are from field experiments where elevated N deposition was simulated for a relatively short time. In the sites studied by Brumme et al. (1999), the minimum N
deposition is about 20 kg N ha–1yr–1 (Table 2). Applying
fertiliser only seemed to generate pulses of N2O emission
but showed no long-term effect. Results for agricultural sites
from Skiba et al. (1996) showed a positive response of N2O
emissions a few weeks after fertilisation. This has also been observed by Mogge et al. (1999). Moreover, the timing of fertiliser application appears to be an important factor
affecting annual fluxes, with higher annual N2O fluxes if
fertiliser is applied during warmer months. Major increases
in N2O flux can occur shortly after fertilisation, with near
background emissions restored within several weeks after application (Skiba and Smith, 2000).
Together, the N-deposition and N-fertilisation data suggest that the ‘N status’ of the sites, i.e. the availability of mineral N substrate for nitrification and denitrification (applied, or derived from organic N applied), is probably a secondary
control for N2O emissions after moisture and temperature.
However, N2O emission will only occur if a minimum level
of N substrate is present in the sites. It may also be that N2O
losses will increase linearly with N input once the system has reached optimum levels of the other factors controlling
N2O emission.
Fig. 3. N deposition induced emissions from forest and moorland
soils. In upland areas (grey circles), large-scale acid mist experiments (∆), downwind of point sources: poultry and pig farms
(z), and German forests (), IPCC emission factor 1% (solid line). 0 1 2 3 4 5 6 7 8 0 20 40 60 80 10 0 N depositio n (k g N ha-1 y r-1) N2 O e m is s ion ( k g N ha -1 yr -1)
CARBON SOURCE, LITTER QUALITY, CROP TYPE
Another factor to be considered when looking at N2O
emissions is the carbon source. This is an important control for denitrification. In their study, Brumme et al. (1999)
looked at the effect on annual N2O emissions of the mass of
the organic horizon in the soils studied (Fig. 4). Unfortunately there are not enough data to draw definite conclusions. Figure 4 suggests that an increase in the mass of the upper organic horizon provides an additional carbon source for nitrification/denitrification for which it might be possible to determine a threshold with more data. Nitrous oxide fluxes may be higher for organic upper horizon
>100 t ha–1. However, as for nitrogen inputs, this only seems
to have a secondary effect on N2O emissions.
Different crop types appear to emit different amounts of
N2O. This has been shown by Skiba et al. (1996) in their
study of a range of agricultural and semi-natural soils in south and central Scotland. For instance, a potato crop
emitted more N2O than cereals. An explanation for this was
the contribution of more labile crop residues following harvest, and root exudation during tuber development. Dobbie et al. (1999) obtained higher emission factors from potato and brassica crops (1.8–7% of N applied) than for wheat and barley (0.2–0.7% of N applied). This was also found by Henault et al. (1998) for wheat compared to oil seed rape (0.42 compared to 0.55%). Similar observations have been made by Brumme et al. (1999) regarding the litter quality in forested ecosystems. In an experiment where litter fall between beech and spruce stands was exchanged
(Solling, Germany), N2O emissions increased in the spruce
stand after application of beech litter and decreased in the beech stand after spruce litter had been applied. However,
the change in N2O flux between controls and treated plots
was much less than the actual differences between control
stands, suggesting either that a longer time is needed to obtain a flux response or that other factors are important.
TEMPERATURE
Both nitrification and denitrification rates are controlled by soil temperature. The rapid increase in process rates with increasing temperature suggests that the response to temperature is primarily a biochemical response rather than a population one. Temperature is also a daily control and a fast response parameter. Seasonal and diurnal changes in temperature have been shown to be correlated, directly and
linearly, with N2O emission for many soils in temperate
climates (Skiba et al., 1998; Skiba and Smith, 2000). But this is only true when other important factors such as WFPS or mineral N are not limiting. This was shown by Dobbie et
al. (1999) in their study of intensively managed agricultural
fields, with Q10 values of up to 8. In their study of 11 forest
soils in Germany, Brumme et al. (1999) observed an increase
of the N2O emission from 6 µg N2O-N m–2 h–1 up to a more
or less constant level of about 90 µg N2O-N m–2 h–1 when
soil temperature exceeded 10°C. Their data also indicated
that during the period of high emissions N2O fluxes followed
changes in temperature. The Q10values obtained for this same
study were as high as 14. Such an extremely high Q10 is
partially explained by temperature-induced positive feedback. For instance, a rise in temperature will have an effect on soil respiration and anaerobicity thus influencing nitrification and denitrification rates (Smith, 1997). In addition, the data obtained by Brumme et al. (1999) show
that N2O fluxes are related to the air temperature (Fig. 5)
with small fluxes at temperatures below 8°C and larger fluxes more likely to happen at higher temperature, but
depending on other factors. N2O fluxes will also be related
0 0.5 1 1.5 2 2.5 3 3.5 0 20 40 60 80 100 120 140 160 180
Organic horizon (t material ha-1)
N2 O rates (kg N 2 O-N ha -1 yr -1)
Fig. 4. Relationship between annual nitrous oxide rates and the total
mass of material in the organic upper horizon. Data from Brumme et
al., 1999
Fig. 5. Relationship between annual air temperature and N2O flux.
Data redrawn from Brumme et al.,1999.
0 20 40 60 80 100 120 140 160 0 2 4 6 8 10 12 14 16 18 20 Temperature (oC) N2 O flux (10 -6g N 2 O-N m -2 h -1)
to the soil temperature since the soil temperature is related to air temperature but is lagged with time and damped with depth. For the Brumme et al. (1999) study, only air temperature was available. This is often the case since air temperature are readily available.
Studies such as Mogge et al. (1999), Flessa et al. (1995)
or Papen and Butterbach-Bahl (1999) showed peaks of N2O
emissions during freeze-thaw periods. Brumme et al. (1999)
also showed that freeze-thaw influences N2O fluxes but only
at one of the sites studied. The effect of temperature on N2O
emission can be counteracted by its stimulating effect on
plant growth, thus enhancing the competition for NO3– and
NH4+.
More generally, denitrifying organisms can adapt to local temperatures (and possibly other local conditions): Powlson
et al. (1988) showed that denitrifiers from England and
Australia denitrified at the same rate when at local optimum temperatures of 10 and 20ºC, respectively.
NET EFFECT
The response of N2O emissions to factors such as soil
moisture, rainfall, N deposition, N fertilisation, carbon source, crop type or temperature is very variable and depends on the interactions of these factors with each other. A better
way to estimate and predict N2O emissions in different
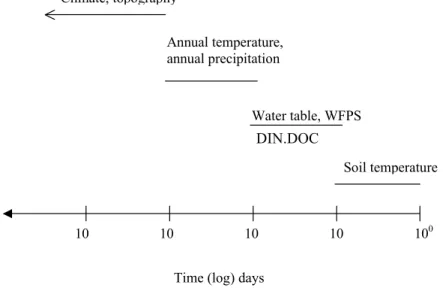
European ecosystems might be to use emission functions developed from empirical models that use broad controlling factors such as land use and climate. Figure 1 shows a clear difference between land uses such as forests or agriculture. An interactive multilayered model in which the controls would be activated by thresholds is shown in Fig. 6. These operate over different time scales. For instance, hydrology
and mean annual soil temperature are long-term site attributes that are regulated by the regional climate, topography, etc. These establish the overall potential of the
site for N2O fluxes.
Threshold values of dissolved inorganic N and DOC and WFPS are then required for actual denitrification or nitrification. Variation in these over a seasonal to weekly
time scale will affect the amount of N2O released over a
given season. Changes in these values may not immediately
affect N2O fluxes since they may operate by changing
competitive relationships among different populations of micro-organisms. Shifts in these relationships may take place after a time lag. A change in soil temperature, however,
may immediately affect N2O fluxes as it operates on the
biochemical scale. If any of the controlling factors is below
the threshold, N2O flux will not occur. This concept is similar
to that developed by Skiba and Smith (2000) for agricultural systems, and by Ulrich (1994) and Brumme et al. (1999) for forest ecosystems.
Conclusion
Nitrous oxide emissions vary widely. Results from European
studies show that N2O emissions are not strongly correlated
to precipitation whereas soil moisture levels are a major control, interacting with secondary controls such as N deposition, fertiliser use, carbon source and soil temperature. Nitrous oxide emissions will occur when these controlling factors are not limiting, i.e. above a certain threshold. Furthermore, the complexity of these interactions makes
prediction of N2O emissions and simple relationships
between fluxes and factors difficult to obtain. In order to
derive more reliable estimates of N2O emission, interactive
100 10
10
10 10
Time (log) days
Soil temperature Water table, WFPS DIN DOC Annual temperature, annual precipitation Climate, topography
Fig. 6. Major controls on denitrification and nitrification, and approximate time scale of change of importance to N2O fluxes
multilayered models are needed which describe N dynamics
and N2O emissions as function of climate and land use.
While these models are lacking, the use of emission factors such as those proposed by the IPCC (1997) or Brown et al.
(2001) offer the simplest way to estimate N2O emissions.
However, as Brown et al. (2001) show, the IPCC default values are gross approximations. Those wanting more precise estimates must resort to site-specific measurements or dynamic models such as DNDC (Li et al., 1992, 1996) or SUNDIAL (Smith et al., 1996).
Acknowledgements
This research is supported by the European Commission (Project EVK1-1999-00011), and the results are derived from collaborations between all project partners, who are listed on the project website: http://www.reading.ac.uk/ INCA. IACR-Rothamsted receives grant-aided support from the UK Biotechnology and Biological Sciences Research Council.
References
Ambus, P. and Christensen, S., 1995. Spatial and seasonal Nitrous Oxide and Methane fluxes in Danish forest, grassland, and agroecosystems. J. Environ. Qual., 24, 993–1001.
Bange, H.W., 2000. It’s not a gas. Nature, 408, 301–302. Black, A.S., Purnomo, E., Young, S.R. and Conyers, M., 1998. N
mineralisation and nitrification in crop and pasture soils. 9th
Australian Agronomy Conference, Charles Stuart University
Convention Centre.
Bouwman, A.F., 1990. Soils and the greenhouse effect, Springer, New York, 103–148.
Bouwman, A.F., 1998. Nitrogen oxides and tropical agriculture.
Nature, 392, 866–867.
Bremner, J.M. and Blackmer, A.M., 1981. Terrestrial nitrification as a source of atmospheric nitrous oxide. In: Denitrification,
nitrification, and atmospheric nitrous oxide. C.C. Delwiche,
(Ed.), Wiley, New York, 151–170.
Brown, L., Armstrong Brown, S., Jarvis, S.C., Syed, B., Goulding, K.W.T., Phillips, V.R., Sneath, R.W. and Pain, B.F., 2001. An inventory of nitrous oxide emissions from agriculture in the UK using the IPCC methodology: emission estimate, uncertainty and sensitivity analysis. Atmos. Environ., 35, 1439–1449. Brumme, R., Borken, W. and Finke, S., 1999. Hierarchical control
on nitrous oxide emission in forest ecosystems. Global
Biogeochem. Cycle, 13, 1137–1148.
Burford, J.R. and Bremner, J.M., 1975. Relationships between the denitrification capacities of soils and total water-soluble and readily decomposable soil organic matter. Soil Biol. Biochem.,
7, 389–394.
Burt, T.P., Matchett, L.S., Goulding, K.W.T., Webster, C.P. and Haycock, N.E., 1999. Denitrification in riparian buffer zones: the role of floodplain hydrology. Hydrol. Process., 13, 1451– 1463.
Davidson, E.A., 1991. Fluxes of nitrous oxide and nitric oxide from terrestrial ecosystems. In: Microbial Production and
Consumption of Greenhouse gases: Methane, Nitrogen oxides and Halo-Methanes, J.E. Rogers and W.B. Whitman, (Eds.),
219-235. Amer. Soc. Microbiol., Washington, DC.
Dobbie, K.E., McTaggart, I.P. and Smith, K.A., 1999. Nitrous oxide emissions from intensive agricultural systems: Variations between crops and seasons, key driving variables, and mean emission factors. J. Geophys. Res.: Atmos, 104, 26,891–26,899. Flessa, H., Dorsch, P. and Beese, F., 1995. Seasonal variation of
N2O and CH4 fluxes in differently managed arable soils in
southern Germany. J. Geophys. Res., 100, 23,115–23,124. Groffman, P.M., 1991. Ecology of nitrification and denitrification
in soil evaluated at scales relevant to atmospheric chemistry. In: Microbial Production and Consumption of Greenhouse
Gases: Methane, Nitrogen Oxides and Halomethanes. W.B.
Whitman and J. Rogers, (Eds.), Amer. Soc. Microbiol., Washington, DC, 201–217.
Henault, C., Devis, X., Page, S., Justes, E., Reau, R. and Germon, J.C., 1998. Nitrous oxide emissions under different soil and land management conditions. Biol. Fertil. Soils, 26, 199–207. Hutchinson, G.L. and Mosier, A.R., 1981. Improved soil cover method for field measurements of nitrous oxide fluxes. Soil Sci.
Soc. Amer. J., 45, 311–316.
IPCC (Intergovernmental Panel on Climate Change), 1997. Greenhouse Gas emissions from agricultural soils. In:
Greenhouse Gas Inventory Reference Manual, Houghton, J.T., et al. (Eds.). Revised 1996 IPCC Guidelines for National
Greenhouse Gas Inventories. IPCC/OECD/IES. UK Meteorological Office, Bracknell, UK.
Kasica, A.F., 1997. Something to grow on. A.F. Kasica and G.L. Good, (Eds.), World Wide Web designed by R.D. Scott. Lashof, D.A. and Ahuja, D.R., 1990. Relative contribution of
greenhouse gas emissions to global warming. Nature, 344, 529– 531.
Li, C., Frolking, S. and Frolking, T.A., 1992. A model of nitrous oxide evolution from soil driven by rainfall events. 1. Model structure and sensitivity. J. Geophys. Res., 97, 9759–9776. Li, C., Narayanan, V. and Harriss, R., 1996. Model estimates of
nitrous oxide emissions from agricultural lands in the United States. Global Biogeochem. Cycle, 10, 297–306.
Martikainen, P.J., Nykanen, H., Silvola, J., Alm, J., Lang, K., Smolander, A. and Ferm, A., 1994. Nitrous oxide emissions from some natural environments in Finland. In: Proceedings of
the 6th International Workshop on Nitrous Oxide Emissions, 553–
560.
Matzner, E., 1989. Acid precipitation: Case study Solling. In: Acid
precipitation, D.C. Adriano and M. Havas, (Eds.), 95-115,
Springer, New York.
Mogge, B., Kaiser, E.A. and Munch, J.C., 1998. Nitrous oxide emissions and denitrification N-losses from forest soils in the Bornhöved Lake region (Northern Germany).Soil Biol.
Biochem., 30, 703–710.
Mogge, B., Kaiser, E.A. and Munch, J.C., 1999. Nitrous oxide emissions and denitrification N-losses from agricultural soils in the Bornhoved Lake region: influence of organic fertilisers and land-use. Soil Biol. Biochem., 31, 1245–1252.
Nieminen, M., 1998. Changes in nitrogen cycling following the clear-cutting of drained peatland forests in Southern Finland.
Boreal Environ. Res., 3, 9–21.
Papen, H. and Butterbach-bahl, K., 1999. A 3-year continuous record of nitrogen trace gas fluxes from untreated and limed soil of a N-saturated spruce and beech forest ecosystem in
Germany: N2O emissions. J. Geophys. Res., 104, 18,487–
18,503.
Poth, M. and Focht, D.D., 1985. 15N kinetic analysis of N
2O
production by Nitrosomonas Europeae: An examination of nitrifier denitrification. Appl. Environ. Microbiol., 49, 1134– 1141.
Powlson, D.S., Saffigna, P.G. and Kragt-Cottaar, M., 1988. Denitrification at sub-optimal temperatures in soils from different climatic zones. Soil Biol. Biochem., 20, 719–723.
Regina, K., Nykanen, H., Silvola, J. and Martikainen, P.J., 1996. Fluxes of nitrous oxide from boreal peatlands as affected by peatland type, water table level and nitrification capacity.
Biogeochemistry, 35, 401–418.
Robertson, L.A. and Kuenen, J.G., 1991. Physiology of nitrifying and denitrifying bacteria. In: Microbial Production and
Consumption of Greenhouse Gases: Methane, Nitrogen Oxides and Halomethanes, J.E. Rogers and W.B. Whitman, (Eds.),
Amer. Soc. Microbiol., Washington, DC, 189-199.
Ruser, R., Flessa, H., Schilling, R., Steidl, H. and Beese, F., 1998. Soil compaction and fertilisation effects on nitrous oxide and methane fluxes in potato fields. Soil Sci. Soc. Amer. J., 62, 1587– 1595.
Skiba, U. and Smith, K.A., 2000. The control of nitrous oxide emissions from agricultural and natural soils. Chemosphere –
Glob. Change Sci. , 2, 379–386.
Skiba, U.M., McTaggart, I.P., Smith, K.A., Hargreaves, K.J. and Fowler, D., 1996. Estimates of nitrous oxide emissions from soil in the UK. Energ Conv. and Manage., 37, 1303–1308. Skiba, U., Sheppard, L., Pitcairn, C.E.R., Leith, I., Crossley, A.,
van Dijk, S., Kennedy, V.H. and Fowler, D., 1998. Soil nitrous oxide and nitric oxide emissions as indicators of elevated atmospheric N deposition rates in semi-natural ecosystems.
Environ. Poll., 102, 457–461.
Smith, K.A., 1997. The potential for feedback effects induced by global warming on emissions of nitrous oxide by soils. Glob.
Change Biol., 3, 327–338.
Smith, J.U., Bradbury, N.J. and Addiscott, T.M., 1996. SUNDIAL: A PC-based system for simulating nitrogen dynamics in arable land. Agro. J., 88, 38–43.
Smith, K.A., Clayton, H., Arah, J.R.M., Christensen, S., Ambus, P., Fowler, D., Hargreaves, K.J., Skiba, U., Harris, G.W., Wienhold, F.G., Klemedtsson, L. and Galle, B., 1994. Micrometeorological and chamber methods for measurement of nitrous oxide fluxes between soils and the atmosphere: overview and conclusions. J. Geophys. Res., 99, 16541–16548. Ulrich, B., 1994. Process hierarchy in forest ecosystems: An integrative ecosystem theory. In: Effects of Acid Rain on Forest
Processes, D.L. Godbold and A. Hüttermann, (Eds.), Wiley,
New York, 353–397.
Veldkamp, E., Keller, M. and Nuòez, M., 1998. Effects of pasture
management on N2O and NO emissions from soils in the humid
tropics of Costa Rica. Global Biogeochem. Cycle, 12, 71–79. Velthof, G.L., Jarvis, S.C., Stein, A., Allen, A.G. and Oenema,
O., 1996. Spatial variability of nitrous oxide fluxes in mown and grazed grasslands on a poorly drained clay soil. Soil Biol.
Biochem., 28, 1215–1225.
Webster, E.A. and Hopkins, D.W., 1996. Contributions from
different microbial processes to N2O emission from soil under
different moisture regimes. Biol. Fert. Soil, 22, 331–335. Wrage, N., Velthof, G.L., van Beusichem, M.L. and Oenema, O.,
2001. Role of nitrifier denitrification in the production of nitrous oxide. Soil Biol. Biochem., 33, 1723–1732.
Yamulki, S., Jarvis, S.C. and Owen, P., 1998. Nitrous oxide emissions from excreta applied in a simulated grazing pattern.
Appendix 1. Nitr
ous o
xide emission rates in Eur
ope, ecosystem types and soil characteristics
Country Ecosystem type Soil type Annual monitor ed parameters pH soil temp moistur e Cor g N inputs rainfall literatur e r efer enc e Measur ement period N2 O rate % Mg C/ kgN/ha mm yr -1 (kgN 2 O -N g soil ha –1 yr –1) Denmark Riparian grassland
well to poorly drained
0.66 moisture, inor ganic N, 8 8.3 57 303 -800 Ambus and 3 yrs (1990-1992) or ganic soils SOM, pH (vol.) Christensen, 1995 Spruce forest
well drained loamy sand
0.77 moisture, inor ganic N, 4 8.45 60 369 -800 Ambus and 3 yrs (1990-1992) SOM, pH (vol.) Christensen, 1995 Beech forest
well drained sandy loam
0.8 moisture, inor ganic N, 5.6 7.9 54 36.3 -800 Ambus and 3 yrs (1990-1992) SOM, pH (vol.) Christensen, 1995 Coastal grassland
well to poorly drained
1.24 moisture, inor ganic N, 7 7.25 86 120 -800 Ambus and 3 yrs (1990-1992) sandy soil SOM, pH (vol.) Christensen, 1995
Upland arable fertilised
somewhat to poorly 3.61 soil moisture, inor ganic 7.6 9.75 69 164 180 800 Ambus and 3 yrs (1990-1992) drained sandy loam N, pH, SOM (vol.) Christensen, 1995
Drained arable fertilised
poorly drained loam 4.67 soil moisture, inor ganic 7.7 10.95 77 164 11 0 800 Ambus and 3 yrs (1990-1992) N, pH, SOM Christensen, 1995 Peatlands peat soils 1.35
total N, pH, water table,
4.4 8.5 -Regina et al ., (1991-1992) or ganic P, K, Ca contents 1996 Spruce forest
peat soils underlain
1.47 total N, inor ganic N, acid 7 -6.25 607 Nieminen,
clearcutting, drainage area
by sandy till/clay soil temperature 1998 (1993-1994) or ganic Forested peatlands peat soil 1.7
total N, pH, water table,
4.4 8.5 -Regina et al ., (1991-1992) or ganic P, K, Ca contents 1996
Grass (cultivation), high N
peat soil
14.54
total N, pH, water table,
5.3 8.5 -Regina et al ., Content (1991-1992) or ganic P, K,Ca contents 1996 Agricultural, low N mineral soils 0.929 pH, soil temperature acid 8.5 -Martikainen et Deposition (1991-1992) or ganic 23.23 al ., 1994 France Agricultural 3 soils* 0.14
moisture, soil
temper-7.3 10.5 75 18.7 -Henault et al ., (seeded, unfertilised)
ature and soil nitrate
(WFPS) 1998 12 months (1994-1995) Agricultural 3 soils* 3.513
moisture, soil
temper-7.3 10.5 75 18.7 -Henault et al .,
(bare soil, herbicide)
ature and soil nitrate
(WFPS)
1998
Apppendix 1 (contd.)
Agricultural (rapeseed, 3 soils* 15.9moisture, soil
temper-7.3 10.5 75 18.7 153 -Henault et al ., suboptimally fertilised)
ature and soil nitrate
(WFPS) 1998 12 months (1994-1995) Agricultural (rapeseed, 3 soils* 18.52
moisture, soil
temper-7.3 10.5 75 18.7 257 -Henault et al ., overfertilised)
ature and soil nitrate
(WFPS) 1998 12 months (1994-1995) Germany Beech forest loamy sand 0.4
moisture, soil
temper-4 9 50 34 23.8 697 Mogge et al ., 12 months (1993) sedimentary origine
ature, nitrate, water
(wt/wt) 1998 soluble or ganic C Grassland, N input sedimentary origine, 1.5
soil moisture, nitrate,
6.4 11.5 30 16.5 78 697 Mogge et al ., 12 months (1993) loamy sand pH, soil temperature, (wt/wt) 1999 water soluble or ganic C Maize monoculture, sandy soil 2.1
soil moisture, nitrate,
5.4 11.5 50 12.1 319 697 Mogge et al .,
Cattle slurry fertilised
pH, temperature, (wt/wt) 1999 12 months (1993) water soluble or g. C Spruce forest
very acid hapludalf
2.18 soil ammonium and 3.5 6.65 33.5 -30 800 Papen and 3 yrs (1994-1996)
nitrate, soil moisture
(WFPS) Butterbach-Bahl, and temperature 1999 Beech forest
very acid hapludalf
3.81 soil ammonium and 4 6.65 33.5 -20 800 Papen and 3 yrs (1994-1996)
nitrate, soil moisture
(WFPS)
Butterbach-Bahl,
and temperature
1999
Black Alder forest
forest soil on peat
4.9 pH, moisture, soil 4 9 70 422 69 829 Mogge et al ., 12 months (1993) temperature, nitrate, (wt/wt) 1998 water soluble or ganic C Agricultural loamy sand 5.3 soil water , nitrate, 6.4 11.5 50 12.8 79 697 Mogge et al .,
(crop rotation field),
temperature,
(wt/wt)
1999
farmyard manure fertilised
water soluble or ganic C 12 months (1993) Arable, fertilised
sandy and clay soils
13.08 soil temperature,nitrate, 6.1 -16.9 124 833 Flessa et (FYM, CaNH4NO3) moisture al ., 1995 12 months (1993) UK Sitka Spruce forest brown forest soil 0.35
pH, moisture, soil nitrate
3.9 10 29 -58 800 Skiba et al ., 3 yrs (1992-1994) and ammonium, (wt/wt) 1996 soil temperature
Apppendix 1 (contd.)
Long term grass sward
poorly drained 0.359 moisture, pH, soil 5.5 11 -1050 Y amulki
Plots with dung and urine
si
lty clay loam
temperature,soil et al ., 1998 15 months (1994-1995) available NO3-N, NH4-N Pine forest brown forest soil 0.36
pH, moisture, soil nitrate
3.5 11 34 -10 800 Skiba et al .,
Sitka Spruce, N inputs 3 yrs
and ammonium, (wt/wt) 1996 (1992-1994) soil temperature Birch forest
brown forest soil
0.6 4.9 10 26 -10 800 Skiba et al ., 3 yrs (1992-1994) (wt/wt) 1996 Mowed grass
brown forest soil
0.88 soil moisture, pH, 4.8 11 30 -10 800 Skiba et al ., 3 yrs (1992-1994) available ammonium (wt/wt) 1996 and nitrate Alder forest
brown forest soil
1.32 4.2 9 25 -60 800 Skiba et al ., 3 yrs (1992-1994) (wt/wt) 1996 Riparian zone
mostly clayey alluvium
5 water table, groundwater -13.08 -Burt et al ., 12 months (1994-1995) nitrate and ammonium 1999 agricultural
sandy clay and loam,
9.35 soil temperature, -7.95 66 -330 850 Dobbie et al .,
Intensively managed 3 yrs
loam, clay loam moisture, SOM, (wt/wt) 1999 (1996-1998) mineral N
‘-‘ Data not determined or not published *: typic rendzic leptosol, gleyic luvisol, eutric leptosol Temperatures are annual means except for the following studies: Henault
et al. , 1998 (3 months), Martikainen et al. , 1994 (9 months), Regina et al. , 1996 (9 months)

![[PDF] Support de Cours complet en à HTML | Cours informatique](data:image/gif;base64,R0lGODlhAQABAIAAAP///wAAACH5BAEAAAAALAAAAAABAAEAAAICRAEAOw==)