HAL Id: hal-00296896
https://hal.archives-ouvertes.fr/hal-00296896
Submitted on 8 Mar 2006
HAL is a multi-disciplinary open access
archive for the deposit and dissemination of
sci-entific research documents, whether they are
pub-lished or not. The documents may come from
teaching and research institutions in France or
abroad, or from public or private research centers.
L’archive ouverte pluridisciplinaire HAL, est
destinée au dépôt et à la diffusion de documents
scientifiques de niveau recherche, publiés ou non,
émanant des établissements d’enseignement et de
recherche français ou étrangers, des laboratoires
publics ou privés.
Rainfall events and Hailstorms Analysis Program
(RHAP)
M. Ceperuelo, M. C. Llasat, T. Rigo
To cite this version:
M. Ceperuelo, M. C. Llasat, T. Rigo. Rainfall events and Hailstorms Analysis Program (RHAP).
Advances in Geosciences, European Geosciences Union, 2006, 7, pp.205-213. �hal-00296896�
European Geosciences Union
© 2006 Author(s). This work is licensed under a Creative Commons License.
Geosciences
Rainfall events and Hailstorms Analysis Program (RHAP)
M. Ceperuelo1, M. C. Llasat1, and T. Rigo2
1Department of Astronomy & Meteorology, Faculty of Physics, University of Barcelona, Spain 2Meteorological Service of Catalonia, Generalitat de Catalunya, Spain
Received: 7 October 2005 – Revised: 23 January 2006 – Accepted: 23 January 2006 – Published: 8 March 2006
Abstract. RHAP (Rainfall events and Hailstorms Analysis
Program) is a new tool designed for analysing rainfall events and hailstorms. The aim of this contribution is to present the RHAP tool, which is under development, and its application to different hailstorms and rainfall episodes. The program as-similates multiple data bases (meteorological radar, meteoro-logical model outputs, radiosondes and surface observations) with the purpose to get better event reanalysis. It is based on Storm Cell Identification and Tracking Algorithm (SCIT) with an improved version of the method, and also on a new 2-D algorithm which automatically identifies and classifies the precipitation systems distinguishing between Mesoscale Convective Systems, Multicellular systems, Isolated convec-tion, Stratiform precipitation and Convective precipitation embedded in stratiform precipitation. These two methods allow to obtain the 2-D and 3-D features of the precipita-tion system like top height of the cells, maximum reflectiv-ity, Vertical Integrated Liquid content (VIL) and VIL density (VILD), kinetic energy, severe hail probability (SHP), num-ber of 3-D cells exceeding a given threshold, Z/R relations,. . . that are useful to analyse both heavy rainfall and hail events. As application, two events produced on NE Spain are dis-cussed: the heavy rainfall event recorded on 6 September 2004, characterised by a great number of cells that crossed the affected area and that had a maximum activity associated to high values of VIL(37.5 kg/m2), Zmax(54 dBZ) and SHP
(73%); and the hail event produced on 29 August 2004, with a rapid development of the convective system and with hail observations in surface when the following thresholds were exceeded: Zmax=54 dBZ, VIL=25 kg/m2and SHP=63%.
1 Introduction
The northeast of Spain region (the Mediterranean coast and the Ebro Valley) is usually affected by heavy rainfall events Correspondence to: M. Ceperuelo
(ceperuel@am.ub.es)
(Llasat and Rodriguez, 1992; Ramis et al., 1994; Llasat et al., 2003) and hailstorms (Font, 1983; L´opez, 2003). Some works have been done in this region in order to charac-terise the heavy rainfall events (Rigo and Llasat, 2004) and hail events (Pascual, 2000; L´opez, 2003), usually associated to well organized convective systems, and classifying them (Fraile et al., 2001; S´anchez et al., 2003; Rigo, 2004; Rigo and Llasat, 2004).
However, one of the problems to analyse heavy rain-fall and hail events is how to integrate the multiple kinds of data: meteorological model, meteorological radar, ra-diosonde, satellite, lightning, surface observations,... To analyse or reanalyse these events it is necessary to take a look at all these information with the purpose to explain the rea-sons why it happened. This is usually done with different programs, methods and applications, e.g. programs devel-oped to obtain radiosonde indexes (e.g. RAOB, RAwinsonde OBservation program), to analyse meteorological radar data (e.g. TITAN, Thunderstorm Identification, Tracking, Analy-sis and Nowcasting), etc.
Considering the problem of integrating different data and that the northeast of Spain is affected by hail and heavy rain-fall events, a new tool for analysing these events is being de-veloped and it is presented in this paper. The Rainfall events and Hailstorms Analysis Program (RHAP) has been created in order to improve the analysis, tracking and nowcasting of convective structures in hail and rainfall events by the assimi-lation of different kinds of data. Nowadays, RHAP integrates meteorological radar data, MM5 meteorological model out-puts, radiosonde data and surface observations (hailpads and observers information). Moreover, RHAP gives the possi-bility to realize three different types of event analysis based on the precipitation structures identification by the meteoro-logical radar, considering 2-D convective and stratiform re-gions (Steiner et al., 1995; Bigerstaff and Listemaa, 2000; Rigo, 2004), 3-D convective cells (Dixon and Wiener, 1993; Johnson et al., 1998; Rigo, 2004) and integrated precipitation systems (Fraile et al., 2001; S´anchez et al., 2003; Rigo and Llasat, 2004).
206 M. Ceperuelo et al.: Rainfall events and Hailstorms Analysis Program (RHAP)
Figure 1. Study area and locations.
21
Fig. 1. Study area and locations.
In addition, RHAP can also be used for teaching new fore-casters or as a forecaster tool to nowcast an event (future ver-sion of the program). Finally, the program code is written in Interactive Data Language in its version 6.0 (IDL 6.0) and can work under different operative systems.
Firstly the program is introduced. Next, the different kind of data and formats and the interface of the program are shown. Then, the most important algorithms, improved ver-sions and the new algorithms used are explained. After that, two case studies produced in Catalonia are analysed: the hail event of 29 August 2004 recorded in the province of Lleida (Fig. 1), with hailstones larger than 25 mm in diameter and eighteen affected hailpads; and the heavy rain event of 6 September 2004 recorded in Cambrils (Fig. 1), with amounts of precipitation in three hours greater than 150 mm. Finally, the conclusions have been explained.
2 The data used and program interface
The RHAP software has been designed to read and to inte-grate radar data, meteorological model outputs (wind field, ground temperature, accumulated rainfall, relative humid-ity. . . ), radiosonde observations, ground observations and hailpads observations. This tool can operate using informa-tion provided by different meteorological radars, with differ-ent formats. All the information needed to add a new type of radar is the radar information: location, time and spatial resolution, number of CAPPIs and heights and type of pro-jection.
In this work, radar data have been provided by the radars of Barcelona and Zaragoza, from the Instituto Nacional de Meteorolog´ıa (INM), the radar of the University of Leon at
Table 1. MM5 parameterisations for the heavy rainfall and hail
event.
Parameterisation D1 D2 D3
Moisture scheme Reisner2 Reisner2 Reisner2
Cumulus scheme BM KF Non
PBL scheme MRF MRF MRF
Radiation scheme Cloud Cloud Cloud Soil scheme 5-Layer 5-Layer 5-Layer
Shallow convection No No No
Zaragoza, and the three radars of the Meteorological Ser-vice of Catalonia (METEOCAT). Data format are McIdas, TITAN and IRIS, respectively.
On the other hand, the hail formation and heavy rain events usually are local events and they depend on the orography of the zone and on the environmental conditions which can trigger the convection that will produce the severe weather phenomena. It is to say that synoptic scale is not sufficient to study convective phenomenon and the use of a meteorologi-cal model is required to obtain mesosmeteorologi-cale circulation (Llasat et al., 1997). In the RHAP case, the MM5 meteorological model has been used. MM5 allows reanalysing the event with different kind of parameterizations of convection and orography (Table 1). At the moment, data used in RHAP are MM5 meteorological model outputs with one hour of time resolution and eight kilometres of horizontal resolution. The files used are grid files for wind field at different levels (925, 850, 700 and 500 hPa), ground temperature, relative humid-ity, accumulated rainfall, among others.
Otherwise, the vertical observation of the atmosphere is an important technique to obtain the instability of the atmo-sphere with instability indexes (Brooks and Craven, 20021; L´opez, 2003). RHAP integrates these thermodynamic obser-vations with radar data to obtain more parameters to identify a hail or a heavy rain event: VIL of the day (VOD), Kinetic Energy Flux, Waldvogel parameter, Hail probability (person-alised relations), Severe Hail Probability (SHP), Maximum Expected Hail Size, Severe Hail Index and Warning Thresh-old. To do that, the program has an algorithm that realize the analysis of the radiosonde observation obtaining values of the instability indexes: total of totals (TTI), Showalter in-dex (SI), K inin-dex (KI), SWEAT inin-dex, CAPE (Convective Available Potential Energy), wind shear, precipitable water, etc. Presently, the application works with two kinds of ra-diosonde formats: the University of Wyoming format and the METEOCAT format. Nevertheless it could work with any kind of radiosonde observation.
Furthermore, to study a hail or heavy rain event, surface observations as rainfall, hailpads or subjective observations
1Brooks, H. E. and Craven, J. P.: A database of proximity
sound-ings for significant severe thunderstorms, 1957–1993, Preprints, 21st Conference on Severe Local Storms, San Antonio, TX, Amer. Meteor. Soc., 639–642, 2002.
are needed (Schleusener and Jenings, 1960; L´opez, 2003). For this reason they have also been integrated in RHAP. The hailpad network used along this paper belongs to the “Asso-ciaci´o de Defensa dels Vegetals” of Lleida (Fig. 1), which is composed by 170 hailpads. The network density is close to 1 hailpad per 16 km2and gives, among others, values of maximum hail size, ice mass, kinetic energy and number of impacts per m2.
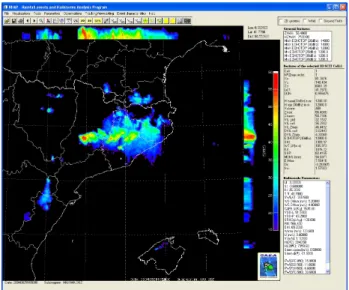
Finally, the interface of the program (Fig. 2) is based on a menu with interactive applications and buttons which make RHAP dynamics. It also offers the availability of multiple representations using the different applications. The product is composed by the representation area, X and Y projections of the maximum reflectivity, legend information and tables with obtained values of different interactive options: general features of the radar data, features of the selected 2-D struc-ture, 3-D cell or precipitation system and radiosonde param-eters.
3 Parameters and algorithms
The objective of RHAP is to analyse rainfall and hail events. That is the reason why the program has included a great num-ber of radar parameters to identify severe weather: Maximum reflectivity, Z/R relation (Marshall and Palmer, 1948), Beta parameter (Llasat et al., 2005), VIL “Vertical Integrated Liq-uid” (Greene and Clark, 1972), VILD “VIL density” (Am-burn and Wolf, 1997), VOD “VIL of the Day” (San Ambro-sio, 2005; Paxton and Shepherd, 1993), H45 “Waldvogel Pa-rameter” and HP “Hail Probability” (Waldvogel et al., 1979; Holleman, 2001), SHP “Severe Hail Probability” (Witt et al., 1998), MEHS “Maximum Expected Hail Size” (Witt et al., 1998), kinetic energy (Waldvogel et al., 1978; and Witt et al., 1998) and ECHOTOPS of 20, 30 and 40 dBZ. All these pa-rameters are obtained and are included in the 3-D cells and precipitation systems characterisation.
The most important algorithms of RHAP have been di-vided in three different methods: 2-D structures, 3-D cells and Precipitation Systems.
3.1 2-D structures
The algorithms are based on Steiner et al. (1995), Biger-staff and Listemaa (2000) and Rigo and Llasat (2004) and the objective of them is to identify areas with convective or stratiform precipitation. Firstly, the identification algorithm searches for those zones over a threshold reflectivity (43 dBz) and they are assigned as convective pixels. Then, it searches for those pixels that satisfy a gradient criteria and the algo-rithm assign them as convective. After that, it searches for pixels in smaller radius than rc, where rc is a threshold
ra-dio which depends on the reflectivity value of the considered pixel (see Steiner et al., 1995 for more details). Next, the algorithm applies a correction for convective and stratiform pixels based on the bright band. Finally, it searches for those regions with an area over a threshold value.
Figure 2. RHAP interface.
22
Fig. 2. RHAP interface.
In the case of the 2-D structures tracking method, the correlation method (Collier, 1989; Circe and Mart´ın, 2003; Rigo, 2004) which searches for similar and nearly structures in the previous time has been used.
3.2 3-D cells
The 3-D cells identification algorithm is based on the SCIT-Storm Cell Identification and Tracking method (Johnson et al., 1998) and on the work of Rigo (2004). It works in vol-ume mode. Firstly, it searches for 2-D cells in each level that satisfy the threshold reflectivity condition (30, 35, 40, 45, 50, 55 and 60 dBz) and covers an area greater than the area con-dition (24 km2). Then, the 2-D cells of each level are con-nected with a distance condition requisite (8 km). The fea-tures of the identified 3-D cells are: volume, index, centroid position (x, y, z, latitude and longitude), maximum reflectiv-ity, mean reflectivreflectiv-ity, top high, base high, VIL (grid, cellular and Zmax), VILD (grid, zmax), kinetic energy, severe hail
probability, maximum expected hail size, tilt, maximum axis and orientation.
The tracking algorithm of 3-D cells is a combination of Dixon and Wiener (1993) and a RHAP algorithm. Firstly, the algorithm identifies the 3-D cells and their features. Then, an extrapolation to the previous time position is done using the radar time resolution and the mean grid wind, which is ob-tained as a medium value of the 925, 850, 700 and 500 hPa meteorological model winds. After obtaining the first pre-vious position, the method searches in prepre-vious real radar data for the 3-D cell that satisfies the TITAN condition (for more details see Dixon and Wiener, 1993). All 3-D cells are tracked using this criterion.
Finally, when a 3-D cell has been tracked, it is possible that it could be the time evolution of different cells. It is to say that the first cell detected could develop one more cell in its dissipating phase but the tracking algorithm considers this
208 M. Ceperuelo et al.: Rainfall events and Hailstorms Analysis Program (RHAP)
Table 2. Automatic classification of precipitation systems.
Precipitation System Horizontal Dimension Convective percentage Duration MCS d>100 km Convective area (CA) >30% t>3 h
MUL 50 km<d<200 km CA>30% –
ISO d<50 km CA>30% –
EST-EMB d>0 km 5%<CA<30% –
EST d>0 km CA<5% –
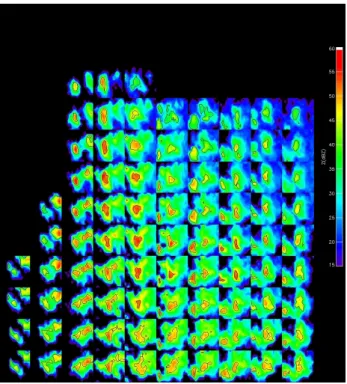
Figure 3. 2D contour (black line) at each level of the tracked northern 3D hail cell of 29 August 2004 between 16:20 and 17:50 UTC.
23
Fig. 3. 2-D contour (black line) at each level of the tracked northern
3-D hail cell of 29 August 2004 between 16:20 and 17:50 UTC.
newer cell as the same cell that the previous one. To solve this problem a tracking reanalysis based on VIL parameter evolution has been proposed. The method is based on the ver-tical distribution of the 3-D cell reflectivities (Fig. 3). After obtaining the tracked 3-D cell, the algorithm searches those zones of the cell life cycle where VIL parameter has strong fluctuations. This only occurs when the vertical distribution of reflectivities has been changed. It implies that different cells have been detected.
3.3 Precipitation systems
The Precipitation systems identification is based on 2-D structures identification after applying the 2-D algorithms de-scribed before. An automatic classification of all the precip-itation system identified is being done with a new algorithm developed and taking into account the Rigo and Llasat (2004) classification, which is based on the area, percentage cov-ered by the convective precipitation and duration of the
sys-tem. By this way, the systems can be classified as mesoscale convective systems (MCS), multicellular system (MUL), iso-lated convection (ISO), convective precipitation embedded in stratiform precipitation (EST-EMB) and stratiform precipita-tion (EST). The automatic classificaprecipita-tion proposed is shown in Table 2, the program searches for 2-D regions and then it classifies each region as a system. Moreover, RHAP al-lows characterising the precipitation systems, obtaining the present features: type of system, area, percentage of con-vective precipitation area, centroid position, maximum axis, number and identifier of 3-D cells and number and identifiers of 3-D cells with reflectivity greater than 50dBZ, maximum reflectivity, mean reflectivity of 3-D cells maximum reflec-tivity, echotop mean value, mean value of 3-D cells bases, maximum VIL value and maximum VILD value of 3-D cells. The tracking method of the precipitation systems is based on the correlation method which searches for similar regions in the previous image, as the 2-D structures case. An exam-ple of the precipitation system tracking is shown in Fig. 4 where some precipitation system variables have been drawn.
4 Case studies
Two different case studies have been analysed in order to test the program: the hail event of 29 August 2004, which af-fected the hailpad covered area of Lleida and produced hail-stones with 25.41 mm diameter, and the heavy rain event of 6 September 2004, which affected the town of Cambrils pro-ducing three deaths and recorded a maximum accumulated rainfall of 158.2 mm.
The general circulation and mesoscale reanalysis of the events have shown that:
1. The hail event was a typical storm-forming situation with a thermal low over the Iberian Peninsula and a cold front that crossed the north of Spain. The mesoscale reanalysis showed south-western wind flow and maxi-mum surface temperatures over hailpad area. The mois-ture advection to the zone, the wind blowing towards the Pre-Pyrenees mountainous system and the moment after the maximum of solar irradiance triggered the con-vection (Fig. 5).
2. The heavy rain event was characterised by the pres-ence of a deep low centred over the Iberian Penin-sula and an important presence of a cold air at upper
Figure 4. Radar parameters evolution of the precipitation system of the 6 September 2004 Cambrils heavy rain event: Convective precipitation area percentage (CA), number of 3D cells belonging to the precipitation system (n3D), maximum reflectivity (Zmax), vertical integrated liquid (VIL), vertical integrated liquid density (VILD) and maximum horizontal dimension (d).
24
Fig. 4. Radar parameters evolution of the precipitation system of the 6 September 2004 Cambrils heavy rain event: Convective precipitation
area percentage (CA), number of 3-D cells belonging to the precipitation system (n3-D), maximum reflectivity (Zmax), vertical integrated
liquid (VIL), vertical integrated liquid density (VILD) and maximum horizontal dimension (d).
Figure 5. Trajectory (grey line) and area covered (yellow) from 16:20 to 1840 UTC for the northern cell and from 17:10 to 18:40 UTC for the southern cell. 60 minutes nowcasting (black) of the 3D cells. Ground hail observations and 925 hPa wind are also shown.
25
Fig. 5. Trajectory (grey line) and area covered (yellow) from 16:20
to 18:40 UTC for the northern cell and from 17:10 to 18:40 UTC for the southern cell. 60 min nowcasting (black) of the 3-D cells. Ground hail observations and 925 hPa wind are also shown.
levels. The mesoscale reanalysis showed an eastern and south-eastern wind flow that blew towards the Pre-littoral mountainous system providing moisture advec-tion over the affected area of Cambrils and high temper-atures near the Mediterranean Sea (Fig. 6).
Figure 6. Trajectory, area covered (2230-2320 UTC) and nowcast (60 minutes) of one of the heaviest cells of the heavy rainfall event. 925 hPa wind is also shown.
26
Fig. 6. Trajectory, area covered (22:30-23:20 UTC) and nowcast
(60 min) of one of the heaviest cells of the heavy rainfall event. 925 hPa wind is also shown.
From a thermodynamic point of view, both events were characterised by the instability indexes (Table 3) obtained for the Lleida radiosonde. The hail event was characterised with instability indexes as high as CAPE=7635.8 J/kg and TTI=48.7, and high values of precipitable water mass in low levels (15 kg/m2 in SFC-850 hPa layer). In the heavy rain case, the CAPE value was very low (65.0 J/kg) and the pre-cipitable water content in low levels (11.8 kg/m2)was lower,
210 M. Ceperuelo et al.: Rainfall events and Hailstorms Analysis Program (RHAP)
Table 3. Lleida Radiosonde parameters for hail event and heavy rain event.
Hail event Heavy Rain event (29/08/2004 – 12:00 UTC) (06/09/2004 – 12:00 UTC)
Radiosonde Parameter Value Value
Lifted Index −3.0 −3.2
Showalter Index −0.6 −1.7
K Index 25.3 23.3
Total of Totals Index 48.7 51.8
SWEAT index 355.5 285.3
Wind Shear 0–6 km (m/s) 5.2 7.0
Wind Shear 0–1 km (m/s) 4.8 7.4
CAPE (J/kg) 7635.8 65.0
VIL of the Day: VOD “Lewis III” (kg/m2) 51.5 48.8
VOD “Paxton and Shepherd” (kg/m2) 43.2 40.1
Wmax(m/s) 123.6 11.4 0◦C height (m) 3940.5 4140.9 −20◦C height (m) 7359.6 6952.9 Precipitable water: SFC-850 (kg/m2) 15.0 11.8 Precipitable water: 850–700 (kg/m2) 11.0 9.0 Precipitable water: 700–500 (kg/m2) 4.6 3.5 Precipitable water: SFC-300 (kg/m2) 31.0 24.8
Table 4. Life time evolution of some radar parameters of the northern 3-D hail cell of the hail event from 18:40 UTC to 16:20 UTC: Maximum
reflectivity (Zmax), Vertical Integrated Liquid (VIL), VIL density (VILD), Kinetic energy (KE), Severe hail probability (SHP) and Maximum
expected hail size (MEHS).
Time (UTC) Hail Zmax(dBZ) VIL (kg/m2) VILD (g/m3) KE (J/m2) MEHS (mm) SHP (%)
18:40 No data 47.2 7.8 1.2 60.2 7.43 18.3 18:30 No data 50.0 14.6 1.7 193.6 21.10 44.6 18:20 No data 52.0 16.7 1.5 224.5 22.46 46.2 18:10 No data 48.4 11.3 1.5 130.4 14.80 35.7 18:00 No data 51.2 11.8 1.3 140.2 11.61 29.6 17:50 No data 50.8 15.5 1.8 233.7 23.63 47.5 17:40 No 54.0 26.0 3.0 547.1 49.41 66.0 17:30 Yes 56.8 32.8 3.7 777.0 60.68 71.2 17:20 No 53.2 24.1 2.7 484.7 46.39 64.4 17:10 Yes 56.0 26.1 3.0 562.3 46.57 64.5 17:00 Yes 57.2 34.8 3.2 762.8 63.70 72.4 16:50 Yes 56.4 46.4 4.3 1076.2 94.70 82.4 16:40 Yes 59.2 46.6 4.3 1099.1 102.37 84.4 16:30 No 48.4 8.0 1.5 84.1 9.72 25.1 16:20 No 47.6 5.3 1.6 62.5 2.96 0.0
but there were no valid for the Cambrils case due to the ra-diosounding of Lleida is far from the Mediterranean Sea in-fluence on this event.
Using radar data, we have been focused on those precip-itation systems and 3-D cells that produced hail (in hailpad covered area for the case of 29 August 2004) and those that produced heavy rains (Cambrils cells on 6 September 2004). 1. In the 29 August 2004 case, the hail observations were produced by two different cells, the northern one
(Ta-ble 4) and southern one (Ta(Ta-ble 5), which moved par-allel from northwest to southeast (Fig. 5) following the mean wind direction obtained by the MM5 meteorologi-cal model. The associated precipitation system that pro-duced hail in the northern cell begun as an EMB-EST system at 16:10 UTC. Then it developed into an ISO system at 16:20 UTC and at 16:30 UTC it merged with a MUL system, moment where hail in surface was ob-served. At 17:00 UTC, the system that produced hail in
Table 5. Life time evolution of some radar parameters of the southern 3-D hail cell of the hail event from 18:40 UTC to 17:10 UTC:
Maximum reflectivity (Zmax), Vertical Integrated Liquid (VIL), VIL density (VILD), Kinetic energy (KE), Severe hail probability (SHP) and
Maximum expected hail size (MEHS).
Time (UTC) Hail Zmax(dBZ) VIL (kg/m2) VILD (g/m3) KE (J/m2) MEHS (mm) SHP (%)
18:40 No data 45.6 2.8 1.2 21.8 0.00 0.0 18:30 No data 51.6 7.9 1.8 138.8 2.15 0.0 18:20 No data 58.8 23 2.6 558.0 23.77 47.6 18:10 No data 58.8 37.8 4.3 998.1 64.53 72.8 18:00 No data 55.2 19.8 2.7 399.6 37.85 59.3 17:50 No data 54.0 18.9 3.0 416.2 23.80 47.6 17:40 No 50.4 17.1 1.9 273.0 29.55 53.1 17:30 Yes 54.0 25.1 2.8 532.2 44.75 63.5 17:20 Yes 55.6 31.8 3.6 772.9 53.2 67.9 17:10 Yes 56.8 34.4 3.9 870.6 49.37 66.0
Table 6. Life time evolution of some radar parameters of the heaviest 3-D cell of the Heavy rain event. From 22:30 UTC to 23:20 UTC:
Maximum reflectivity (Zmax), Vertical Integrated Liquid (VIL), VIL density (VILD), Kinetic energy (KE), Severe hail probability (SHP) and
Maximum expected hail size (MEHS).
Time (UTC) Zmax(dBZ) VIL (kg/m2) VILD (g/m3) KE (J/m2) MEHS (mm) SHP (%)
23:20 50.4 5.2 2.6 154.1 0.00 0.0 23:10 54 22 2.1 407.4 28.29 50.7 23:00 52.4 26.8 2.1 491.6 45.72 62.8 22:50 51.2 27.3 2.2 451.5 50.64 65.3 22:40 53.2 37.5 3.0 747.0 68.75 73.0 22:30 41.6 1.0 0.7 1.5 4.92 6.6
the southern cell begun to develop and it was classified as an ISO system. At 17:10 UTC, it merged with the MUL system of the northern cell, and hail observations were produced. The MUL system lasted till 17:50 UTC, when it evolved as an ISO system. At 18:30 UTC, the system changed to a MUL system but it rapidly disap-peared. Summarising the precipitation systems analy-sis, the hail observations in both cases were produced by a MUL system which lasted between 50 and 80 min. Analysing the 3-D convective cells, the hail obser-vations in hailpad area were produced from the be-ginning of the storm formation due to the rapid de-velopment induced by the high atmospheric instabil-ity. The hailpad observations were produced with val-ues of Zmax>54 dBZ, VIL>25 kg/m2, HP>92% and
SHP>63%. In no hailpad covered area there were mo-ments where all this conditions were fulfilled; probably they observed hail phenomenon but there were no sur-face observations.
2. In the heavy rain event of Cambrils, the amount of precipitation was produced by different cells that moved from the Mediterranean Sea to the coast from 20:00 UTC to 23:50 UTC. These cells had a south to north movement which was blocked by the Littoral
mountainous system. The cells were characterised by a short life cycle (30–60 min) and not very high values of reflectivity (40–54 dBz). Figure 6 shows the area cov-ered by one of the heaviest cell that contributed to the event. That cell (Table 6) was characterised by maxi-mum Zmax value of 54 dBZ, VIL value of 37.5 kg/m2
and SHP value of 73%. On the other hand, the pre-cipitation system that produced heavy rain (Fig. 4) be-gun as an ISO system at 19:50 UTC and it lasted till 21:00 UTC. At 21:10 UTC, it evolved to a MUL sys-tem which affected the Cambrils area till 2250UTC. At 23:00 UTC, the precipitation system changed to an EMB-EST system. Then it experienced some changes of size and convective precipitation which induced mod-ifications in the type of system classification (EMB-EST to MUL and MUL to EMB-EST). At 23:50 UTC the MUL system begun to move in south-west direction far from Cambrils zone.
5 Conclusions
In this contribution the Rainfall events and Hailstorms Anal-ysis Program has been presented. RHAP has improved the meteorological event analysis merging multiple kinds of
212 M. Ceperuelo et al.: Rainfall events and Hailstorms Analysis Program (RHAP) data: meteorological radar data, meteorological model
out-puts, radiosonde observations and ground observations. It has been designed to analyse heavy rainfall and hail events, nevertheless, it can be used to study any kind of severe weather event. The most important applications of RHAP are the identification, characterisation and tracking of an event and the possibility to improve the nowcasting of radar pa-rameters. The main tool of RHAP is the convective struc-tures analysis, where different kind of studies can be carried out: 2-D structures, 3-D convective cells and precipitation systems. This last one has been shown as a new automatic method for analysing the event.
To test the program, two different case studies have been analysed: the heavy rainfall event of 6 September 2004 and the hailstorm event of 29 August 2004. The analysis of the respective convective cells and precipitation systems has al-lowed obtaining different features:
– The heavy rain event has been a stationary case with
a great number of cells crossing the affected area dur-ing 3 h. On the other hand, the hail event has had a northwest-southeast 100 km displacement.
– In the case of hail event, the cells have had a rapid
devel-opment with a long life cycle. Nevertheless, the heavy rain event has had a short life cycle of 3-D cells.
– The hail systems have been characterised by the fast
de-velopment of the convective system, forming multicel-lular systems with fast increasing of reflectivity values. The heavy rain event has been characterised with the slow development of the cells which have been intensi-fied close to the coast.
– In the heavy rain case, some hail observations could be obtained comparing values of the 3-D convective cells characterisation. High val-ues of VIL, Zmax, HP and SHP have been
ob-served (VIL=37.5 kg/m2, Zmax=54 dBZ, SHP=73% and
HP=100%) which are greater than the ones obtained from the hail event: Zmax>54 dBZ, VIL>25 kg/m2,
HP>92% and SHP>63%.
To conclude, RHAP has been shown as a new tool to im-prove the events reanalysis. The easy way to obtain features and identification of 3-D cells and precipitation systems has allowed differentiating between the hail and heavy rain cases. Moreover, the tracking analysis has made possible to identify the long-lived 3-D cells of the hail event and the short-lived 3-D cells of the heavy rain event.
Acknowledgements. The authors thank the MONEGRO (REN2003-09617-C02-02) Spanish project and to AMPHORE Interreg IIIB project, for enabling the drawing up and presentation of this contribution. Our thanks to the Associaci´o de Defensa dels Vegetals, Maite Tor`a and Marta Masot, to the Meteorological Service of Catalonia of the Generalitat de Catalunya and to the Instituto Nacional de Meteorolog´ıa for the hailpad data, radiosonde data and radar data and, finally, thanks to the University of Le´on and the observers of Arag´on for ground truth data.
Edited by: V. Kotroni and K. Lagouvardos Reviewed by: T. Karacostas
References
Amburn, S. and Wolf, P.: VIL Density as a Hail indicator, Weather and Forecasting, 12, 473–478, 1997.
Biggerstaff, M. I. and Listemaa, S. A.: An Improved Scheme for Convective/Stratiform Echo Classification Using Radar Reflec-tivity, J. Appl. Meteorol., 39, 12, 2129–2150, 2000.
Circe, M. and Martin, F.: Automatic identification and tracking of convective structures from meteorological radars (In Spanish: Identificaci´on y seguimiento autom´atico de estructuras convec-tivas a partir de datos de radares meteorol´ogicos), Nota t´ecnica, STAP No. 39, 2003.
Collier, C. G.: Applications of Weather Radar Systems, Ellis Hor-wood, London, 1989.
Dixon, M. and Wiener, G.: Thunderstorm Identification, Tracking, Analysis and Nowcasting – A Radar-based Methodology, J. At-mos. Oceanic Technol., 10, 6, 785–797, 1993.
Font, I.: Climatological Atlas of Spain (in Spanish: Atlas Clim´atico de Espa˜na), INM and Ministerio de Transportes, Turismo y Co-municaciones, Madrid, 296, 1983.
Fraile, R., Castro, A., S´anchez, J. L., Marcos, J. L., and L´opez, L.: Noteworthy C-band radar parameters of storms on hail days in north-western Spain, Atmos. Res., 59–60, 41–61, 2001. Greene, D. R. and Clark, R. A.: Vertically Integrated Liquid: a new
analysis tool, Mon. Wea. Rev., 100, 548–552, 1972.
Holleman, I.: Hail detection using single-polarization radar, Sci-entific report WR-2001-01, Royal Netherlands Meteorological Institute (KNMI), 2001.
Johnson, J. Y., MacKeen, P. L., Witt, A., Mitchell, E. D., Stumpf, G. J., Eilts, M. D., and Thomas, K. W.: The Storm Cell Identifi-cation and Tracking (SCIT) Algorithm: An Enhanced WSR-88D Algorithm, Weather and Forecasting, 13, 263–276, 1998. Llasat, M. C., Gibergans, J., Guilbaud, S., and Rodr´ıguez, J. Y.:
The use of the vertical thermodynamic data in the daily clas-sification: application to the improvement of an analog tech-nique, INM/WMO International Symposium on Cyclones and Hazardous Weather in the Mediterranean, Palma de Mallorca, 395–402, 1997.
Llasat, M. C. and Rodriguez, R.: Extreme rainfall events in Catalo-nia: the case of 12 November 1988, Nat. Hazards, 5, 133–151, 1992.
Llasat, M. C., Rigo, T., and Barriendos, M.: The “Montserrat-2000” flash-flood event: a comparison with the floods in the Northeast-ern Iberian Peninsula since the 14th century, Int. J. Climatol., 23, 453–469, 2003.
Llasat, M. C., Rigo, T., Ceperuelo, M. ,and Barrera, A.: Estima-tion of the convective precipitaEstima-tion: the meteorological radar ver-sus an automatic raingauge network, Adv. Geosci., 2, 103–109, 2005.
L´opez, L.: Atmospheric severe convection: forecasting and identi-ficating hailstorms (in Spanish), Doctoral Thesis, University of Le´on, 2003.
Marshall, J. S. and Palmer, W. M. K.: The distribution of raindrops with size, J. Meteor., 5, 156–166, 1948.
Pascual, R.: Study of hailstorms in the Lleida region (in Spanish). Technical note no 3, Regional Meteorological Centre of Catalo-nia, 2000.
Paxton, C. H. and Shepherd, J. M.: Radar Diagnostic Parameters as Indicators of Severe Weather in Central Florida, NOAA Tech. Memo. NWS SR-149, 12, 1993.
Ramis, C., Llasat, M. C., Genov´es, A., and Jans`a, A.: The October-1987 floods in Catalonia: synoptic and mesoscale mechanisms, Meteorol. Applicat., 1, 337–350, 1994.
Rigo, T.: Study of Occidental Mediterranean Convective Mesoscale Systems using meteorological radar (in Spanish), Doctoral The-sis, University of Barcelona, Internal publication, 2004. Rigo, T. and Llasat, M. C.: A methodology of convective structures
using meteorological radar: application to heavy rainfall events on the Mediterranean coast of the Iberian Peninsula, Nat. Haz-ards Earth Syst. Sci., 4, 59–68, 2004.
S´anchez, J. L., Fern´andez, M. V., Fern´andez, J. T., Tudur´ı, E., and Ramis, C.: Analysis of mesoscale convective systems with hail precipitation, Atmos. Res., 67–68, 573–588, 2003.
San Ambrosio, I.: Radar-based module for hail estimation (in Span-ish), STAP Technical Note no. 44, 2005.
Schleusener, R. A. and Jenings, P. C.: An energy method for relative estimates of hail intensity, Bull. Amer. Meteor. Soc., 41, 372– 376, 1960.
Steiner, M., Houze Jr., R. A., and Yutter, S. E.: Climatological Char-acterization of Three-Dimensional Storm Structure from Opera-tional Radar and Rain Gage Data, J. Appl. Meteor., 34(9), 1978– 2007, 1995.
Waldvogel, A., Federer, B., Schmid, W., and Mezeix, J. F.: The kinetic energy of hailfalls, Part II. Radar and hailpads, J. Appl. Meteorol., 17, 1680–1693, 1978.
Waldvogel, A., Federer, B., and Grimm, P.: Criteria for the detec-tion of hail, J. Appl. Meteorol., 16, 1521–1525, 1979.
Witt, A., Eilts, M. D., Stumpf, G. J., Johnson, J. T., Mitchell, E. D., and Thomas, K. W.: An enhanced hail detection algorithm for the WSR-88D, Weather and Forecasting, 13, 286–303, 1998.