Detecting and Molecular Profiling Cancer Cells in Patients
by
Vanessa M. Peterson
B.S. Chemical Engineering University of Notre Dame, 2003
Submitted to the Department of Chemical Engineering in partial fulfillment of the requirements for the degree of
Doctor of Philosophy in Chemical Engineering s
MASSAL.HISE-$ SINS E
I OF TECHNOLOGY
at the
---MAR
2
52014
Massachusetts Institute of Technology
September 2013
1
IBRARIES@ Massachusetts Institute of Technology.
All rights reserved.
Signature of Author ... ... ... ...
Department hemical Engineering
/Jug-2 013
C e rtifie d b y ...
Ralph Weissleder Director of Center for Systems Biology, MGH Thepis Supvisor C e rtifie d b y ...
Rc Langer
David H. Koch Institute Professor Thesis supervisor A cce pte d by ... . . . ... . .
Patrick Doyle Professor of Chemical Engineering Chairman, Committee for Graduate Students
Detecting and Molecular Profiling Cancer Cells in Patients
by
Vanessa M. Peterson
Submitted to Department of Chemical Engineering on July 16, 2013 in Partial Fulfillment of the Requirements for the Degree of
Doctor of Philosophy in Chemical Engineering
Abstract
Although tumor cells obtained from human patients by surgical biopsy, image-guided intervention, blood draws or fluid drainage (paracentesis, thoracentesis) are a valuable source for analyzing tumor cells, conventional means of proteomic analysis are limited. Highly sensitive and quantitative technologies for point-of-care and multiplexed analysis on small sample sizes are in great demand. To this end, we developed three technologies to improve our understanding of the molecular signatures of cancer in clinical samples.
In the first section, we describe a diagnostic magnetic resonance (DMR) device that was developed for point-of-care analyses of human tumors. We optimized a magnetic nanoparticle assay to improve sensitivity and robustness of the DMR approach. The DMR device was tested by analyzing samples from 50 patients. The results were then validated in an independent cohort of 20 additional patients. DMR enabled quantification of multiple protein markers in all patients. Using a four-protein signature enabled us to achieve 96% accuracy for establishing cancer diagnosis, surpassing conventional clinical analysis by immunohistochemistry. Results also show that protein expression patterns decay with time, underscoring the temporal need for
rapid sampling and diagnoses. Also, a surprising degree of heterogeneity in protein expression both across different patient samples and even within the same tumor was observed, which has important implications for molecular diagnostics and therapeutic drug targeting.
In the second section we molecularly profiled tumor cells in ascites - peritoneal fluid frequently drained for symptomatic relief in advanced ovarian cancer (OvCA)
patients. First, we profiled a comprehensive panel of 85 biomarkers in ovarian cancer and benign cell lines. From this data set, 31 markers were identified and profiled in a training set of human ascites samples (n=1 8). We identified an ascites-derived tumor
signature termed ATCdx containing four markers which was then validated in a cohort of
47 patients (33 ovarian cancer and 14 control) and correctly identified all 33 ovarian cancer patients. Serial samples were obtained from a subset of patients' serial samples (n=7) and profiled, demonstrating that ATCs can be used to measure treatment
response and differentiate responders from non-responders. Finally, we specifically designed a novel microfluidic enrichment chip that allows rapid visualization of cancer
cells in heterogeneous ascites fluid. This chip requires small sample volumes (< 1 mL) and has single cell detection sensitivity. Furthermore, it is inexpensive to construct and can be easily fabricated using soft lithographic techniques, providing a point-of-care method that could potentially find widespread use for ATC analyses and diagnosis.
In the final section, a multiplexed proteomic assay using a photocleavable DNA barcoding method was developed to multiplex protein detection in single cells. We tested 94 antibodies against common cancer markers to examine different treatment responses and heterogeneity at the single cell level. We then extended our analysis to human clinical samples to demonstrate the potential of protein-based measurements to assist in monitoring cancer therapy through differential changes before and after
treatment. We show that protein based tumor profiles can provide sufficient information to predict treatment response. Finally, we examined interpatient variability and
intratumoral heterogeneity of single cells with this highly sensitive assay.
Together, these technologies can help overcome current clinical limitations and expedite advancements in cancer treatment.
Thesis Supervisors:
Director of the Center for Systems Biology, Ralph Weissleder (MGH) Koch Institute Professor, Robert Langer (MIT)
Acknowledgements
It has truly been a journey in which I would never have been able to venture alone. I can't express enough gratitude for all the help and support from family, friends, and colleagues along the way.
First and foremost, I would like to thank my thesis advisors, Ralph and Bob for being generous with their time and providing guidance throughout my thesis construction. A special thanks to Ralph for giving me the opportunity to work in his lab at MGH as well as the many resources he made available during my research. I learned so much from his clinical and translational perspective, never losing sight of the big picture. Despite his busy schedule, he always made the time to meet whenever I needed him. His high efficiency, organization, and quick turnaround time on revisions never ceased to impress me. Hopefully, some of that has rubbed off on me.
Next, I would like to thank my thesis committee members, Kristala Prather and Cesar Castro for their scientific input on my projects. They offered intellectual insight by
providing constructive feedback and sharing their expertise during our meetings. Cesar, thank you so much for our lengthy discussions. It was always so helpful to brainstorm and learn with you. You even took time to answer personal questions on cancer and connected family and friends with top-notch doctors. Your altruistic nature and continual willingness to help won't be forgotten.
Merck, for the amazing opportunity to go back to school through the doctoral assistance program, I am eternally grateful. Thank you John Lepore for all your patience and support through this 'longer-than-expected' journey through graduate school.
Although my thesis committee provided me with tools to complete a successful
dissertation, the friends I met during this time deserve equal mention. These are people with whom I shared the highs and lows of my Ph.D. on a daily basis. I was lucky to be surrounded by such great labmates that were extremely intelligent, but more importantly
patient, generous, and caring people. Jered Haun, for taking me under your wing when I first joined the lab and providing me with a strong foundation in biological research, for your unwavering patience and cheerfulness always made the lab atmosphere enjoyable, you are thought of highly. Thank you Greg Thurber and Jonathan Carlson, for always taking the time to answer my questions with thorough explanations. Jonathan, I appreciate all your computer technical support despite my disorderly and frustrating laptop settings. Also, I can never thank you enough for connecting my sister with such a fantastic surgeon
and oncologist in Ohio.
Adeeti, aka Ethel, I will never forget our "I Love Lucy" chocolate factory moments in lab when we would start laughing so hard that we would end up crying. It made lab work fun
even when we would take on way more than we could handle and end up sprinting to the T to catch the last train home. I will never forget all our NanoString memories.
Undoubtedly, these are the moments I will first think of when I look back on graduate school.
Nathan, Tuang, and Maria, it was such a pleasure to work with you in the lab. I couldn't have done it without all your help. You consistently surpassed my expectations. I know you have bright futures in medical school along with all other endeavors you pursue.
I want to thank the Teresa's in my life. All the 15 minute talks really added up over the
past 5 years and have helped make this journey an enjoyable one that I wouldn't trade in for the world. I am thankful for the growth and indispensable tools that have filled me with gratitude and an awareness for all the gifts life presents us with every day.
Most importantly, I wanted to thank my family. Especially to my mother and father, who from an early age instilled in me the importance of education and a strong work ethic. They always led by example and took the time out of their busy schedules to go above and beyond the role of parents. They were my teachers, coaches, and number one fans throughout my life. They always made sure that school was a priority amongst all the soccer practices, games, and tournaments that consumed the majority of my time.
Getting quizzed on my multiplication factors while practicing soccer in the backyard ended up being early training for the balance needed to propel me in school. Although there have been some changes over the past few years, your love and support for me has never wavered. The memories we shared together will always be looked back upon with smiles and deep love.
I also wanted to thank my older sister Stephanie who has continuously helped pave the
way for me. The advice you gave me throughout graduate school was invaluable and much appreciated. My younger brother Kevin, it was a pleasure getting to live so close to you during this time. It was always a real comfort knowing you were just around the corner. I will never forget our fun pick-up soccer league memories that were always nice break from school work.
Last but not least, I wanted to thank my husband and best friend, Ryan for all his patience and support throughout my Ph.D. You always believed in me more than I did in myself. I know all the late nights and weekends in lab must have been difficult for you in our first few years of marriage. I appreciate your caring concern and eagerness to listen. Thank you for all the reminders that thesis research is a learning experience and curing cancer is not a requirement. You know how to keep me grounded and never fail to bring a smile to my face with your humor. Your lunchtime and dinner visits were always well needed refreshing breaks. I appreciate the numerous times you went out of your way to adjust to my difficult to predict schedule and erroneous estimations when experiments would finish. Your continuous passion to learn and help others is contagious. I have learned so much from you throughout these years and continue to do so. All of our mindfulness and savoring discussions helped me to stay present and positive throughout my Ph.D work.
I wanted to dedicate this thesis in memory of my cousin and godmother, Liz
Schermerhorn. Your laughter and smile always filled the room. The fun family picnics, badminton games, and blue cheese jokes are memories that will always be cherished.
I am lucky to have such a loving family (extended family, grandparents, uncles, and aunts)
without whose support I could not have embraced this experience. Thank you to all of
Table of Contents
Abstract
...
2
Acknow ledgem ents
...
3
List of Figures
...
10
List of Tables
...
16
Chapter
1...
17
Introduction 1.1 Thesis Organization... 17
1.2 Clinical needs in cancer field ... 18
1.2.1 Protein expression patterns in cancer... 18
1.2.2 Clinical sources of cancer cells... 19
1.2 .3 T reatm e nt response ... . . 20
1.2 .4 Technolog ical needs... . . 2 1 1.3 Diagnostic Magnetic Resonance (DMR) Technology ... 22
1 .3 .1 D M R D e v ic e ... 2 3 1.3.2 M agnetic nanoparticles ... 25
1.3.3 C ellular M agnetic labeling ... 26
1 .3 .4 N M R th e o ry ... 2 7 1.4 Microfluidic technology ... 28
1.5 DNA barcoding Technology... 30
Chapter 2...
35
Optimized Diagnostic Magnetic Resonance (DMR) Assay A b stra ct ... . . 3 5 2 .1 Intro d uctio n ... . 3 6 2.2 Materials and Methods ... 37
2.2.1 Preparation of cleavable pegylated Tz and TCO nanoparticles (NPs)... 37
2.2.2 Preparation of TCO-modified antibodies...39
2 .2 .3 N anopa rticle labeling ... . . 39
2 .2 .4 D M R m easurem ents ... 40
2 .2 .5 F low cyto m etry ... 4 1 2 .2 .6 M ic ro s c o p y ... 4 2 2 .2 .7 C lin ica l sa m ple s... . . 4 2 2.3 Results and Discussion ... 43
2.3.1 New labeling strategy for high detection sensitivity... 43
2.3.2 Improved robustness and sensitivity through cleavage ... 45
2.3.3 Multiple amplification rounds yield higher SNRs... 47
2.3.4 Application to Clinical Samples... 50
2.4 Disscusion and Conclusions ... 52
Chapter 3...
54
DMR Technology applied to Fine Needle Aspirate (FNA) Clinical Study A b s tra c t ... 5 4 3 .1 Intro d u ctio n ... . 5 5 3.2 Materials and Methods ... 57
3.2.2 S am ple processing ... 59
3.2.3 Preparation of trans-cycloctene (TCO)-modified antibodies. ... 59
3.2.4 Preparation of tetrazine (Tz) modified magnetic nanoparticles (MNPs)...60
3.2.5 MNP targeting and detection by nuclear magnetic resonance ... 61
3.2.6 The pNMR device and its operation...62
3 .2 .7 S ta tis tic s ... 6 3 3.3 Results and Discussion ... 64
3.3.1 Cellular samples can be quantitated ... 64
3.3.2 Heterogenous protein expression levels across epithelial tumors ... 67
3.3.3 Diagnostic sensitivity, specificity, and accuracy of cancer markers...68
3.3.4 Confirmation in independent test set... 71
3.3.5 Comparison to the standard-of-care ... 72
3 .3 .6 O the r m a rke rs ... 7 3 3 .3 .7 V a ria b ility ... 7 4 3.4 Conclusions ... 76
Chapter 4...
82
Profiling Ascites Tumor Cells (ATCs) reveals reliable targets for detection using a novel point-of-care microfluidic chip A b stra ct ... . 8 2 4 .1 Intro d uctio n ... . 8 3 4.2 Material and Methods ... 85
4.2.1 Patient population and analyses ... 85
4.2.2 Cell culture ... 87
4.2.3 Bulk ascites processing for more extensive profiling ... 88
4.2.4 C D 45 P urification Step ... 89
4 .2 .5 C e ll L a b e lin g ... 9 0 4 .2 .6 F low C yto m etry ... 9 1 4 .2 .7 S tatistical analysis ... . . 9 1 4.2.8 ATC device fabrication ... 93
4.2.9 Processing cells through the ATC chip ... 94
4.3 Results and Discussion ... 95
4.3.1 Experim ental approach ... 95
4.3.2 Unique marker expression in a training set of human ascites samples ... 99
4.3.3 Prospective ATC profiling in a test set of human ascites samples ... 102
4.3.4 Serial testing to measure treatment response in individual patients...104
4.3.5 Differentiating responders from non-responders...106
4.3.6 Ascites specimen cellular composition ... 107
4.3.7 ATC enrichment and detection using a point-of-care microfluidic chip...109
4 .4 C o n c lu s io n s ... 1 10
Chapter
5...114
Multiplexed DNA Barcode Protein Assay for Molecular Profiling Cancer Cells A b s tra c t...1 1 4 5 .1 In tro d u ctio n ... 1 1 5 5.2 Materials and Methods ... 116
5 .2 .1 C e ll lin e s ... 1 1 6 5 .2 .2 C lin ica l sa m p le s...1 17 5 .2 .3 D rug tre atm e nts...1 18 5 .2 .4 F low cyto m etry ... 1 18 5.2.5 Synthesis of photocleavable DNA-antibody bifunctional linker ... 119
5.2.6 D N A -A ntibody conjugations...120
5.2.7 Antibody storage and characterization ... 122
5 .2 .8 Linke r o ptim izatio n ... 12 3 5 .2 .9 Lysis o ptim izatio n ... 12 6 5.2.10 Antibody staining and DNA collection for protein profiling...127
5 .2 .11 F luo re sce nt read-o ut ... 12 9
5.2.12 Single cell isolation and processing ... 130
5.2.13 Calculating proteomic expression profiles...130
5 .2 .14 C lu ste rin g ... 1 3 0 5 .2 .15 S ta tistica l a n a lysis ... 13 1 5.3 Results and Discussion ... 132
5 .3 .1 S ing le ce ll se nsitivity ... 134
5.3 .2 Intratum or heterogeneity ... 135
5 .3 .3 Inte rpatie nt hete rogene ity...136
5.3.4 Treatment response monitoring ... 139
5 .4 C o n c lu s io n ... 14 3
Chapter 6...144
Conclusions and Recommendations A b s tra c t...14 4 6 .1 S u m m a ry ... 14 5 6 .1 .1 C h a p te r 2 ... 14 5 6 .1 .2 C h a p te r 3 ... 14 7 6 .1 .3 C h a p te r 4 ... 14 8 6 .1 .4 C h a p te r 5 ... 14 9 6.2 Recommendations for future work ... 149
References...152
A ppendix A...164
A ppendix B
...
167
List of
Figures
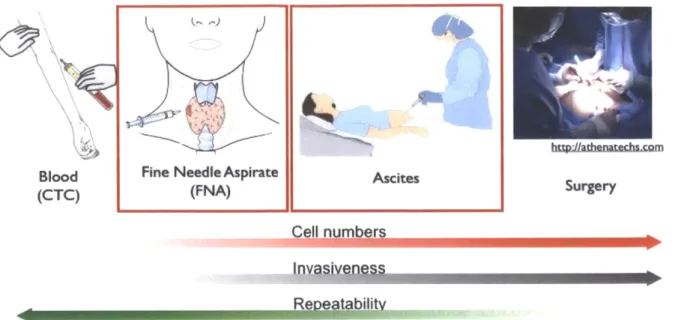
Figure 1- 1. Potential sources of cancer cells in clinical samples; circulating tumor cells (CTCs), fine
needle aspirates (FNA), ascites, and surgery. The main focus of this thesis is on fine needle aspirates (Chapter 3 and Chapter 5) and ascites (Chapter 4) samples. From left to right the typical number of cancer cells obtained from these samples increase. However, the invasiveness of the procedure also increases while the repeatability decreases. Exceptions to this trend are the similar repeatability and invasiveness features between ascites and FNA's ... 20
Figure 1-2. DMR system. (A) The schematic of the DMR system consists of a miniaturized microcoil for
NMR measurements, microfluidic networks for sample handling and mixing, embedded NMR electronics, and a permanent magnet for polarizing magnetic field generation. The microcoil generates RF magnetic fields to excite samples and receives the resulting NMR signal. The NMR electronics that is designed to perform Ti and T2 measurements via inversion-recovery and CPMG pulse sequences, respectively. (B)
The complete DMR-3 system for near-patient use. The bottom component contains all the electronic circuitry for NMR measurements while the top enclosure holds a permanent magnet and chip-sized, pL-v o lu m e s e n s o rs ... 2 4
Figure 1-3. Principle of magnetic targeting assay. Cells can be targeted with magnetic particles to alter
the magnetic properties of surrounding water molecules. Magnetic nanoparticles cluster upon binding to targets which decrease the spin-spin relaxation time (T2) of surrounding water protons. DMR
measurements are shown in the bottom graphs where T2 decreases when MNP clusters are present...26 Figure 1-4. Schematic of perturbation of hydrogen nuclei magnetic moments. (A) The magnetic
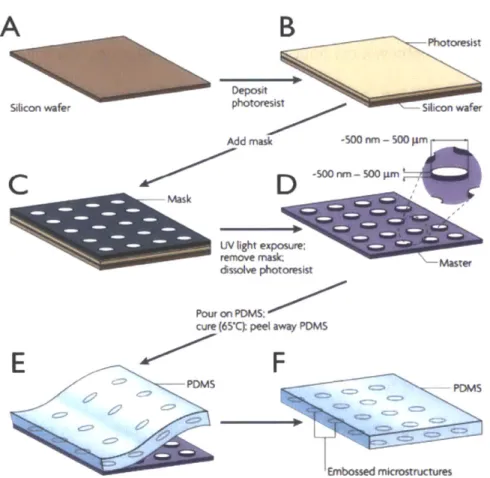
moments of the hydrogen nuclei in water molecules originally start off aligned in the permanent magnetic field of the DMR device in the z-direction. (B) Then the magnetic moments are pushed into the xy plane when an alternating current is passed through the microcoil of the device. (C) The magentic moments eventually become out of phase with each other. (D) The decrease in the magnetic field in the xy plane (Mxy) over time is fitted to an exponential decay curve to determine the relaxation time, T2. (35)...28 Figure 1-5. The fabrication of micropatterns using soft lithographic techniques. (A-B) A silicon
wafer is spin-coated with photoresist. (C) A mask is placed on the photoresist layer. (D) The photoresist layer is then crosslinked by exposure to ultraviolet (UV) light. Then an organic solvent is used to dissolve the photoresist that was hidden under the mask and not crosslinked. This results in a master mold consisting of a silicon wafer with a pattern made of photoresist. (E) Then poly(dimethylsiloxane) (PDMS) is poured on the master, cured, and peeled away. (F) The final product is a PDMS layer consisting of micropatterns that can range in size from nanometer to micrometers. (42) ... 30 Figure 1-6. Schematic of NanoString Assay. (A) Schematic representation of the capture probe and the
reporter probes bound to the target mRNA molecule. (B) (i)The target-probe complex is captured to the streptavidin coated surface via the biotin at the end of the capture probe. (ii) Then biotinylated
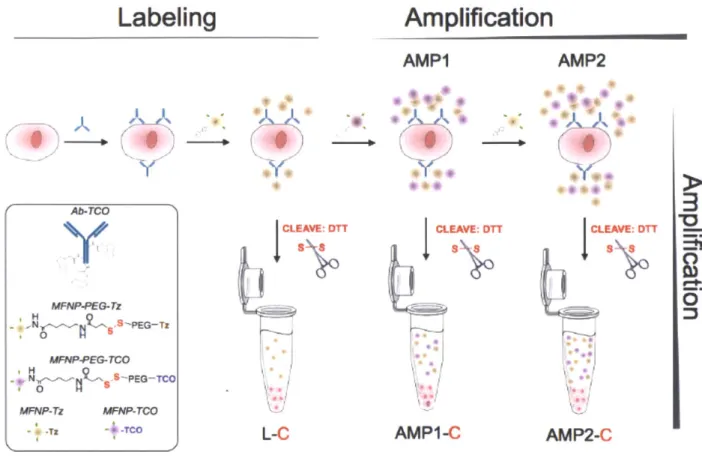
complementary sequences to the 5' repeat section of the reporter probe are added and (iii) a voltage is applied so that the target-probe complex lays flat on the surface of the cartirdge. (C) Then the analyzer takes an image of the surface and counts the number of unique reporter probes present. (43)...32 Figure 1-7. Overview of the NanoString's digital profiling technology for mRNA. (A) NanoString's Technolog uses two probes, a reporter probe and a capture probe. The capture probe allows the target-probe complex to be immobilized for data colection and the reporter target-probe contains the flourescent barcode signal. (B) The reporter and capture probe hybridize with the target mRNA in solution (C) After the hybridization step, the excess probes are removed and (D) the target-probe complex is immoblized on the nCounter cartridge using the Prep station. (E) The surface is imaged and the barcodes are then counted and tabulated for each target molcule usng the Digital analyzer. (44)... 34 Figure 2-1. Schematic of the labeling strategy used to amplify biomarker signals. The labeling step (L) refers to the initial antibody-trans-cyclooctene (TCO) conjugate binding to the target followed by the addition of magneto-fluorescent nanoparticles (MFNPs) conjugated to the orthogonal reactant, tetrazine
(Tz) . The signal can be subsequently amplified through additional rounds of complementary orthogonal
MFNP conjugates (AMP1, AMP2) and through cleavage/purification using dithiothreitol (DTT; AMP1-C,
A M P 2 -C ). ... 4 4
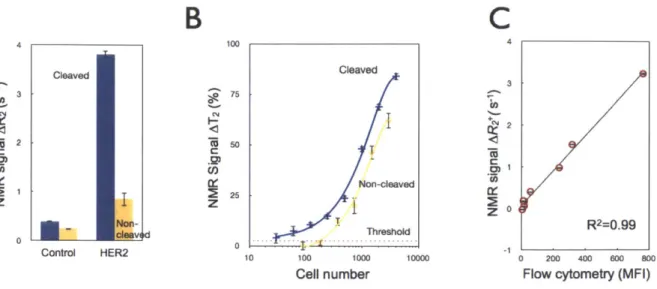
Figure 2-2. Effect of nanoparticle (NP) PEGylation on signal-to-noise ratio (SNR). (A) Flow cytometry experiments comparing SK-OV-3 cells (in the absence of the primary antibody labeling step) incubated with either MFNP-PEG-Tz (green) or MFNP-Tz (orange) for 15 minutes to determine nonspecific cellular binding. PEGlyated particles displayed significantly reduced nonspecific cellular binding. (B) Dose response graphs of specific cellular (i.e. HER2 targeting) versus nonspecific cellular binding with different NPs. With PEGlayted MFNPs (left panel), non-specific binding is kept at a minimum non-significant level, whereas the non-specific binding increases in a dose-dependent manner with non-PEGlayed MFNPs (right panel). (C) The overall signal-to-noise ratio (SNR) with PEGlyated (green) and non-PEGlyated (o ra n g e ) M F N P s . ... 4 5 Figure 2-3. Comparison of the cleavage method to whole cell detection. (A) Comparative NMR
signals for HER2-targeted SK-OV-3 cells using the cleave (blue) versus the non-cleave (yellow) method
(-3,500 cells); control samples were incubated with NPs alone. (B) Detection sensitivity of SK-OV-3
cancer cells using the AMP1 and AMP1 -C methods (See Figure 2-1). Note the -10-fold increase in detection sensitivity following the cleavage method. Data are expressed as a mean ± standard deviation.
(C) Comparative detection between the NMR-based cleavage method and flow cytometry demonstrated
an excellent correlation (R2 = 0.99). Expression levels of four markers (EGFR, EpCAM, HER2, MUC1)
across two model cell lines (SK-OV-3, SK-BR-3) were pooled together. NMR detection was performed on
-3,500 cells whereas flow cytometry used -35,000 cells. MFI: mean fluorescent intensity ... 47
Fig 2-4. Comparison of successive amplification rounds. (A) Fluorescent signals detected from the
initial labeling step and for each subsequent amplification step showed excellent co-localization, confirming that multiple MFNP layers can be applied to cellular targets for signal amplification. The MFNP-cleaved cells displayed negligible fluorescent signal, suggesting maximal MFNP release into suspension. The scale bar represents 30 pm. (B) Comparative NMR signal for HER2-targeted SK-OV-3 cells (3,500 cells). AMP2-C conferred the largest increase in SNR but AMP1-C had the highest SNR/unit time. (C) Cellular detection threshold for different cleavage methods (Labeling, AMP1, and AMP2; see Figure 2-1) based on HER2 targeting of SK-OV-3 cells... 49 Figure 2-5. Processing of primary clinical samples. (A) Human clinical ascites from pancreatic cancer was profiled for 4 different biomarkers: EGFR, EpCAM, HER2, and MUC1. The AMP1 labeling method was then assessed with and without the subsequent cleavage step. The cleavage step generated higher signal levels. (B) Comparison of different analytical methods (flow cytometry, diagnostic magnetic resonance) for MUC1 detection in clinical samples. Error bars represent the standard error from at least th re e N M R m e a su re m e nts...5 1 Figure 3-1. The effect of prospective preservation treatments on extracellular (A) and intracellular (B)
protein measurements. Live: live cells; FA: 2% formaldehyde; meth: 100% methanol; TX: triton X-100
0.05% in PBS, FB1: Fix buffer 1, BD Biosciences; Sap: saponin. *: optimized conditions chosen for
sub se q ue nt ex pe rim e nts ... 59 Figure 3-2. Validation of NMR measurements. Plots showing the correlation of EGFR measurements
obtained by pNMR versus ELISA, FACS or immunohistochemistry (IHC) in clinical samples where sufficient cells were available for conventional proteomic techniques (typically 105-6 for ELISA and FACS versus 102 for DMR). Note the excellent correlation coefficients for the different methods. Bottom:
representative immunofluorescent stains of a representative human sample. The primary antibody (green) was labeled with AlexaFluor-488 and TCO. The magnetic nanoparticle (red) was labeled with VT680 and Tz. Note excellent co-localization between nanoparticles (conferring NMR properties) and antibody
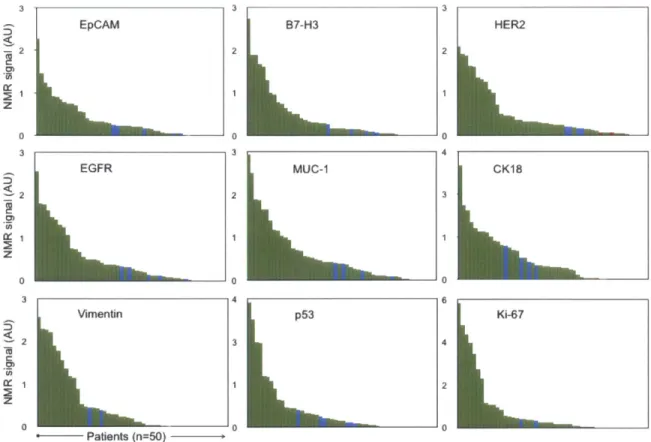
(p ro te in c o n te n t)...6 6 Figure 3-3. Biomarker expression level distribution. Waterfall plots showing the expression levels of
each of the different biomarkers sorted from high (left) to low (right). Each column represents a different patient sam ple (green = m alignant; blue = benign). ... 67
Figure 3-4. Expression levels of different biomarkers arranged by patient number. Patients 5, 12, 17, 18, 2 1, 4 2 ha d be n ig n le sio ns...6 8
Figure 3-5. Receiver operating characteristic (ROC) curves for single markers, a dual marker set, as well as for triple and quadruple marker combinations to determine optimum DMR threshold values. Az: area under the curve. 95% CL: 95% confidence lim its. ... 69
Figure 3-6. Analysis of sample heterogeneity. (A) Repeat measurement of the same samples (note the different scale compared to other graphs). (B) Measurement of repeat FNA samples obtained via the same coaxial needle. (C) Measurement of repeat FNAs from different tumor sites. (D) The effect of time at
40C before fixation (e.g. during transport to central laboratory facility) on protein measurements. Note the rapid change in expression levels in unfixed sam ples... 76 Figure 4-1. ROC analyses of training set. ROC curves were plotted for individual markers using the 13
OvCA and 13 benign samples of the training set (top). The area under the curve (AUC) and the optimal cutoff level were calculated and are summarized in the bottom table. The cutoff values were then used to determine the sensitivity, specificity, accuracy of each individual marker and the V3 and ATCdx panel ... 92
Figure 4-2. ATC chip design and measurements. (A) The layout of the ATC chip with 4 differently sized
wells (n = 4,925) for cell capture. (B) An example of captured cells (green represents DAPI staining) on m ic ro -w e lls ... 9 4
Figure 4-3. Schematic of on-chip purification and labeling. (A) First, ascites fluid is collected from the patient which contains malignant cells amongst aninflammatory milieu of host cells. (B) Ascites cells are added to the chip followed by an antibody cocktail (calretinin-Biotin, CD45-Biotin, EpCAM-FITC, Vimentin-RITC). Then streptavidin-coated magnetic particles and Anti-Rabbit Dylight 650 bind to the rabbit
biotinylated calretinin and CD45 antibodies. (C) A magnet under the inlet allows the non-magnetically labeled malignant cells to pass freely through the microchip while the benign cells are bound to the magnet. The four different size microwells (40, 30, 20,15 um) allow for capture of the malignant cells while allowing for the typically smaller leukocytes to pass through the device. (D) The ATCdx signature
(EpCAM+ and/or Vimentin+/Calretinin-/CD45-) can then be imaged to determine number of ATCs...95 Figure 4-4. Schematic approach. A total of 85 putative ovarian cancer protein markers were identified
through literature, database and other screens (top left). Markers were tested in 12 ovarian cell lines (Figure 4-5) and a subset examined in ascites from human patients (bottom left; n=65; Figure 4-6 and 4-7). A microfluidic chip (Figure 4-3) was developed for point-of-care analysis (bottom right). ... 96
Figure 4-5. Profiling of cancer cell lines. Twelve different ovarian cancer (OvCA) cell lines, and six benign cell lines (two mesothelial cell lines (LP9, LP3); two benign ovarian cell lines (TIOSE4,TIOSE6); primary human lymphocytes/neutrophils) were tested for their expression levels (A=signal/background-1) of putative diagnostic protein markers using flow cytometry. For each marker the frequency of cell lines with A >1.5 (red) are shown on right hand side of the heat map (grey bar) and are rank-ordered by abundance. The data is categorized into 4 subgroups: i) markers present in malignant cells (Unique Malignant; top left), ii) markers in malignant and benign cells (Ubiquitous, right), iii) markers in benign cells only (Benign; middle left), and iv) markers absent in both cell types (Absent; bottom left). This dataset was used to identify markers for subsequent analysis of primary human samples (Figure 4-6). Parenthesis represents different antibodies used for the same marker (Appendix A). The CD56 antibody (clone MOC-31) used in this screening was found to cross react with EpCAM therefore was not used in clin ica l sa m p le p ro filing ... 9 8
Figure 4-6. Profiling of primary human samples in training set. (A) Multicolor flow cytometry was used for gating of mesothelial (calretinin+), leukocytes (CD45+), and CD45/Calret- cells. (B) A subgroup of 31 markers identified in the cell line screen (Figure 4-5) were subsequently tested in a training set (n=19). The data are rank-ordered by abundance (yellow = lowest; red = highest). The markers were placed into four different categories: unique malignant, overlapping markers (Ubiquitous), benign, and absent using cutoffs described in the methods section. The three OvCA patients with lowest EpCAM expression levels had the highest vimentin expression levels suggestive of epithelial to mesenchymal
transition (EMT). This training set led to identification of the ATCdx panel where malignancy is defined by either having an EpCAM+ and/or V3+ (Vimentin+/Calretinin-/CD45-) signature. Heatmap values are the log ratio of the fluorescent signal over the ctrl (A=Sig/Ctrl-1) where the ctrl is the secondary antibody w itho ut the p rim a ry a ntibody. ... 100
Figure 4-7. Prospective testing of ATC marker panels in 47 patients. (A) Ascites samples were tested for the presence of 6 individual markers in 33 ovarian cancer patients (left) and 14 controls (right).
EpCAM alone was positive in 31 samples. By using the V3 marker set (Vimentin+/Calretinin-/CD45-) and EpCAM together (ATCdx), all 33 samples were correctly identified (green heat map). ATCs were identified in malignant samples, but not in benign, samples. Grey squares represent data not measured due to insufficient number of cells for flow cytometry. Color scale is same as Fig. 3. (B) Waterfall plots of the individual markers profiled in the test set. Dotted red lines represent the optimal threshold values
determ ined from ROC analyses performed on the training set. ... 103 Figure 4-8. Serial analysis of ATCs. ATCs were obtained serially from a single patient over a 14 week
treatment cycle. Carboplatin and Paclitaxel (Taxol@) were given in weeks 2 and 5, and Bevazucimab (Avastin@) was given in week 11. The number of ATCs were measured over the course of treatment (ATC burden) using ATCdx. Additionally, protein markers related to biological processes such as proliferation (Ki67, pH3, pCyclinD), mRNA translation (p4E-BP1), DNA repair (Ku80, pH2Ax, 53BP1) apoptosis (cleaved CASP3, cleaved CASP8, cleaved CASP9, cleaved PARP) and pathway inhibition (pS6RP, p53, pERK) were also measured. This demonstrates that molecular profiling of ascites can be used as a tool to monitor treatment response over the course of therapy. All samples were stained with DAPI, Calretinin, and CD45 antibodies and gated to exclude doublets, mesothelial cells, and leukocytes respectively. Data
are expressed as the average of the mean fluorescent intensity +/- SEM. ... 105 Figure 4-9. Predictive ATC markers of treatment response. Key treatment response markers are
plotted for 6 patients who were analyzed serially and either responded to treatment (left) or progressed (right). Responders typically have proliferation (Ki67, pH3, pCyclinD), mRNA translation (p4E-BP1) and protein translation (pS6RP) markers downregulated compared to the non-responders. Each marker was measured in duplicate for each time point and the error bars represent the SE. ... 107 Figure 4-10. Ascites cellular composition and volume. Ascites samples from 65 patients with (blue;
n=46) or without (green; n=1 9) ovarian cancer were analyzed for total cell number (top left), malignant cell number (bottom left; ATCs), cell volume (top right) and fraction of malignant cells compared to total cells (bottom right). Viable cells were counted using trypan blue staining and the Countess cell counter
(Invitrogen). Malignant cell number were determined using ATCdx via flow cytometry. Data are plotted as w a te rfa ll p lo ts ... 1 0 8
Figure 4-11. Design of microfluidic chip for ATC analysis. (A) A microfluidic chip, containing multiple
and differently sized cell capture scaffolds, was designed for high fluid throughput (see Figure 4-1 for details). The chip was designed to be optically transparent so that staining could be performed directly on-chip. (B) Using this device, ATCs were enriched by 57-fold, and each well was capable of capturing either one cell or clusters of cells. Staining for EpCAM (green) and CD45/Calretinin (red) for benign host cells is shown. ATCs appear larger and do not overlap with host cells...110
Figure 5-1. Synthesis of photocleavable bifunctional linker. ... 120 Figure 5-2. DNA per antibody for each Conjugate. The number of alien DNA fragments per antibody
was measured by NanoString method (shown in graph) and independently confirmed by ssDNA
quantification and Qubit protein measurement. On average there were 3-5 DNA fragments per antibody.
... 1 2 3
Figure 5-3. Scheme of DNA-antibody conjugation. (A) DNA and antibodies were linked through a photocleavable bifunctional linker. The linker was first reacted with the amine groups on the antibody for
1.5 hr at RT. After excess small molecule was removed, thiolated DNA was added at 1 Ox excess to the antibody-linker mix. The final antibody-DNA chimera was purified via both size separation and IgG
specific pulldown. DNA could subsequently be released most efficiently by photocleavage at a specific wavelength (365 nm) as shown across a number of wavelengths. A time course of the photocleavage
reaction indicates that maximal release is reached within 15 min. (B) Alternative linker strategies were investigated but not pursued further due to their reduced cleavage efficiency (DTT; linker 1: tetrazine-trans-cyclooctene click chemistry; linker 2: Traut's reagent and the photocleavable bifunctional linker). Linker cleavage was tested by measuring released DNA via NanoDrop and directly on the NanoString platform. The optimized photocleavable linker had a 2.4x greater signal compared to DTT, and over 1Ox
m o re sig na l tha n linke r 1 o r 2 . ... 12 6
Figure 5-4. Optimizing lysis and blocking methods. Four different lysis and blocking methods (A-D) were used to recover DNA from labeled cells. Lysate conditions included A) Proteinase K + PKD lysis buffer, B) Proteinase K + ATL lysis buffer, C) ATL lysis buffer alone and D) UV cleavage alone (no cell lysis). The lysate conditions were tested in duplicate (x-axis) measuring DNA signal (y-axis) and different intracellular proteins (z-axis). The best reaction condition was method B (Proteinase K + ATL lysis buffer). Using method B with a photocleavage yielded an additional 20% increase in signal. ... 127
Figure 5-5. Correlation to Flow Cytometry. (A) Bulk cell analysis from DNA barcoding shows high cancer antigen presence in ovarian cancer cell lines SKOV3 (high CD44, Her2) and ES2 (high CD44) but low cancer marker expression in benign ovarian epithelial cell line TIOSE6. (B) Results for each marker (y axis) correlate linearly with high, significant correlations for all three cell lines (SKOV3: Pearson R = 0.96,
r2= 0.89, p <.0001; ES2: Pearson R = 0.96, r2
= 0.91, p <.0001; TiOSE6: Pearson R = 0.78, r2
= 0.60, p <. 0001). In addition, profiling on SKOV3 and ES2 cell lines with DNA-conjugated antibodies, showed high
correlation to profiling with unmodified antibodies (SKOV3: Pearson R = 0.93, r2 = 0.92, p<.0001; ES2:
P earson R = 0 .85,. r2
= 0 .72 , p< .000 1). ... 129 Figure 5-6. Multiplexed protein analysis in single cells. (Left) Cells are harvested from cancer
patients by fine needle aspirate. In this case, a heterogeneous population of EpCam positive cancer cells (green) is displayed alongside mesothelial cells (red) with nuclei shown in blue (Hoechst) from an
abdominal fine needle cancer aspirate. Cancer cells were enriched and isolated via magnetic separation on microfluidic devices using both positive (e.g. EpCam/CK+) and negative (e.g. CD45-) selection. (Middle) Cells of interest are "stained" with a cocktail of DNA conjugated antibodies. The conjugates contain a photo-cleavable linker (insert; Figure 5.2) to allow DNA release after exposure to specific wavelengths of light. DNA-antibody conjugates released from lysed cells are isolated via size-separation and IgG pull down. (Right) Released "alien" DNA barcodes (Appendix C) were processed with a
fluorescent DNA barcoding platform (NanoString Technologies). Fluorescent barcodes were hybridized and imaged via a CCD camera. The quantified barcodes were translated to protein expression levels by normalizing according to DNA per antibody and housekeeping genes and subtracting non specific binding fro m c o n tro l Ig G s . ... 1 3 3 Figure 5-7. Multiplexed cell profiling. Representative example of 88 different antibodies spanning
cancer-relevant pathways are profiled in triplicate on the MDA-MB-231 triple negative breast cancer cell line. DNA signal is converted to protein binding by normalizing according to relative DNA per antibody levels. Non-specific binding from expression of six control IgGs is subtracted and expression was normalized by housekeeping proteins. Housekeeping proteins (Cox IV, Histone H3, Tubulin, Actin and
GAPDH) are shown at the far right and have consistent expression...134 Figure 5-8. Detection sensitivity. (A) 500,000 cells from the epidermoid carcinoma cell line, A431, were
lysed and processed as shown in Fig. 1. Dilutions corresponding to 5, 15, and 50 cells were then
compared to the bulk measurement, showing good correlation at low cell numbers (Spearman R = 0.98). (B) Correlation values for analyzing small cell numbers as well as single cell analysis selected by
micromanipulation. (C) Protein expression profiles (log 2 expression values) of four single cells are compared to profiles of the bulk sample. While all cells showed similar relative protein expression, single cells 1 and 2 showed nearly identical profiles to bulk measurements, whereas single cells 3 and 4 showed lower overall protein levels. Correlations were highly significant when comparing all single cells to bulk m e asure m e nts (p< .00 0 1)...135
Figure 5-9. Single-cell profiling in patient sample. A fine needle aspirate was obtained from a patient
with biopsy-proven lung adenocarcinoma. (A) Eleven harvested cells were analyzed individually, and protein expression levels in each cell (y axis) were correlated with expression levels from the bulk tumor sample (x axis). Though all of the cells show a linear trend, the spread and distribution of the markers
varies from cell to cell. (B) Spearman R correlation coefficient values are displayed for each of the single cells to each other and to the bulk measurement. Single cells showed higher correlations to each other as opposed to the bulk. This is expected, as the bulk represents an average measurement of all cells, and thus in a heterogeneous population, is less likely to correlate strongly with a single clonal phenotype. ..136
Figure 5-10. Inter-patient heterogeneity in lung cancer. Fine needle aspirates were obtained from six patients with biopsy-proven lung adenocarcinoma, and bulk samples (-100 cells each) were processed as shown in Fig. 1. Expression data is normalized by row to show differences between each patient. Patients 1, 2, and 5 showed similar protein profiles. This partially concurred with genotyping as both patients 1 and 2 had EGFR exon 19 amplification and T790m mutations. Patient 5 shows a similar profile but had a KRAS mutation. This suggests that different genotypes may result in similar proteomic
phenotypes and is consistent with the observation that both EGFR T790M and KRAS mutations are known markers for resistance to EGFR inhibitor therapy (191,192). Patients 3, 4, and 6 all had distinct proteomic profiles, and all had differing mutations. Patient 3 had an exon 20 EGFR mutation, and patient 4 had an EGFR L858R mutation and an additional BRAF mutation. Patient 6 was noted to have an EML4-ALK translocation. Protein clustering also reveals interesting personalized targets. For example, Patient 4 (EGFR/BRAF mutant) had high pERK1/2 and pS6RP as expected; however, this patient also showed a high level of PARP, Ku80 and pH2A.x, which are markers for DNA repair/damage. This suggests that PARP inhibitors or DNA damaging agents (cisplatin) could be effective in this patient. ... 138
Figure 5-11. Effect of different therapies on protein expression profiles in the triple negative breast cancer cell line MDA-MB-436. MDA-MB-436 cells were treated with different agents and marker proteins were measured. Treatment response markers for each group identified inhibition of expected proteins (p-mTOR, pS6RP, pERK for targeted treatments; pH2A.X, pATM/ATR substrate for DNA damaging agents). Furthermore, unsupervised hierarchical clustering based on euclidean distance (MATLAB) grouped drug treatments by their mechanisms of action (molecularly targeted vs. DNA-damaging) and primary targets (EGFR for Gefitinib/Cetuximab vs. mTOR/P3K for PKI-587)...139 Figure 5-12. Screen for treatment response in triple negative breast cancer cell line (MDA MB 436; BRCA1 -/-). Heat Map shows fold changes of markers grouped into various categories. Drugs cluster depe nding on m echanism of action...140 Figure 5-13. Monitoring and predicting treatment response in patients receiving P13K inhibitors.
(A) Four patients with biopsy-proven adenocarcinoma were treated with P13K inhibitors, and primary
cancers were biopsied before and after treatment. The heat map is a pre-post treatment difference map showing log2 fold changes in protein expression (normalized by row to highlight differences between patients). Patients segregate into two clusters (correlation distance metric; weighted linkage): tumors that responded and tumors that progressed. The patient in the third column received a higher dose of the P13K inhibitor (400 mg bid as opposed to 150 mg bid) and showed greater up-regulation and down-regulation across the marker panel. (B) Profiles of five drug-naive lung cancer patients are shown with clustering based on correlation metrics with weighted linkage. The patients group into responders and non-responders. A marker ranking algorithm identifies H3K79me2 as the top differential marker between responders and non-responders. The dotted box shows that this marker clusters with proteins across many protein networks including pS6RP (a downstream target of P13K), pH2A.X (DNA damage marker), PARP (DNA repair protein) and 4EBP1 (protein translation). The predictions correlated with subsequent c lin ic a l o b s e rv a tio n ... 14 2
List of Tables
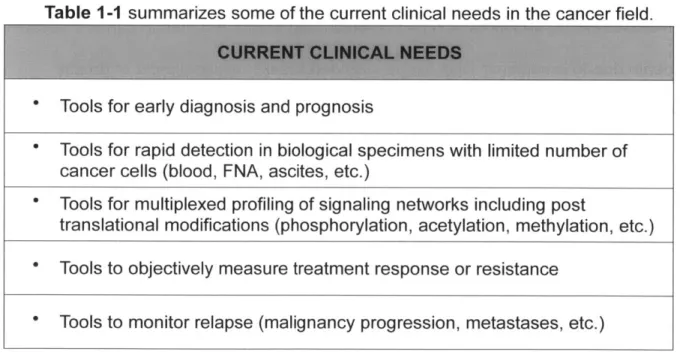
Table 1-1 summarizes some of the current clinical needs in the cancer field. ... 22
Table 3-1. Clinical information for 70 patients with suspected abdominal malignancies ... 65
Table 3-2. The sensitivity, specificity and accuracy of different markers (single or in combination)...71
Table 3-3. Verification of the diagnostic value for the four-panel markers in an independent test set of 20 p a tie n ts . ... 7 2 Table 3-4. Verification of the diagnostic value for the four-panel markers in an independent test set of 20 p a tie n ts . ... 7 3 Table 4-1. Characteristics of ovarian cancer patients (n=46). ... 86
Table 4-2. Sample numbers of different data sets...87
Table 4-3. Sensitivity, specificity, and accuracy of different protein markers in the training set ... 101
Table 4-4. Sensitivity, specificity, and accuracy of different protein markers...104
Table 5-1. Significant markers between A431 +/- gefitinib (single cells). This displays all markers that showed significant difference between gefitinib-treated vs. untreated A431 single cells and the average expression values as calculated via Nanostring Profiling for each cohort. Markers were determined by pairwise t-testing and corrected for multiple testing errors by using a false discovery rate of 0.2...132
Chapter 1
Introduction
1.1 Thesis Organization
My thesis is divided into six chapters which examine three novel platforms for
diagnosing cancers, measuring treatment response, and examining intratumoral and interpatient hetoregeneity in clinical settings. These platforms exploit three different technologies; 1) diagnostic magnetic resonance (DMR), 2) microfluidics and 3) DNA barcoding developed for robust proteomic analyses of cancer cells within scant clinical samples. DMR and microfluidics highlight point-of-care applications while DNA
barcoding enables high multiplexing.
Chapter 1 includes a literature review of existing needs for sensitive,
multiplexed, and point-of-care protein analyses in oncology with a focus on specimen-limited goals. It also provides background on the above mentioned technologies leveraged in this thesis project. Chapter 2 details the optimization of the DMR assay while Chapter 3 discusses implementation of DMR technology in the clinical setting to analyze fine needle aspirates (FNAs) from 60 patients. Chapter 4 focuses on the molecular profiling of ascites tumor cells (ATCs) from ovarian cancer patients (n=46). A diagnostic panel was identified and then leveraged using an inexpensive point-of-care microfluidic chip customized for detecting ATCs. Chapter 5 elaborates on a novel proteomic assay using antibodies conjugated to unique DNA barcodes for high multiplex measurements (>100) of protein markers. This assay uses the commercially available
NanoString technology as a readout for the unique DNA barcodes. We demonstrate the assay's high sensitivity and potential for measuring intratumoral and interpatient
heterogeniety in clinical settings. Then we extend its analytical reach by evaluating treatment response in patients. Finally, the thesis ends with Chapter 6 comprising conclusions, impact of my work, and recommendations for future studies.
1.2 Clinical needs in cancer field
1.2.1 Protein expression patterns in cancer
Due to the highly adaptive and heterogenous nature of cancer cells (1,2), it has become clear the importance of molecular profiling to classify cancers, stratify patients for molecular targeted therapies and to assess treatment efficacy (3). An expanded proteomic knowledge of clinically harvested cancer cells will potentially provide new information about tumor biology (4). An increasing number of biopsy-driven cancer trials rely on data from either: 1) genomic analyses revealing driver oncogenes and specific mutations (5) or 2) a limited number of hand-picked protein biomarkers intended to serially monitor cellular responses (6,7). Currently, there are many technologies available for high multiplexed analysis of DNA and mRNA. However, there still remains a large unmet need for proteomic tools with similar multiplexing capabilities. Moreover, mRNA levels do not always correlate with protein content (8,9) and the amount of protein produced for a given amount of mRNA depends on the current physiological state of the cell. An mRNA produced in abundance can be degraded rapidly or tranIsated inefficiently. Also, many proteins are subjected to various chemical
modifications after translation. These post translational modifications (PTMs) such as phosphorylation, ubiquitination, methylation, and acetylation are critical to protein
function and profoundly influence their activities. Variable protein levels and PTMs within tumors can directly affect drug pharmacodynamics, including the extent to which drugs engage their targets, trigger alternative molecular pathways, and induce tumor
cell death or resistance (10). Despite appreciation for the biological relevance of variable protein levels, tools to profile the landscape of key protein networks in clinical
samples are lacking.
1.2.2 Clinical sources of cancer cells
It can be expected that soon, clinical trials will incorporate collection of tumor samples at key treatment nodes; before therapy, during therapy, and at relapse. Since repeat surgical resection is impractical and potentially risky, focus has shifted towards samples, such as fine needle aspirates (FNAs) and ascites, which can be obtained less invasively and serially (Figure 1-1). Molecular profiling of these cancer cells can be useful for diagnosis, prognosis, or early readouts of treatment response, drug
resistance, disease progression, and/or disease recurrence (11). It holds promise for improving treatment success and reducing toxicity (12). A paradigm shift is needed so that each cancer patient is offered a personalized treatment plan for their unique molecular signature (13).
Blood (CTC)
Fine Needle Aspirate Ascites
(FNA)
Cell numbers
Rereatability
Figure 1- 1. Potential sources of cancer cells in clinical samples; circulating tumor cells (CTCs), fine needle aspirates (FNA), ascites, and surgery. The main focus of this thesis is on fine needle aspirates (Chapter 3 and Chapter 5) and ascites (Chapter 4) samples. From left to right the typical number of cancer cells obtained from these samples increase. However, the invasiveness of the procedure also increases while the repeatability decreases. Exceptions to this trend are the similar repeatability and invasiveness features between ascites and FNA's.
1.2.3 Treatment response
Currently, efficacy or failure of standard therapies is typically determined during or at the end of treatment. This results in many unnecessary drug side effects often without clear medical benefit. Thus, methods that predict treatment efficacy prior to administration are needed (14). Molecular profiling of specific biomarkers can help identify biological subsets of cancers with activated or deregulated pathways conferring predictive biomarkers of treatment response. As a result, the appropriate patients could be treated with the appropriate targeted therapy tailored to their unique molecular profile.
Although it is expected that cytotoxic chemotherapies will continue to anchor many cancer treatment plans, the expanding arsenal of molecular targeted agents is poised to improve treatment response and prolong disease remission. Currently, there
Sttupargernatchsc
are a number of small-molecule inhibitors and monoclonal antibodies in clinical trials and on the market that target different critical cancer pathways (2,15,16). With
sufficient molecular information, informed decisions regarding which patients to enroll in a clinical trial and what drug combinations to use can be made.
Based on molecular profiling data, patients harboring abnormalities in specific pathways can also be treated with targeted therapies to minimize toxicity. For example, if patient's cancer cells have upregulated Ras-Raf-MEK-MAPK pathway activity, MEK inhibitors such as Selumetinib (15,17) become viable options; whereas patients with P13K pathway deregulation can be treated with a P13K, Akt, or mTOR inhibitor such as
PKI-587 (18), MK-2206 (19), or Rapamycin (20), respectively. Poly (ADP-ribose)
polymerase (PARP) inhibitors (21) can be leveraged in BRCA mutation carriers to cause cell death due to unrepaired DNA single stranded breaks, accumulation of double
stranded breaks, and collapsed replication forks. EGFR is a receptor tyrosine kinase that is commonly overexpressed in cancers and targeted with gefitinib, erlotinib, or
cetuximab (22-24). The overexpression of ERBB2 has also been observed in breast and ovarian cancer patients and treated with trastuzumab or pertuzumab (25). Recent experience dictates high levels of eventual resistance. As such, identifying ideal
combination strategies using actionable predictive and pharmacodynamic biomarkers to render clinical benefit is of paramount importance (26). Achieving success here would confer a paradigm shift in our approach to treating cancer.
1.2.4 Technological needs
Highly sensitive and quantitative technologies able to detect and molecularly
(e.g. cytology or histology) are in demand. Many conventional clinical technologies are time-consuming, expensive, or require considerable sample sizes. Clinical samples are typically limited in cell number and require multiple molecular markers to help clinicians render accurate prognoses, diagnoses, or treatment plan decisions. Technologies with fast, sensitive, and multiplex measurements are needed to help monitor disease (Table
1-1). Furthermore, low cost, high-throughput, and portable platforms assembled using
standard microfabrication technology could foster transformative advances. This
chapter will next provide background on the three technologies driving this thesis work;
1) DMR, 2) microfluidic, and 3) DNA barcoding.
Table 1-1 summarizes some of the current clinical needs in the cancer field.
* Tools for early diagnosis and prognosis
* Tools for rapid detection in biological specimens with limited number of cancer cells (blood, FNA, ascites, etc.)
* Tools for multiplexed profiling of signaling networks including post
translational modifications (phosphorylation, acetylation, methylation, etc.) * Tools to objectively measure treatment response or resistance
* Tools to monitor relapse (malignancy progression, metastases, etc.)
1.3
Diagnostic Magnetic Resonance (DMR) Technology
Compared to other analytical techniques, magnetic detection enables
measurements in turbid biological samples with minimal preparation steps (27). Light-based assay methods such as bioluminescence, absorption, colorimetry, or
fluorescence (used in flow cytometry) are sensitive to materials in the sample that scatter light, absorb light or fluoresce. Diagnostic magnetic resonance (DMR) technology lacks this problem because it employs magnetic fields to generate and
detect signal. Since magnetic fields can pass through biological samples regardless of their optical properties, assays can be performed in diverse media, including whole blood and culture media (27). Standard techniques, such as Western blots, require relatively large sample sizes and often are time consuming due to the multiple
processing steps involved (e.g. cell lysis, protein denaturation, and protein separation via gel electrophoresis). These techniques are not feasible when analyzing certain heterogeneous biological samples such as FNA, ascites, or blood that contain very limited number of cancer cells (<1,000). The high detection sensitivity of DMR enables detection even in small sample sizes. The platform is also versatile and scalable to accommodate additional biomarkers of interest, it offers robust portable operation, and is relatively inexpensive compared to conventional histopathology, all key attributes for emerging nanotechnology-based diagnostics.
1.3.1 DMR Device
In the past, NMR measurements have been performed using clinical MRI
scanners or benchtop relaxometers operating at NMR frequencies of 100 kHz-50 MHz
(28,29). Benchtop systems are equipped with permanent, low field (<1 T) magnets for
field generation, which simplifies operation and equipment housing. However, the main drawback is the large sample volume needed. The DMR system was developed to overcome this limitation and has the distinct capability to perform measurements on smaller sample volumes.
The schematic diagram below (Figurel-2) shows the different parts of the DMR system used for NMR detection. With the miniaturized NMR probe and microcoil, the
requirement for spatial homogeneity of magnetic fields becomes less critical. A small portable magnet can be used to generate the magnetic field, and sample volumes are significantly reduced (-10 pl). Thus, the DMR platform can be packaged as a portable
handheld unit for point-of-care operations (27). An early prototype system, including NMR probes, RF generators, and power, weighed only 3 kg yet was over 60 times more sensitive than conventional NMR (27).
Figure 1-2. DMR system. (A) The schematic of the DMR system consists of a miniaturized microcoil for
NMR measurements, embedded NMR electronics, and a permanent magnet for polarizing magnetic field generation. The microcoil generates RF magnetic fields to excite samples and receives the resulting NMR signal. The NMR electronics are designed to perform Ti and T2 measurements via
inversion-recovery and CPMG pulse sequences, respectively. (B) The complete DMR-3 system for near-patient use. The bottom component contains all the electronic circuitry for NMR measurements while the top enclosure holds a permanent magnet and chip-sized, pL-volume sensors.
Monolithic integration of all NMR electronics in a CMOS IC chip has enabled the development of the smallest functional NMR system to date (27). Due to system
miniaturization, the detector needed to be designed to overcome two key challenges. The first issue was low signal levels due to the small sample size. The second issue was fast signal decay due to field inhomogeneity from the small, portable magnet. These two problems were solved by implementing a low noise RF amplifier with high voltage gain and development of an on-chip digital pulse generator for CPMG
sequences.
Improvements have been made to the DMR platform over the past few years of development. The latest DMR-3 has additional advanced features compared to previous
prototypes such as DMR-1 (27) and DMR-2 (30) including: a) a disposable, thin-walled sample container, which tightly slides into the coils and b) custom designed and easy to
use NMR hardware which automatically tunes measurement settings (NMR frequency, pulse width, and power) to compensate for environmental factors such as temperature fluctuations.
1.3.2 Magnetic nanoparticles
Many various properties of magnetic nanoparticles (MNP) can be optimized for use in DMR technology. One key property is relaxivity, r2, which can have a significant impact on the detection sensitivity of DMR. MNP with higher relaxivities induce larger changes in R2. This can be achieved by increasing the size of the magnetic core of the
MNP (30). However, MNP need to remain small enough so that they can still bind to
cell surface markers and permeate into cells for intracellular targeting (31). Smaller
MNP also tend to stay in solution and exhibit superparamagnetic behavior so that
spontaneous magnetic aggregation does not occur (32,33). In addition, it is important that the MNP be hydrophilic and biocompatible so that they do not induce change in the
expression profiles of cells (34). Most commercially available MNP are not well suited for DMR assays because of their large size and low relaxivity. Custom synthesized 40 nm cross-linked iron oxide (CLIO) nanoparticles have been used in our lab due to their excellent biological properties and ease of antibody modifications.
1.3.3 Cellular Magnetic labeling
The DMR sensor consists of a miniaturized NMR probe that measures the
transverse relaxation rate (R2) of water molecules in specific biological samples in which cell biomarkers are labeled with magnetic nanoparticles (30). The presence of bound or
clustered magnetic nanoparticles attached to the intended molecular target on the cell leads to a corresponding decrease in the bulk spin-spin relaxation time (T2) or an
increase in the spin-spin relaxation rate (R2=1/ T2) of surrounding water molecules (Figure 1-3). The DMR sensor measures the relaxation rate, R2, of water protons in
samples, and can be used for detecting and profiling cancer cells (30).
ON cells -a npa rds
Magnetic targeting
&
)%
Non-targeted Magnetically targeted
E3- Long T2 Short Tz
DMR
-,
meurement
T4Tf44
o a 0 )O 30 3
Figure 1-3. Principle of magnetic targeting assay. Cells can be targeted with magnetic particles to alter
the magnetic properties of surrounding water molecules. Magnetic nanoparticles cluster upon binding to targets which decrease the spin-spin relaxation time (T2) of surrounding water protons. DMR
1.3.4 NMR theory
The nuclei of hydrogen atoms in water molecules have a magnetic moment that align with the magnetic field produced by an external magnet (along the z-axis; Figure
1-4 A). An alternating current is then passed through the microcoil in the DMR device
which creates a temporary magnetic field that is perpendicular to that of the permanent magnet. This causes the magnetic moments of the hydrogen nuclei to rotate into the xy plane where they initially start off spinning in phase with each other (Figure 1-4 B). Over time they start to spin at different speeds and become dephased. The magnetic field in the xy plane, Mxy, originally starts off having a high amplitude because the
magnetic moments of the hydrogen nuclei are in phase with each other. However, Mxy
decreases over time as the individual magnetic moments of each hydrogen nuclei become out of phase (Figure 1-4 C). This change in magnetic field induces an electrical current in the microcoil which is then detected and converted into a voltage
measurement in the electronics of the DMR device. The decrease in voltage over time is then fitted to an exponential decay curve to determine the relaxation time, T2 (Figure
1-4 D). When there are magnetic nanoparticles present, the magnetic moments of the hydrogen nuclei in the water molecules lose their coherence faster resulting in a decrease in T2or an increase in the relaxation rate R2 (1/T 2).