HAL Id: hal-00842726
https://hal-brgm.archives-ouvertes.fr/hal-00842726
Submitted on 9 Jul 2013
HAL is a multi-disciplinary open access
archive for the deposit and dissemination of
sci-entific research documents, whether they are
pub-lished or not. The documents may come from
teaching and research institutions in France or
abroad, or from public or private research centers.
L’archive ouverte pluridisciplinaire HAL, est
destinée au dépôt et à la diffusion de documents
scientifiques de niveau recherche, publiés ou non,
émanant des établissements d’enseignement et de
recherche français ou étrangers, des laboratoires
publics ou privés.
Deep temperatures in the Paris Basin using
tectonic-heat flow modelling
Damien Bonté, Jan Diederik van Wees, Laurent Guillou-Frottier, Vincent
Bouchot, Olivier Serrano
To cite this version:
Damien Bonté, Jan Diederik van Wees, Laurent Guillou-Frottier, Vincent Bouchot, Olivier Serrano.
Deep temperatures in the Paris Basin using tectonic-heat flow modelling. European Geothermal
Congress EGC 2013, Jun 2013, Pise, Italy. 10 p. �hal-00842726�
Deep temperatures in the Paris Basin using tectonic
Damien Bonte
1,3*, Jan-Diederik van Wees
1 GeoServ
2 TNO – Geological Survey of the Netherlands, Princetonlaan 6, 3584 CB Utrecht, the Netherlands 3 Utrecht University, Budapestlaan 4, 3584 CD Utrecht, the Netherlands
4 BRGM, ISTO, UMR 7327, 3 avenue Claude
Keywords: Temperature, Modelling, Paris Basin,
geothermal energy.
ABSTRACT
The determination of deep temperatures in a basin is one of the key parameters in the exploration of geothermal energy. This study, carried out as part of the CLASTIQ-2 project, presents a 3
temperatures in the Paris Basin derived through a thermal-tectonic forward modelling method, calibrated using subsurface temperature values. The temperature dataset required for the calibration was compiled in 2007 as part of the CLASTIQ-1 p
temperature measurement dataset is largely composed of BHT (some 2443 values). These BHT measurements required correction due to the thermal disturbance created during drilling. After correction, which was carried out using the Instantaneous Cylinder Source (ICS) method, 494 corrected BHT (BHTx) values were available for the modelling of the Paris Basin. In addition to these BHTx, some 15 DST measurements that are considered as close to the thermal equilibrium (i.e., ±5°C) were added to the temperature calibration values. According to this dataset of BHTx and DST, the average gradient in the Paris Basin was calculated as 34.9°C/km when the surface temperature is fixed at 10°C. The temperature values collected were then used to calibrate the tectonic-heat flow modelling. The model was computed at the lithospheric scale but focused on the temperature field in the sedimentary basin fill. The model takes into account the geodynamic evolution of the last 20 My, the heat production, and the specific heat conduction of each defined sedimentary layer. The result is a 3D thermal block that is presented in the form of isodepth maps. The results are strongly influenced by thermal conductivity variations such as those due to differences in sediment composition while faults create some more localised influences. The presence of anomalously radiogenic bodies beneath the basin, and/or by variations in lithosphere thickness resulting in possible heat production anomalies strongly influence the thermal variations the Paris Basin. The Alpine Orogeny created a slight temperature increase in the south-eastern part of the
Deep temperatures in the Paris Basin using tectonic-heat flow modelling
Diederik van Wees
2,3, Laurent Guillou-Frottier
4, Vincent Bouchot
Serrano
4GeoServ, Unit 1, Ballyogan Road, Dublin 18, Ireland
Geological Survey of the Netherlands, Princetonlaan 6, 3584 CB Utrecht, the Netherlands Utrecht University, Budapestlaan 4, 3584 CD Utrecht, the Netherlands
BRGM, ISTO, UMR 7327, 3 avenue Claude Guillemin, BP 6009, 45060 Orléans cedex 2, France * dam.bonte@gmail.com
Temperature, Modelling, Paris Basin,
The determination of deep temperatures in a basin is one of the key parameters in the exploration of geothermal energy. This study, carried out as part of 2 project, presents a 3D-model of the temperatures in the Paris Basin derived through a tectonic forward modelling method, calibrated using subsurface temperature values. The temperature dataset required for the calibration was compiled in 1 project. The temperature measurement dataset is largely composed of BHT (some 2443 values). These BHT measurements required correction due to the thermal disturbance created during drilling. After correction, which was carried out using the Instantaneous linder Source (ICS) method, 494 corrected BHT (BHTx) values were available for the modelling of the Paris Basin. In addition to these BHTx, some 15 DST measurements that are considered as close to the thermal equilibrium (i.e., ±5°C) were added to the erature calibration values. According to this dataset of BHTx and DST, the average gradient in the Paris Basin was calculated as 34.9°C/km when the surface temperature is fixed at 10°C. The temperature values collected were then used to calibrate the heat flow modelling. The model was computed at the lithospheric scale but focused on the temperature field in the sedimentary basin fill. The model takes into account the geodynamic evolution of the last 20 My, the heat production, and the specific t conduction of each defined sedimentary layer. The result is a 3D thermal block that is presented in the form of isodepth maps. The results are strongly influenced by thermal conductivity variations such as those due to differences in sediment composition, while faults create some more localised influences. The presence of anomalously radiogenic bodies
or by variations in lithosphere possible heat production he thermal variations in the Paris Basin. The Alpine Orogeny created a slight eastern part of the
basin and inhomogeneities in the lithology of the basement generating additional sources of variation in the sedimentary pile.
1. INTRODUCTION
As global interest in finding alternative solutions to hydrocarbon energy sources increases, geothermal energy is becoming a very attractive alternative for both heating and the generation of electricity. Geothermal energy has the advantage of being a natural source with only a minimal environmental impact and that moreover is not influenced by either seasonal or climatic conditions. In order for the exploration of a suitable geothermal system to be carried out two major conditions are required: firstly, the existence of a large quantity of fluid with a suitable geochemistry that can circulate in rocks of a high permeability (reservoir); and secondly, a sufficiently high temperature. The temperatures required during the exploration stage are largely dependent on the intended use of the geothermal energy. According to Lindal (1973) a minimum temperature of 50°C is required for district and greenhouse heating and 150°C for electricity production. A temperature of 50°C can typically be reached at depths of between 1500m and 2000m in the Dogger reservoir of the Paris Basin (Lopez et al, 2010). The unusually high temperature of the Rhine Graben allows the generation of electricity, with a temperature of 150°C being reached at 3000m at the Soultz-sous-Forêts geothermal site whilst a higher temperature of 160°C could be reached at 2500m, 8 km east of Soultz-sous-Forêts (Guillou
2013).
In order for the geothermal energy sector to be effectively developed, the identification of temperatures through precise mapping is a necessity. Temperature requirements vary project by project and only by precisely mapping underground temperatures at different depths can individual needs be effectively met. The ability of these maps to be precise, however, relates directly to the density of temperature data available for use in their construction. The accurate temperature values available are for the most part
1
heat flow modelling
, Vincent Bouchot
4, Olivier
Geological Survey of the Netherlands, Princetonlaan 6, 3584 CB Utrecht, the Netherlands Utrecht University, Budapestlaan 4, 3584 CD Utrecht, the Netherlands
Guillemin, BP 6009, 45060 Orléans cedex 2, France
basin and inhomogeneities in the lithology of the basement generating additional sources of variation in
As global interest in finding alternative solutions to hydrocarbon energy sources increases, geothermal energy is becoming a very attractive alternative for both heating and the generation of electricity. Geothermal energy has the advantage of being a ral source with only a minimal environmental impact and that moreover is not influenced by either seasonal or climatic conditions. In order for the exploration of a suitable geothermal system to be carried out two major conditions are required: firstly, e existence of a large quantity of fluid with a suitable geochemistry that can circulate in rocks of a high permeability (reservoir); and secondly, a sufficiently high temperature. The temperatures required during the exploration stage are largely t on the intended use of the geothermal energy. According to Lindal (1973) a minimum temperature of 50°C is required for district and greenhouse heating and 150°C for electricity production. A temperature of 50°C can typically be en 1500m and 2000m in the Dogger reservoir of the Paris Basin (Lopez et al, 2010). The unusually high temperature of the Rhine Graben allows the generation of electricity, with a temperature of 150°C being reached at 3000m at the mal site whilst a higher temperature of 160°C could be reached at 2500m, 8 Forêts (Guillou-Frottier et al., In order for the geothermal energy sector to be effectively developed, the identification of ise mapping is a necessity. Temperature requirements vary project by project and only by precisely mapping underground temperatures at different depths can individual needs be effectively met. The ability of these maps to be precise, however, tly to the density of temperature data available for use in their construction. The accurate temperature values available are for the most part
2
Bottom Hole Temperature values (BHT), together with a small number of Drill Stem Test values (DST). In a previous study (Bonté et al, 2010), we carried out a geostatistical analysis of temperature in the French sedimentary basins. The results of this study offered a good estimation of the temperature in those areas that had a high density of temperature values. However, in order to conduct the detailed exploration of geothermal energy in the Paris Basin intended by the CLASTIQ-2 project, the temperature determination in the whole basin has now to be carried out. In this paper, we have taken the temperature values collected as part of the CLASTIQ-1 project (Bonte et al, 2010) and used them to calibrate the model. The tectonic-heat flow model provided a 3D thermal block from which we were able to extract 2D isodepth temperature maps.
2. THE REFERENCE TEMPERATURE DATASET
2.1 Available temperature and corrections
The deep temperatures available in the Paris Basin are related to hydrocarbon drillings that have taken place for the purposes of exploration and exploitation. The main kinds of measurement typically derived from these boreholes are as follows:
- Thermometry is a continuous temperature measurement, but in oil exploration boreholes it is used to monitor cementation behind the casing. Since the cementation reaction is exothermic, in-situ temperatures are much higher than equilibrium values. Correction should be possible, but in practice this demands the use of parameters that are unavailable
(e.g., time between cementation and measurements, cementation thickness, type of cement, etc.).
- The DST (Drill Stem Test) is a procedure used to test a formation (e.g., pressure, temperature, permeability, etc.) in the borehole by pumping the surrounding fluid. The pumped fluid is in thermal equilibrium with the surrounding formation and as such, DST temperatures do not require any correction.
- The BHT (Bottom Hole Temperature) is a side-product of most logging tools. It corresponds to the maximum temperature recorded during logging — theoretically (but not necessarily) the temperature at the bottom. Before logging operations begin, a borehole is cleaned by circulating mud in order to remove cuttings. The mud is injected at a temperature that is usually colder than that of the borehole itself. Because the time that elapses between the end of the mud circulation and the measurement of temperature is usually so short (typically only a few dozen hours), the measured temperature is not at equilibrium and thus a correction is required.
Among these different temperature measurements, only BHT datasets are numerous enough to provide the necessary spatial repartition — both horizontally and vertically — to provide a good calibration of the model.
The compilation of the BHT data in the French Sedimentary basins took place in 2007, as part of the CLASTIQ-1 project (Bonté et al, 2010). In addition to the collection of the BHT measurements, the additional parameters required for their correction were collected in the headers of the oil boreholes
Figure 1: Localisation of the temperature values used for this study a- Temperature vs depth; b- spatial repartition of the boreholes. Blue dots: DST values; Black triangles: BHTx (or corrected BHT) values. Grey line: general trend of the BHTx with a fixed temperature of 10°C on surface.
Bonté; van Wees; Guillou-Frottier; et al
3
available in the Paris Basin. Overall, 2443 BHT measurements were retrieved from 459 boreholes across the Paris Basin. These BHT measurements were corrected using the Instantaneous Cylinder Source (ICS) method; this made it possible to compute the return to equilibrium of the temperature following an erf function, after the perturbation created by the cleaning of the borehole. One of the main restrictions for this correction is the necessity to know a minimum of two BHT measurements with two different shut-in-times (i.e., the time between the cleaning of the borehole and the measurement) at the same depth and in the same well. The details of the ICS method and its comparison with other methods can be found in Goutorbe et al (2007) and Bonté et al (2010). From these ICS corrections, the resulting temperatures have an uncertainty of ± 5-10 °C (e.g., Brigaud, 1989; Goutorbe et al., 2007)
2.2 Repartition of the temperatures in the Paris Basin
As a result of the correction of the collected BHT measurements, 494 corrected temperature (BHTx) values have been recovered. To these BHTx values, we added some 15 DST measurements retrieved from the end of well reports that are considered to be at equilibrium. The spatial repartition of the boreholes is inhomogeneous over the Paris Basin (fig. 1a): the boreholes with BHTx values are mainly located where the Meso-Cenozoic is the thickest (Guillocheau et al, 2000), in the central part of the basin. Boreholes are also available to the east of the basin, but very few are found to the south and none to the west or north. In terms of depth, because temperatures values are taken from the bottom of the borehole, the data are mainly available from the second half of the basin. The density value is maximal between 1700m and 2700m. The average temperature gradient, with a surface temperature of 10°C, is 34.9°C.km-1 (fig. 1b). This value in the Paris Basin is higher than the average temperature of 30.6°C.km-1 in France (Bonté et al, 2010).
3. TECTONIC-HEAT FLOW MODELLING
The data repartition is inhomogeneous in the Paris Basin; the western and northern part of the basin is data-free, while the southern and much of the eastern parts of the basin have only a limited number of values. Furthermore, the BHT and DST data are punctual values in 3D. Therefore, in order to obtain a complete coverage of the thermicity in the Paris Basin, two major solutions are available: the geostatistical method and the modelling method. For CLASTIQ-1, the geostatistical method was easy to apply as it only requires the temperature data, and uses interpolation and extrapolation constrained by geostatistics (Bonté et al, 2010). The limitation of this method, however, is that it can only predict the temperature within a narrow spatial range defined by the extrapolation procedure. As a result, the temperature determination is made by extrapolation and control over it is very limited. In order to perform a complete determination of the temperature over the whole basin in 3D, this
study uses a modelling method that takes into account not only the temperature but also the thermal parameters that can influence it.
3.1 Methodology of the tectonic-heat flow modelling
Tectonic-heat flow modelling allows the determination of temperature in the sedimentary pile, and takes into account the thermicity of the whole lithosphere. At this scale, it is possible to fix the thermal limits. The temperature in the sediments takes into account the thermal properties of the crust and the lithosphere and the transient behaviour of heat transfer processes in a sedimentary basin.
The 3D-modelling, described in detail in Bonté et al (2012) and summarised here, is based on the previous work by van Wees et al (2009), which deals with the incorporation of properties and thermal processes into the modelling of sedimentary basins. The transitory processes and the thermal properties of the crust and the lithosphere are based on the work of Cloetingh et al (2010). The model takes into account the variation effects of the petrophysical parameters (thermal conductivity and heat production from radiogenic disintegration) as well as the transitory effects of vertical movements such as sedimentation or crustal deformation that can influence the temperature. To incorporate these effects, the model solves the heat equation in a transient regime and in 3D. The vertical variations, which relate to sedimentation and erosion rates, are related to lithospheric stretching over the basin’s last evolution phase (this temporal value, tb,
relates to a period of a few million years). For each step in the evolution of the basin, the heat equation is solved, taking into account vertical velocity and the variations inferred by the thermal properties. The thermal properties and associated geometry in the sedimentary basin and the underlying crust have been defined in conformity with the present-day configuration. The thermal properties are defined in relation to the lithology (see section 3.2), including compaction, and thus anisotropy (e.g. Vasseur et al, 1995). The 3D grid dimensions are as follow: 1000m horizontally, 200m vertically for the first 6400m, and then 1000m. The model calibration follows an iterative methodology, enabling the attainment of the best result possible in terms of quadratic means (RMS misfit). The model starts with a solution at the equilibrium with the geothermal gradient that is determined in 1D for each of the locations where a temperature value is available (van Wees et al, 2009). The calibration of the model is made by fluctuating within boundaries the initial thickness of the lithosphere (100km) and the heat production in the crust. Figure 2 shows that in our model, a maximum of 4 iterations is sufficient to obtain a good fit with the data for a quadratic mean of 6.4. In the case of 30 iterations, a very high peak is noticeable after 10 iterations, this peak is to be related to the Boyen iteration in 1D phase of the modelling that is then smoothed to go back to a reasonable RMS misfit just under 7. For both 11 and 30 iterations, the RMS misfit
4
fluctuates from just below 7 to just over 8, and it stabilises at 7.6 in the 30-iteration model. In the case of all iterations, the lower quadratic mean is reached after 4 iterations.
If one or more temperature values are in the same grid cell, the data are merged and processed together to minimise the quadratic mean between the temperature values and the analytic model. The 1D-solution is then used to calculate the temperature in 3D.
Figure 2: Quadratic mean (RMS misfit) for 4, 11 and 30 iterations (all other parameters being strictly identical)
3.2 Input of the tectonic-heat flow model
In order to perform the modelling, a geometrical model of the lithosphere and sedimentary basin was established, details for the thermal properties of each layers were also given. Overall, the lithosphere is defined by 4 main layers: the sediments (the Paris Basin from Tertiary to Triassic), the upper crust, the lower crust and the lithospheric mantle. Regarding the lower limit of the model (i.e., the base of the lithosphere), we chose the definition of the thermal lithosphere given by Aremieva et al (2011), which describes the base of the lithosphere as an iso-temperature of 1300°C. The initial thickness of the lithosphere is fixed at 100km (Artemieva et al, 2006), which is defined by the change in means of
transportation from mainly convective to mainly conductive (Sleep, 2005; Jaupart et Mareschal, 2007). The base of the crust is given by the Mohorovičić discontinuity, with a thickness of the crust of 34km (Lefort and Agarwal, 2002). The crust separates into two entities; the upper crust, which is highly radiogenic, and the lower crust, which has noticeably lower values of radiogenic values (e.g., van Wees et al, 2009). The thermal parameters for the lithosphere and the crust are resumed in Table 1, using values extracted from Cloetingh et al (2010). These values are used as starting values, while the lithospheric thickness and the heat production in the upper crust are the adjustable values used to fit the temperature over the iterations.
Parameter Unit Value
Thickness of the lithosphere m 1.0 105 Thickness of the crust m 3.4 104
Density of the crust kg.m-3 2900
Density of the mantle kg.m-3 3400
Conductivity of the crust - 2.6 Conductivity of the mantle - 3 Heat production of the upper crust µW.m-3 0
Heat production of the lower crust µW.m-3 0.5 Thermal expansion of the lithosphere - 3.2 10-5
Temperature at the base of the lithosphere °C 1300
Table 1: Starting values forthermal parameters for the lithosphere and the crust (Regarding the “heat production in the upper crust”: 0 indicates an initial proportion of 40% of the surface heat flow.)
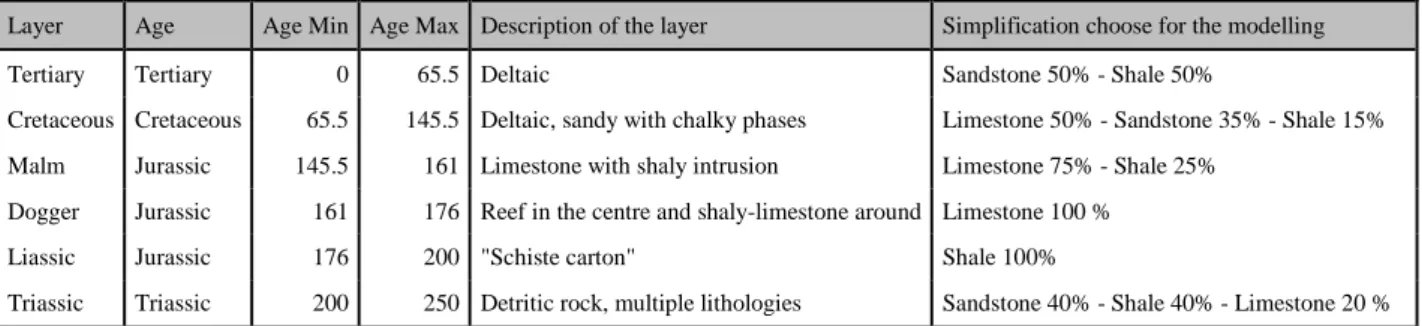
The Paris Basin geometry has been the subject of numerous studies within the BRGM. For this model, we used a description of the Paris Basin with six layers showing an horizontal resolution identical to the model (i.e., 1000m). These six layers consist of the Tertiary, the Cretaceous, the Malm, the Dogger, the Liassic, and the Triassic (see Table 2). The
structure of the layers in the Paris Basin has been extensively described in numerous publications (e.g.,Guillocheau et al., 2000; Goncalves, 2003; and Beccaletto et al., 2011). 6 7 8 9 10 11 12 13 14 0 2 4 6 8 10 12 14 16 18 20 22 24 26 28 30
R
M
S
m
is
fi
t
Iteration number
30 iterations 11 iterations 4 itérationsBonté; van Wees; Guillou-Frottier; et al
5
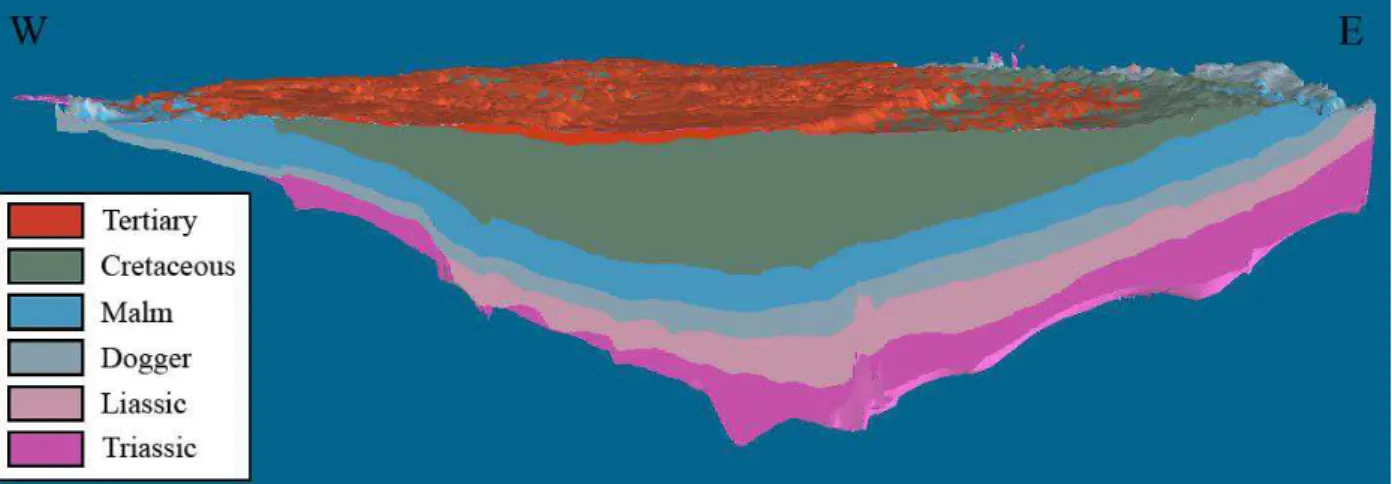
The general features, visible on the west-east profile of fig. 3, are as follows:
- the sedimentary layers interlock with each other, with the lower layers including the more recent ones; - the layers are thicker in the central part of the basin than at the borders
- in terms of depth, the Triassic and Liassic layers are discreet at the west of the basin
- on the surface layer, recent geodynamic events have created an uplift of the east and south-east of the basin, leading to an erosion of the most recent layers. The sedimentary layers describe the major variations of the Paris Basin lithology, with the lithological composition being homogenous across each layer. The lithology uses the technique of mixing basic lithologies (see Table 2). Description of the mixed lithology technique, as well as the properties for the basic lithologies (shale, sandstone, limestone), is available in Hantschel and Kauerauf (2009). However,
due to the concave shape of the layers, the parameters that are depth dependent such as the porosity change. The thermal conductivity, which is dependent on the lithology, the porosity and the temperature (Hantschel and Kauerauf, 2009) change with depth. Figure 4 show the variation of vertical (fig.4a) and horizontal (fig.4b) thermal conductivity along an west-east profile across the Paris Basin. The horizontal thermal conductivity (fig. 4b) is strongly influenced by the lithology in the top half of the basin. The vertical thermal conductivity (fig. 4a) also show a stronger influence of the lithology at shallower depth but the influence remains in depth. Figure 4a shows clearly the low thermal conductivity of the Liassic that is related to the shale composition of this layer.
4. RESULTS OF TEMPERATURE MODELLING IN THE PARIS BASIN
4.1 Modelled temperature
Figure 4: Vertical (a) and horizontal (b) thermal conductivity of the sediments displayed on an west-east profile across the Paris Basin
Layer Age Age Min Age Max Description of the layer Simplification choose for the modelling Tertiary Tertiary 0 65.5 Deltaic Sandstone 50% - Shale 50%
Cretaceous Cretaceous 65.5 145.5 Deltaic, sandy with chalky phases Limestone 50% - Sandstone 35% - Shale 15% Malm Jurassic 145.5 161 Limestone with shaly intrusion Limestone 75% - Shale 25%
Dogger Jurassic 161 176 Reef in the centre and shaly-limestone around Limestone 100 % Liassic Jurassic 176 200 "Schiste carton" Shale 100%
Triassic Triassic 200 250 Detritic rock, multiple lithologies Sandstone 40% - Shale 40% - Limestone 20 %
Table 2: Sedimentary layers for the Paris Basin model and the associated lithologies for the attributions of the thermal parameters.
6
The result of the temperature model is a 3D thermal block at the lithospheric scale with a temperature of 1300°C at the base of the lithosphere and 10°C on the surface (this being the average surface temperature for the Paris Basin). During the modelling, emphasis has been given to the temperature pile. In order to visualise the result of the modelling, the thermal grid has been sliced horizontally to represent the temperatures on isodepth maps in the sedimentary pile. It is to noticed that the maximum Meso-Cenozoic sediment depth is slightly higher than 3200m and is located in the central part of the basin (situated geographically in the south-east of the Île-de-France
departement).
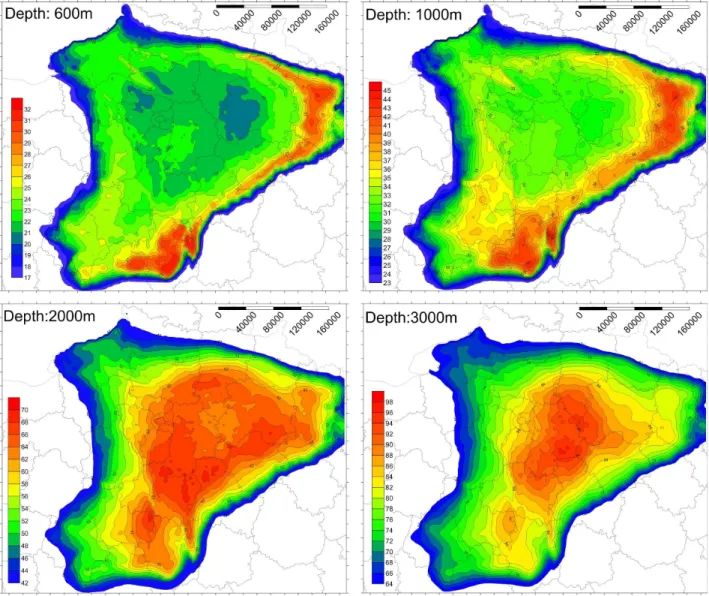
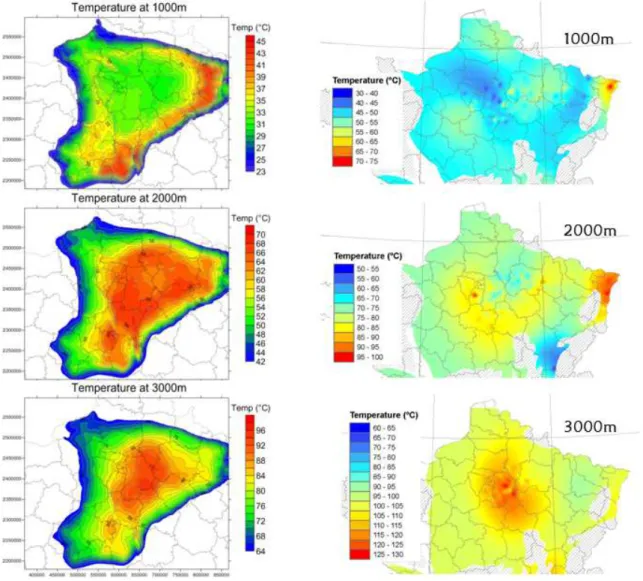
The result of the modelling is presented in figure 5 as four temperature maps, showing isodepths of 600m, 1000m, 2000m, and 3000m respectively. The extension shown on these maps is the extension of the Paris Basin on the surface. The first point that should be noted is the main thermal repartition in each of the temperature maps presented. One important feature
seems to be the visible difference on the maps between the isodepths of 600m and 1000m, in comparison to the isodepths of 2000m and 3000m. At 600m and 1000m, the temperature is noticeably higher at the border of the basin, and more precisely, at the south-east border of the Paris Basin. At a depth of 600m, the temperature reaches 30°C at the south-east corner of the basin and in the east of the basin. The simplified French geological map at a scale of 1/1,000,000, (Guillocheau et al, 2000), shows that these high temperature values are located in the Triassic, just below the insulating layers of the “Schistes Carton” of the Toarcian (i.e., one of the main components of the Liassic). The phenomenon is repeated at 1000m, but at this depth, the Toarcian base is geographically closer to the centre of the basin and the temperature is consequently modified. On a smaller scale, the Saint-Martin-de-Bossenay fault (west to the Morvan), has modified the Liassic strata, and subsequently, the thermal regime at a isodepth 1000m. The temperature map at 2000m is of particular
Figure 5: Mapping representation of temperatures at several isodepths (600m, 1000m, 2000m, and 3000m), from the tectonic-heat flow modelling.
Bonté; van Wees; Guillou-Frottier; et al
7
interest, as the top Triassic is crossed at this isodepth. As a result of the concave shape of the sedimentary layers in the Paris Basin, the 2000m isodepth intersects the Liassic base in the central part of the Paris Basin. Consequently, the temperature is higher in the central part of the Paris Basin due to the insulating effect of the Liassic shale. In the south, in Beauce, the Sennely fault has deepened the Liassic base, with the result that the temperature increases at 2000m. At 3000m, the temperature remains higher in a smaller area of the central part of the basin due to the insulating effect of the Liassic.
Although the insulating effect of the Liassic is a main factor impacting upon thermal variations within the basin, if the basin is taken as a whole, more localised phenomena such as fluid circulation may also represent a source of variations. For example, deep faults that have their roots deep in the basement can be the source of large temperature variations on a local scale (Garibaldi et al, 2010). The aquifers of the Paris Basin, such as the Albian's “Sable Vert” and the “Grès du Trias”, for example, have a slow hydrogeological movement and therefore cannot be considered as the origin of important temperature variations in the Paris Basin. Nonetheless, these aquifers can still have a smoothing effect upon temperature.
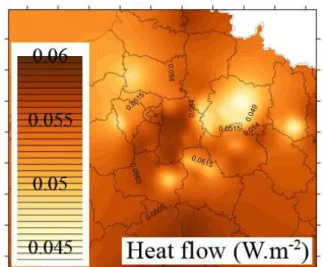
Figure 5: Heat flow below the sediments
The thermal heterogeneities in the sedimentary pile has a strong impact the temperature variations shown in figure 5. Due to the calibration methodology used by the model, in which changes to the thickness of the lithosphere and the radiogenic heat production adjust the temperature of the model in line with the BHTx and DSTx, allows to define the part played by the lithosphere in the sediments temperature. To this end, the model is able to display the heat flow below the sediments (fig. 5) relating to the amount of energy
passed on to the sedimentary pile. These variations of energetic intensity are the result of changes in the production of heat and in reduced lithospheric thickness. The basement of the Paris Basin currently remains relatively unknown due to a lack of direct measurements and observations, one of the problems being the relatively small number of wells that have reached the required depth.
However, studies using indirect geophysical methodologies have also been carried out by Ménégien (1980) and Debeglia (2005). These studies allow some correlation of some elements from the basement that could be:
- either carboniferous sedimentary deposits (shale), with a strong thickness in relation to what is known in the Netherlands (Wong et al, 2007);
- or magmatic intrusions with a significant radiogenic heat production. This is the case in the south east of the Île-de-France, where a heat flow positive anomaly is clearly perceptible on figure 6, and has been related by Debeglia (2005) to a basement anomaly (presence of heat-producing granites) that could be a thermal source.
4.2 Comparison with the temperature obtained with a geostatistical method
In 2010, we published the results of a study concerning the geostatistical interpolation/extrapolation of available temperatures in the French sedimentary basins (including the Paris Basin). The framework of this work was CLASTIQ-1, and was detailed in Bonté et al (2010). In this study, we pointed out the problematic issues related to obtaining values in areas that lacking or sparsely covered by data while using geostatistical tools. Figure 7 allows the comparison of results obtained through a geostatistical tool (Bonté et al, 2010) and a tectonic-heat flow modelling tool. The following elements were noticed in this comparative exercise: - the contour definition of any thermal anomalies is better defined using the modelling tool. E.g., due to a lack of control points, the 60°C temperature anomaly located to the east of the Île-de-France is well defined in the southern part but lacks definition in the northern part.
- Some anomalies are not observable whilst using the geostatistical method. Two examples illustrate the absence of such anomalies in the geostatistical model: (i) no high temperature is visible at 1000m on the border of the basin or in the south, while only a limited increase is noticeable to the east of the basin (Meuse department area); (ii) at 2000m and 3000m, the increased temperature related to the Senelly fault is not visible on the geostatistical model.
8
In conclusion, it would seem that using tectonic-heat flow modelling is to be preferred over the geostatistical method. It is, however, important to mention the high amount of data required to carry out this modelling, which in some cases effectively makes this method impossible to use. Furthermore, when tailored towards large-scale studies, this modelling method has something of a smoothing effect of thermal anomalies with a size of less than 20km. Finally, each method has its own use and should be used according to its own means and limitations.
5. CONCLUSION
The aim of this study was to present accurate subsurface temperature maps for the whole Paris Basin, regardless of the location of its high-temperature value density. To achieve this, we performed a tectonic-heat flow modelling of the Paris basin using a six-layer model for the sedimentary infill, plus three additional layers for the lithosphere. For the calibration of the model, we used a corrected BHT and DST dataset. This method made it possible to incorporate the complete evolution of the
lithosphere over the last 20Myr, thus providing a transient temperature result. The model only describes the temperature through a purely conductive methodology, with the variation of temperature being the result only of differences in heat production and thermal conductivity.
Analysis of the temperature anomalies shows that in the sedimentary pile, the “Schistes Carton” (of Toarcian age) is the main impacting layer with a low thermal conductivity. Associated with the “bowl” shape of the sedimentary layers in the Paris Basin, the positive anomalies below this layer of low conductivity are localised on the borders of the basin at a shallow depth (i.e.. 1000m) and “migrate” with depth toward the centre of the basin. The basement also plays a role in the temperature variation in the sedimentary pile, with the heat flow at the base of the sediments indicating a high heat production that is probably related to radiogenic decay from an intrusive body or to a thick, Carboniferous, clay-filled half-graben.
Figure 6: Temperatures in the Paris Basin at isodepths. (The left column shows the results of the modelling method presented in this study while the right column demonstrates the temperature obtained using the geostatistical method (Bonté et al, 2010))
Bonté; van Wees; Guillou-Frottier; et al
9
For geothermal energy exploration in sedimentary basins, subsurface temperature is a key parameter that needs to be defined as precisely as possible. Other parameters, such as the extension and depth of the reservoir, as well as water presence and composition, are also important factors requiring definition. This temperature model of the Paris Basin is presented as part of the CLASTIQ-2 project.
REFERENCES
Artemieva I.M., 2011. The lithosphere: an interdisciplinary approach. Cambridge University
Press, 773 p.
Artemieva I.M., Thybo H. and Kaban M.K., 2006. Deep Europe today: Geophysical synthesis of the upper mantle structure and lithospheric processes over 3.5 By. In: D. Gee & R. Stephenson (Eds.), European Lithosphere Dynamics. Geological Society, London, Memoirs, 32, 14-41.
Beccaletto L., Hanot F., Serrano O., Marc S., 2011. Overview of the subsurface structural pattern of the Paris Basin (France): Insights from the reprocessing and interpretation of regional seismic lines, Marine
and Petroleul Geology, 28, 861-879.
Bonté D., Guillou-Frottier L., Garibaldi C., Bourgine B., Lopez S., Bouchot V. and Lucazeau F., 2010. Subsurface temperature maps in French sedimentary basins : new data compilation and interpolation,
Bulletin de la Société Géologique de France, 181,
377-390.
Bonté D., van Wees J.-D. and Verweij J.M., 2012. Subsurface temperature of the onshore Netherlands: new temperature dataset and modelling, Netherlands
Journal of Geosciences, 91, 491-515.
Brigaud F., 1989. Conductivité thermique et champ de température dans les bassins sédimentaires à partir des données de puits. Thèse de doctorat, Université
Montpellier 2, 414 p.
Cloetingh S., Van Wees J.D., Ziegler P.A., Lenkey L., Beekman F., Tesauro M., Förster A., Norden B., Kaban M., Hardebol N., Bonté D., Genter A., Guillou-Frottier L, Ter Voorde M., Sokoutis D., Willingshofer E., Cornu T. and Worum G., 2010. Lithosphere tectonics and thermo-mechanical properties: an integrated modelling approach for Enhanced Geothermal Systems exploration in Europe, Earth
Science Reviews, 102, 159-206.
Debeglia N., 2005. Réinterprétations géophysiques dans le centre du bassin de Paris pour l’évaluation du potentiel géothermique - COPGEN 2005. BRGM/RP-54248-FR. 49 p.
Garibaldi C., 2010. Détermination des températures profondes du Bassin du Sud-Est de la France et relations entre anomalies thermiques, géologie et circulations hydrothermales par modélisation 3D. PhD
thesis. Université de Nice Sophia-Antipolis, 284 p.
Gonçalvès J., 2003. Modélisation 3D de l’évolution géologique du Basin de Paris : implication diagénétique et hydrogéologique. Thèse de doctorat. Université Paris VI – Pierre et Marie Curie, 351 p. Goutorbe B., Lucazeau F. and Bonneville A., 2007. Comparison of several BHT correction methods: a case study of an Australian data set. Geophysical
Journal International, 170, 913-922.
Guillocheau F., Robin C., Allemand P., Bourquin S., Brault N., Dromart G., Friedenberg R., Garcia J.-P., Gaulier J.-M., Gaumet F., Grosdoy B., Hanot F., Le Strat P., Mettraux M., Nalpas T., Prijac C., Rigollet C., Serrano O., Vairon J. and Granjean G., 2000. Meso-cenozoic geodynamic evolution of the Paris Basin: 3D stratigraphic constraints. - Geodinamica
Acta, 13, 189-246.
Guillou-Frottier L., Carré C., Bourgine B., Bouchot V. and Genter A., 2013. Structure of hydrothermal convection in the Upper Rhine Graben as inferred from corrected temperature data and basin-scale numerical models, Journal of Volcanology and
Geothermal Research, 256, 29-49.
Hantschel T. and Kauerauf A.I., 2009. Fundamentals of Basin and Petroleum Systems Modeling.
Springer-Verlag, Berlin Heidelberg, 476 p.
Jaupart C. and Mareschal J.-C., 2007. Heat flow and thermal structure of the lithosphere, in: Treatise on
Geophysics, Schubert G. (ed.), 6, 217-252.
Lefort J. P. and Agarwal B.N.P., 2002. Topography of the Moho undulations in France from gravity data: their age and origin, Tectonophysics, 350, 193-213. Lindal B., 1973. Industrial and other applications of geothermal energy. In: Geothermal energy: Review of research and development. – UNESCO, Paris, LC No. 72-97138, 135-148.
Lopez S., Hamm V., Le Brun M., Schaper L., Boissier F., Cotiche C. and Giuglaris E., 2010. 40 years of Dogger aquifer management in Ile-de-France, Paris Basin, France. Geothermics, 39, 339-356. Mégnien C. et collaborateurs Courel L., Durand M., Maget P., Maiaux C., Menillet F. & Pareyn C. (1980) - Synthèse géologique du bassin de Paris. Mémoires du BRGM, n° 101, 102 et 103.
Sleep N. H., 2005. Evolution of continental lithosphere, Annual Review of Earth and Planetary
Sciences, 33,369–393.
Van Wees J.D., Van Bergen F., David P., Nepveu M., Beekman F., Cloetingh S. and Bonté D., 2009. Probabilistic tectonic heat flow modeling for basin maturation: Assessment method and applications.
10
Vasseur G., Brigaud F. and Demongodin L., 1995. Thermal conductivity estimation in sedimentary basins. Tectonophysics, 244, 167-174.
Wong Th.E., Batjes D.A.J. and de Jager J. (Eds.), 2007. Geology of the Netherlands. Royal Netherlands
Academy of Arts and Sciences, Amsterdam, 354 p. Acknowledgements
This study is the result of the collaboration between the TNO and the BRGM. It was supported the Utrecht University in the general framework of Damien Bonté PhD Thesis. At the BRGM, this study was part of the CLASTIQ-2 project and was partly funded by BRGM and ADEME (the French Environment and Energy Management Agency). A grateful thanks to Rosie Bonté for the correction of the English and to Tristan for his support.