HAL Id: hal-00496212
https://hal-brgm.archives-ouvertes.fr/hal-00496212
Submitted on 29 Jun 2010
HAL is a multi-disciplinary open access
archive for the deposit and dissemination of
sci-entific research documents, whether they are
pub-lished or not. The documents may come from
teaching and research institutions in France or
abroad, or from public or private research centers.
L’archive ouverte pluridisciplinaire HAL, est
destinée au dépôt et à la diffusion de documents
scientifiques de niveau recherche, publiés ou non,
émanant des établissements d’enseignement et de
recherche français ou étrangers, des laboratoires
publics ou privés.
Combination of Numerical Tools to Link Deep
Temperatures, Geological Structures and Fluid Flow in
Sedimentary Basins: Application to the Thermal
Anomalies of the Provence Basin (South-East France)
Cynthia Garibaldi, Laurent Guillou-Frottier, Jean-Marc Lardeaux, Vincent
Bouchot
To cite this version:
Cynthia Garibaldi, Laurent Guillou-Frottier, Jean-Marc Lardeaux, Vincent Bouchot. Combination of
Numerical Tools to Link Deep Temperatures, Geological Structures and Fluid Flow in Sedimentary
Basins: Application to the Thermal Anomalies of the Provence Basin (South-East France). World
Geothermal Congress 2010, Apr 2010, Bali, Indonesia. 7 p. �hal-00496212�
Bali, Indonesia, 25-29 April 2010
Combination of Numerical Tools to Link Deep Temperatures, Geological Structures and
Fluid Flow in Sedimentary Basins: Application to the Thermal Anomalies of the Provence
Basin (South-East France)
Cynthia Garibaldi */**, Laurent Guillou-Frottier *, Jean-Marc Lardeaux **, Vincent Bouchot *
* BRGM, 3, Av. Claude Guillemin, BP6009, 45060 Orléans cedex 2, France
** Géosciences Azur, UMR 6526, université de Nice–Sophia Antipolis CNRS, parc Valrose, 06108 Nice cedex 2, France Corresponding author: c.garibaldi@brgm.fr
Keywords: Sedimentary basin, Provence basin, France, BHT, fluid flow model, 3D geological model, 3D thermal model, thermal anomaly, faulted areas, thermal conductivity, anisotropy
ABSTRACT
In the Provence basin, south-eastern France, more than 230 Bottom Hole Temperature (BHT) data have been compiled and corrected for transient disturbances to provide a thermal model of this Mesozoic to Cenozoic sedimentary basin. The thermal gradient of the area averages 29.9°C/km (32.5°C/km in all France), but some places show gradients reaching 36°C/km or 22°C/km. To characterize thermal anomalies, a three-dimensional model of the temperatures was built between the surface and 5km depth, allowing us to elaborate sets of thermal maps and cross-sections. The newly identified temperature anomalies may reach temperature difference up to 40°C at 3km depth through the basin. After attempting to find correlations between thermal anomalies and large scale features (Moho depths, sediment cover thickness), it appears that fluid circulation may better explain locations, amplitudes and wavelengths of thermal anomalies along faulted zones. In fact, spatial evolution of anomalous cold/warm zones follow directions of main faulted zones. In addition, it is shown that the account of a depth-dependent permeability allows the superimposition of positive and negative thermal anomalies. Away from permeable zones, thermal anomalies should be explained by conductive processes, among which heat refraction due to thermal conductivity contrasts may be significant. In particular, anisotropy of thermal conductivity of clayey formation is shown to enable the development of thermal anomalies similar to those observed between permeable zones. Evolution of fluid circulation in faulted zones (involving enhanced vertical heat transfer) combined with thick anisotropic sediments (involving enhanced horizontal heat transfer) may explain complex thermal patterns deduced from present-day temperature measurements. 1. INTRODUCTION
The understanding of sedimentary basin evolution has benefited from large database derived from well and seismic data provided by the petroleum industry. Since the last two decades, sedimentary basins turned out to represent new interesting targets, where geothermal potential may be important.
Deep temperatures estimates previously made in France (Gable, 1978; Haenel et al., 1980; Lucazeau et al., 1985; Garibaldi et al., 2009; Bonté et al., 2009) have shown that three main positive and large-scale thermal anomalies can
be defined: they are localized in the Rhine graben, in the Massif Central and in the Provence basin. At a smaller scale, a series of localized positive (warm) and negative (cold) anomalies can be obtained in each area (Garibaldi et al., 2009; Bonté et al., 2009). The two first large-scale positive thermal anomalies have been widely studied (Genter et al., 2003 for Rhenan basin; Calcagno et al., 2009 for Limagne basin) and are well-constrained. The potential of the Rhine Graben is actually exploited to produce electricity in the Soultz-sous-Forest area. Our work focused on the anomalous area of the Provence basin which is the deepest French sedimentary basin. The various geological areas of the Basin are due to its complex evolution through the Pyrenean and the Alpine orogeneses. This complexity is interesting to understand the link between deep temperatures and geological objects.
In Garibaldi et al. (2009) we presented a three-dimensional thermal block of which we extracted thermal maps every kilometer between 1km and 5km depth and thermal cross-sections across the thermal anomalous areas and along the major faults. The thermal anomalies move horizontally and vertically over all the area. The mean thermal gradient of 29.9°C/km is slightly lower than the average French thermal gradient (32.5°C/km) inferred from heat flow study in France by Lucazeau and Vasseur (1989). However, it can vary from place to place, some areas reaching a gradient of 36°C/km. For example, at 3km depth (Figure 1), the difference between the coolest and the warmest temperatures can yield 40°C while areas reaching these temperatures are only separated by few tens of kilometers. Significant deep thermal anomalies can be created by numerous processes. Large-scale signatures may be induced by changes in the Moho discontinuity depth, and smaller-scale variations could be interpreted with thermal processes occurring in the shallow crust. For example, the warm (positive) anomalous areas could be explained by a thick pile of insulating sediments (e.g. Lucazeau and le Douaran, 1985) or by fluid circulation within faults (e.g. Fleming et al., 1998). Active faults can act as fluid conduits from depth to the surface because they are assumed to have high permeability and are the site of variation of pressure favorable to fluid circulation (Sibson, 1987). Applied to different sedimentary basins, simple numerical models of hydrothermal convection have shown that temperature anomalies of more than 10°C can easily develop within permeable zones (Fleming et al., 1998; Bächler et al., 2003; Garibaldi et al., 2009). One such example is here presented to illustrate how thermal oscillations could develop vertically within a faulted zone.
Garibaldi et al.
Figure 1: Interpolated temperatures of the Provence basin at 3000m depth with major faults. Away from permeable zones, convective processes cannot
be invoked and thermal anomalies must be explained by conductive processes only, where thermal properties of rocks may exhibit significant changes. It is well-known that compaction of sediments may lead to important changes in porosity and thus contrasts in physical properties. It can generate the development of anisotropy in sediments. In particular, the role of thermal conductivity will be detailed in the present paper.
Indeed, thermal conductivity of rocks is an important parameter and need to be considered when studying deep temperatures in sedimentary basins because it directly controls the thermal gradient (Demongodin et al., 1991). This physical parameter depends essentially on the mineralogy and pore fluid composition of rocks, their structure and their temperature (Somerton, 1992). Its effect on the thermal transport properties can be caused by the temperature dependence of the heat transfer mechanisms or by temperature-induced physical and chemical changes in rocks depending on their mineralogical composition. Here we integrate anisotropic sediments in a numerical thermal model with the aim of testing their influence on the deep temperatures observed in the Provence basin.
2. REGIONAL GEOLOGY
The Provence basin is the deepest French sedimentary basin and is developed on a Variscan metamorphic basement. This complex geological basin is located between the Massif Central to the north-west, the Digne and Castellane arcs to the east, the Pelvoux Massif to the north, the
Pyrenees to the west and the Mediterranean sea to the south. The resulting strong subsidence phenomena which affected this basin led to the accumulation of Mesozoic (mainly Cretaceous) and Tertiary (almost Oligocene and Miocene) sediments whose thickness can locally reach 11km in the Rhone Valley. Numerous Cretaceous- to Eocene-age compressive structures are affected by Oligocene normal faults attributable to the reactivation of Pyrenean and Alpine orogenic structures by crustal extension. These features are due to the opening of the Mediterranean sea in relation with the rotation of the Corsica-Sardinia block.
The continental crust including the Provence basin has an average thickness of 30km (Labrouste et al., 1968) but varies from 22km in the Rhone Valley due to the Jurassic and Oligocene extensions (Sapin and Hirn, 1974; Guieu and Roussel, 1990) to 43km near the Alps boundary (Figure 2). The crustal thinning is marked by a Moho discontinuity depth increase from 15km in the Liguro-Provençal basin (Western Mediterranean sea) to 60km in the Alps with a triangular shape trend centered on the Rhone Valley. The seismicity of the Provence basin results from the convergence between Africa and Europe plates at a rate of 0.8 cm/year (DeMets et al., 1990). The potentially associated active SW-NE trending faults (Cevennes, Nimes, Salon-Cavaillon and Moyenne-Durance faults; e.g., Grellet et al., 1993; Sébrier et al., 1997 and Lacassin et al., 1998) consist in several faults segments which both affect basin and its basement.
Figure 2: Sediment thickness and Moho discontinuity depth of the Provence basin. Surface major faults traces and main geographical areas are indicated.
3. LINK BETWEEN GEOLOGICAL OBJECTS AND DEEP TEMPERATURES
Recent sediments related to sub-basins like those of the Provence basin are considered as thermally insulating (Lucazeau and Le Douaran, 1985) and their thickness can be correlated with warm areas. The higher is the thickness and the higher are the deep temperatures (e.g. the Vistrenque graben where temperatures of 130°C are reached at 3000m depth with 7km of sediments thickness; in Garibaldi et al., 2009).
Moreover, sub-basin opening generates the installation of fractures network which can act as conductive structures and support fluid circulation. Hydrothermal convection can be enhanced by the presence of permeable fractures as faults, depending on the fracture aperture and stress regime. These permeable zones allow the storage of shallow high temperatures (as potential geothermal reservoirs).
The Moho discontinuity can also be a cause of the increase of the temperatures in subsurface. It can be considered as an isotherm during a crustal thinning event and could thus affect the first kilometers of the subsurface if the thinning is not older than 30 Ma, which corresponds to the diffusive timescale for a 30km-thick crust. In the Provence basin, although the warm anomalies could partially be due to the crustal thinning associated with the Moho discontinuity depth decrease and to the local thickness of the sediments, this can only explain temperature variations at the horizontal scale of the thinning mechanism (several hundreds of kilometers) but not at those we observe at many places separated by a few tens of kilometers (Garibaldi et al., 2009).
4. THE ROLE OF THERMAL CONDUCTIVITY ON DEEP TEMPERATURES
As already explained by several authors, temperature-dependence (Clauser and Huenges, 1995) and porosity-dependence (Waples and Tirsgaard, 2002) of thermal conductivity may generate significant thermal anomalies in sedimentary basins. As evidenced by Vasseur et al. (1995), in a basin filled with thick argilleous sediments, the role of compaction with increasing pressure has to be considered because when the porosity decreases the clay particles orientation becomes horizontal and induce changes in thermal conductivity. By this way, two effects superimpose: first the decreasing amount of water (whose thermal conductivity is lower than that of sediments) induced by the compaction leads to the increasing of thermal conductivity; second the horizontal orientation of clay particles develops anisotropy and favors lateral heat transfer.
Thermal conductivity of volcanic and plutonic rocks is isotropic and it is sufficient to consider only the vertical component of the gradient when applying the Fourier’s law of heat conduction. In the case of sedimentary and metamorphic rocks, all components of the anisotropic thermal conductivity need to be considered because the lateral heat flow could be important (Clauser et Huenges, 1995).
The anisotropy of shallow clays depends on depth because of their compaction, mineralogical transformation and structural reorganization during their burial history (Vasseur et al., 1995). The conductivity of minerals generally decreases with rising temperature and the relative temperature effect would be stronger for minerals with a relatively high conductivity than those with a low conductivity as illustrated by Vasseur et al. (1995) and by Seipold (1998).
Garibaldi et al.
Conductivity is known for each particular mineral, but a rock is composed by many minerals with different conductivities, so thermal modelling of a sedimentary basin ideally requires reliable conductivity data. In-situ conductivity measurements provide the better way to assess the validity of the estimation of this parameter. But the information on anisotropy requires laboratory measurements on rock samples in different directions and differs from in-situ measurements because it represents an average over a much larger rock (Clauser et Huenges, 1995). Because of the lack of rock samples and since data from well logs were not available, we could neither know the precise mineralogical composition of each lithology nor made conductivity measurements. For many rocks, conductivity data are available from several compilations and are classified according to their type and origin (Birch, 1942; Clark, 1966; Desai et al., 1974; Kappelmeyer et Hänel, 1974; Roy et al., 1981; Cermak et Rybach, 1982; Robertson, 1988). We used such compilations, which are based on heterogeneous data in mineral composition, porosity, saturation and experimental conditions (Clauser and Huenges, 1995), to build the numerical model.
5. NUMERICAL MODELS OF THERMAL ANOMALIES: FLUID FLOW AND CONDUCTIVITY ANISOTROPY
In the following, two independent approaches are presented. The objective of these models is to emphasize on possible thermal processes leading to temperature anomalies of several tens of °C at a few km depth. The first example has been studied in detail by Garibaldi et al (2009). It deals with thermal anomalies generated by complex fluid flow patterns within permeable fault zones (Caine et al., 1996). The second example illustrates the effect of thermal conductivity anisotropy on deep temperatures. Both models are computed with the Comsol Multiphysics™ finite-element software. In the first case, heat equation is coupled with the Darcy law in a permeable zone, where permeability is depth-dependent. In the second example, the steady-state heat equation is used with two components for thermal conductivity of sediments. While the fluid flow effect is rather theoretical, parameters of the second example are varied according to measured heat flow and temperature data in the Provence basin.
5.1 Thermal Anomalies Induced By Fluid Flow in Fault Zones
In Figure 3, a vertical permeable zone, 800m wide and 5km deep, is inserted in a low permeability host rock. Its permeability is depth-dependent and follows the typical depth decrease proposed by Manning and Ingebritsen (1999). Fluid density and viscosity are temperature-dependent, and boundary conditions are those usually chosen for such problems (e.g. Rabinowicz et al., 1998; Gerdes et al., 1998). In the example of Figure 3, lateral boundaries are thermally insulating and impermeable. Bottom boundary is impermeable and a fixed heat flow of 100mW/m² is imposed. Atmospheric pressure is imposed at the top boundary, which is at a fixed temperature. Coupled heat and fluid flow are computed in steady-state. Additional details (porosity values, fluid density and viscosity variation with temperature, heat production rates) can be found in Garibaldi et al. (2009).
The example shown in Figure 3a depicts three irregular convective cells (streamlines in white), where fluid upwellings are associated with uplifted isotherms (dark lines) while downwellings deflect isotherms downwards. Development of multi-layered convective patterns (see
other examples in Garibaldi et al., 2009) is associated with the depth-dependence of permeability, which involves separate dynamical regimes. It follows that thermal lows can be surmounted by thermal ups, as illustrated in Figure 3a. Figure 3b shows horizontal temperature profiles at different depths. As it can be seen, positive (or negative) thermal anomalies greater than 10°C can be deduced from one place to the other. At 1km depth, both positive and negative anomalies are created (the temperature profile crosses one convective cell), while at 4 and 5 km depth, thermal anomaly is strictly negative (fluid velocity is higher at the center of the faulted zone, where adjacent downwellings merged together).
Figure 3: a) Convective pattern (streamlines in white, fluid velocity vectors in blue) and distorted isotherms (labels in °C) in black, across a permeable faulted zone. The varying color scale corresponds to the depth-dependence permeability; b) Corresponding horizontal temperature profiles at different depths.
5.2. Thermal Anomalies Induced By Anisotropy In this case, the Provence basin is geometrically modeled according to the Figure 4, corresponding to the A-A' section illustrated in Figure 2. Only the steady-state heat equation of conduction is considered. We chose the better different physical parameters enabling to reproduce as well as possible surface heat flow data and temperatures measured between the surface and 5km depth.
Figure 4: Geometry of the numerical model and physical parameters. Qm is the applied basal heat flow and A is the basement heat production. AA’ cross-section is indicated in Figure 2. In order to quantify the effect of an anisotropy, the model is first solved with an isotropic sedimentary basin and then with an anisotropic basin (Figure 5).
In the two cases, the boundary settings are the same: lateral boundaries are thermally insulating and a fixed temperature of 10°C is applied to the surface. Basal (mantle) heat flow
value has been chosen so that surface heat flow variations remain in the realistic range of 60-90 mW/m², as measured in the Provence basin (e.g. Lucazeau and Vasseur, 1989). In order to account for the possible large-scale increase of mantle heat flow at the basin center, a Gaussian variation was imposed between the edges of the basin, imposing a maximum value of 40 mW/m² at basin center, and 30mW/m² at the edges (Figure 4), in accordance with estimates of Lucazeau and Maihlé (1986).
Figure 5: Depth-dependent anisotropy ratio implemented in the sedimentary unit of the numerical model.
Figure 6 shows a comparison between measured surface heat flow data and computed surface heat flow in the two cases (isotropic and anisotropic cases). One must first recall that variations of surface heat flow can be explained by numerous processes which are not accounted for in this simple model. The objective of this comparison is to show that the range of heat flow variations in the models are in accordance with measured heat flow data (black dots in Figure 6). In addition, the account of a varying mantle heat flow (Figure 6) allows a slight increase in surface heat flow at the center of the model (green versus blue lines), thus preventing a too large discrepancy between data and models. The fact that anisotropy does not greatly affect surface heat flow variation can be explained by the anisotropy ratio values reaching 1 (isotropic case) at the surface.
Figure 6: Calculated surface heat flow along AA' cross-section (see Figure 2), with and without anisotropy vs. measured heat flow (Lucazeau and Vasseur, 1989). The surface heat flow is presented with a constant basal heat flow and with an increase of the basal heat flow at the center of the basin.
Garibaldi et al.
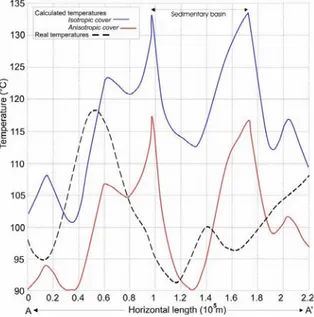
In Figure 7, we plotted the temperature variations at the lateral boundaries of the basin. The boundaries reach a maximum temperature of 134°C at 3000m depth in the case of an isotropic basin. This value decreases to 117°C in the case of an anisotropic basin. Calculated temperatures are closer to measured temperatures when anisotropy is accounted for.
Due to an increased component of the lateral heat transfer, the entire basin appears cooler. At the basin center, cooling reaches 23°C while this cooling is less efficient at basin boundaries (cooling of 17°C). It follows that thermal anomalies are amplified at basin boundaries (from 21°C, peak to peak, to 27°C in the anisotropic case).
Figure 7: Observed temperatures vs. calculated temperatures at 3000m depth along the AA’ cross-section located in Figure 2.
6. SUMMARY:
The variation of the temperatures in depth can be due to numerous effects that can interact at different scales. As shown by our thermal models, the regional scale warm anomalies observed in the Provence basin could partially be due to the Moho discontinuity depth decrease and to the local thickness of the sedimentary cover. These phenomena can explain thermal anomalies at the horizontal scale of several hundreds of kilometers.
In order to explain thermal anomalies separated by a few tens of kilometers (e.g. Figure 1), the warm anomalous areas should be interpreted with additional smaller scale processes. They could be explained by insulating sediments or by fluid circulation within faults.
When anisotropy of sediments thermal conductivity is accounted for, it turns out that lateral heat transfer is promoted towards basin boundaries, thus enhancing the amplitude of warm anomalies (Figure 7). The anisotropy is responsible for significant lateral heat transfer in non faulted areas, involving a bulk cooling of the sediments, whereas fluid circulation induces thermal anomalies in fault zones, where anisotropy cannot be developed as well. It must be however emphasized that the models presented here are computed separately, which implicitly ignores any interaction between porous sediments and faulted zones, for which coupled heat and fluid exchanges should occur.
REFERENCES
Bächler D., Kohl T., & Rybach L., 2003. Impact of graben-parallel faults on hydrothermal convection - Rhine graben case study, Phys. Chem. Earth, 28, 431-441. Birch, F., 1942. Thermal conductivity and diffusivity.
Handbook of Physical Constants, edited by F. Birch, J. F. Schairer, & H. C. Spicer, 243-266, Geological Society of America, Special Paper 36, New York. Bonté D., Guillou-Frottier L., Garibaldi C., Lopez S.,
Bourgine B., Lucazeau F. & Bouchot V. Subsurface temperature maps in French sedimentary basins: new data compilation and new interpolation. Submitted to Bulletin de la Société Géologique de France, March 2009.
Birch, F., 1942. Thermal conductivity and diffusivity. Handbook of Physical Constants, edited by F. Birch, J. F. Schairer, & H. C. Spicer, 243-266, Geological Society of America, Special Paper 36, New York. Bonté D., Guillou-Frottier L., Garibaldi C., Lopez S.,
Bourgine B., Lucazeau F. & Bouchot V, 2009. Subsurface temperature maps in French sedimentary basins: new data compilation and new interpolation. Submitted to Bulletin de la Société Géologique de France.
Caine S.J., Evans J.P., Forster C.B., 1996. Fault zone architecture and permeability structure. Geology, 24, 1025-1028
Calcagno P., Baujard C., Dagallier A., Guillou-Frottier L., & Genter A., 2009. Three-dimensional estimation of geothermal potential from geological field data: the Limagne geothermal reservoir case study (France). Proceedings of the Geothermal Resources Council GRC Annual Meeting, Reno, USA, October 4-7, 2009, in press.
Cermak, V. & Rybach L., 1982. Thermal conductivity and specific heat of minerals and rocks, in Landolt-Bornstein: Numerical Data and Functional Relationships. Science and Technology, New Series, Group V (Geophysics and Space Research), Volume la (Physical Properties of Rocks), edited by G. Angenheister, pp. 305343, Springer, Berlin-Heidelberg.
Clark, S.P.Jr., 1966. Thermal Conductivity. Handbook of Physical Constants, edited by S. P. Clark Jr., 459-482, Geol. Sot. of America, Memoir 97, New York. Clauser, C, and Huenges E., 1995. Thermal conductivity of
rocks and minerals, in Ahrens, T.J. (Ed.), Rock Physics and Phase Relations: a Handbook of Physical Constants, vol 3, AGU, Washington D.C., 105-126, AGU Ref. Shelf..
DeMets C., Gordon R. G., Argus D. F. & Stein S., 1990. Current plate motions. Geophys. J. Int., 101, 425-478. Demongodin L., Pinoteau B., Vasseur G. & Gable R., 1991.
Thermal conductivity and well logs: a case study from the Paris basin. Gephysical Journal International, 105, 675-691.
Desai, P.D., Navarro R.A., Hasan S.E., Ho C.Y., Dewitt D. P. & West T.R., 1974. Thermophysical Properties of Selected Rocks, 256 pp., CINDAS Report 23, Center for Information and Numerical Data Analysis and Synthesis (CINDAS), Purdue Univ., West Lafayette, Indiana (USA).
Fleming C.G., Couples G.D. & Haszeldine R.S., 1998. Thermal effects of fluid flow in steep fault zones, Geol. Soc. London, Sp. Pub., 147, 217-229.Gable R., 1978. Acquisition et rassemblement de données géothermiques disponibles en France. Rapport BRGM 78 SGN 284 GTH, 60p.
Gallagher K., Ramsdale M., Lonergan L. & Morrow D., 1997. The role of thermal conductivity measurements in modelling thermal histories in sedimentary basins. Marine and Petroleum Geology, 14, no. 2, 201-214. Garibaldi C., Guillou-Frottier L., Lardeaux J.-M., Bonté D.,
Lopez S., Bourgine B., Bouchot V, 2009. Relationship between thermal anomalies, geological structures and fluid flow: new evidences in application to the Provence basin (south-east France). Submitted to Bulletin de la Société Géologique de France.
Genter A., Guillou-Frottier L., Feybesse J.-L., Nicol N., Dezayes C. & Schwartz S., 2003. Typology of potential Hot Fractured Rock resources in Europe. Geothermics, 32, Issues 4-6, 701-710.
Grelle B., Combes Ph., Granier Th. & Philip H., 1993. Sismotectonique de la France métropolitaine dans son cadre géologique et géophysique. Mémoires de la Société Géologique de France. Mémoires N.S. 164, Vol. 1 et 2.
Guieu G. & Roussel J., 1990. Conséquence possible de l'extension crustale pré-oligocène en Provence méridionale : la mise en place gravitaire des chevauchements. Comptes Rendus de l'Académie des Sciences. Paris. T.311, Série II, 485-492.
Haenel R., Legrand R., Balling N., Gable R., Fanelli M., Prins S., Burley A.J. [et al.], 1980. Atlas of subsurface temperatures in the European Community. Luxembourg : Commission of the European Communities, Directorate-General Scientific and Technical Information and Information Management, 36 p., 41 leaves.
Kappelmeyer, O. & Hsnel R., 1974 Geothermics with Special Reference to Application, 238 pp., Gebtider Bomtrlger, Berlin-Stuttgart.
Labrouste Y., Baltenberger P., Perrier G., & Recq M., 1968). Courbes d’égale profondeur de la discontinuité de Mohorovicic dans le Sud-Est de la France. C. R. Acad. Sci. Paris., 266, D, 663-665.
Lacassin R., Meyer B., Benedetti L., Armijo R. & Tapponnier P., 1998. Réponse aux commentaires de P. AMBERT et al., C. R. Acad. Sci., Paris, opt. cit., 861-866.
Lucazeau F. & Le Douaran S., 1985. The blanketing effect of sediments in basins formed by extension: a numerical model. Application to the Gulf of Lion and Viking graben. Earth and Planetary Science Letters, 74, 92-102.
Lucazeau F., Vasseur G., Foucher J.-P. & Mongelli F., 1985. Second workshop on the European Geotraverse Project. Eds. D. A. Galson & S. Mueller, Eur. Sci. Found., Amsterdam, Netherlands (NLD), Venice, Italy, 59-63.
Lucazeau, F. & Mailhé D., 1986. Heat flow, heat production and fission track data from the Hercynian basement around the Provençal basin (western Mediterranean), Tectonophysics, 128, 335-356
Lucazeau F. & Vasseur G., 1989. Heat flow density data from France and surrounding margins. Tectonophysics, 164, 251-258.
Manning C.E. & Ingebritsen S.E., 1999. Permeability of the continental crust: implications of geothermal data and metamorphic systems, Rev. Geophys., 37, 127-150. Navarro S., Bitri A., Bourgine B., Martelet G., Nehlig P. &
Thinon I., 2006, unpublished map, BRGM.
Rabinowicz M., Boulègue J. & Genthon P., 1998. Two- and three-dimensional modeling of hydrothermal convection in the sedimented Middle Valley segment, Juan de fuca Ridge, J. Geophys. Res., 103, 24045-24065.
Robertson, E. C., 1988. Thermal properties of rocks. U.S.G.S. Open jile report 88-441, I06 pp., U. S. Geol. Survey, Reston, Va.
Roy, R.F., Beck A.E., and Touloukian Y.S., 1981. Ihermophysical properties of rocks, Physical Properties of Rocks and Minerals, edited by Y. S. Touloukian, W. R. Judd, and R. F. Roy, 409-502, McGraw-Hill/ CINDAS Data Series on Material properties, Volume H-2, McGraw- Hill, New York. Sapin M. & Hirn A., 1974. Results of explosion seismology
in the southern Rhône valley. Ann. Geophys. 30, 181-202.
Sébrier M., Ghafiri A. & Blès J.-L., 1997. Paleoseismicity in France: fault trench studies in a region of moderate seismicity. J. Geodyn., 24, 207-217.
Seipold U., 1998. Temperature dependence of thermal transport properties of crystalline rocks - a general law. Tectonophysics, 291, 161–171
Sibson, R.H., 1987. Earthquake rupturing as a mineralizing agent in hydrothermal systems. Geology, 15, 701–704. Somerton W.H., Preface: developments in Petroleum
Science, Volume 37, 1992, Pages v-vi
Vasseur G., Brigaud F. & Demongodin L., 1995. Thermal conductivity estimation in sedimentary basins. Tectonophysics, 244, 167–174.
Waples D.W. & Tirsgaard H., 2002. Changes in matrix thermal conductivity of clays and claystones as a function of compaction. Petroleum Geoscience, 8, no. 4, 365-370.