HAL Id: tel-02469393
https://tel.archives-ouvertes.fr/tel-02469393
Submitted on 6 Feb 2020HAL is a multi-disciplinary open access archive for the deposit and dissemination of sci-entific research documents, whether they are pub-lished or not. The documents may come from teaching and research institutions in France or abroad, or from public or private research centers.
L’archive ouverte pluridisciplinaire HAL, est destinée au dépôt et à la diffusion de documents scientifiques de niveau recherche, publiés ou non, émanant des établissements d’enseignement et de recherche français ou étrangers, des laboratoires publics ou privés.
Atresia in the Chilean Jack Mackerel Trachurus murphyi
Nichols, 1920 : implication for reproductive dynamics
Paola Alejandra Gonzalez Kother
To cite this version:
Paola Alejandra Gonzalez Kother. Atresia in the Chilean Jack Mackerel Trachurus murphyi Nichols, 1920 : implication for reproductive dynamics. Reproductive Biology. Université de Bretagne occi-dentale - Brest; Universidad de Antofagasta (Chili), 2019. English. �NNT : 2019BRES0050�. �tel-02469393�
T
HESE DE DOCTORAT EN COTUTELLE ENTRE
:
L'UNIVERSITE
UNIVERSIDAD
DE
BRETAGNE
OCCIDENTALE
DE ANTOFAGASTA - CHILE
COMUE UNIVERSITE BRETAGNE LOIRE.FRANCE
ECOLE DOCTORALE N°598 DOCTORADO EN CIENCIAS APLICADAS Sciences de la Mer et du littoral Mención Sistemas Marinos Costeros Spécialité : Biologie Marine
Atresia in the Chilean Jack Mackerel Trachurus murphyi Nichols, 1920:
implication for reproductive dynamics.
Thèse présentée et soutenue à l’Université d’Antofagasta du Chili, le 10 october 2019
Unité de recherche : Laboratoire des Sciences de l’Environnement Marin LEMAR (UMR 6539) Brest France. Laboratorio de Ecología y Evolución de Parásitos, Instituto de Ciencias Naturales Alexander von Humboldt- Universidad de Antofagasta Chile.
Par
Paola Alejandra GONZALEZ KOTHER
Rapporteurs avant soutenance : Dr. Luis CUBILLOS Université de Concepción au Chili.
Dr. Jean Yves TOULEC, Université de Paris VI - France
Composition du Jury :
Dr. Luis CUBILLOS Laboratoire EPOMAR Ciencias
Naturelles et Océaographiques de Rapporteur L’Universté de Concepcion ; Chile.
Dr. Jean Yves TOULLEC Laboratoire AD2M
Rapporteur Sorbonne Université France Dr. Arnaud TANGUY Laboratoire AD2M
Examinateur Sorbonne Université France Dr. Maria Teresa GONZALEZ Laboratoire LEP et EM
Présidente du Jury Université d’Antofagasta (Chili)
Dr. Marcelo OLIVA Laboratoire Ecología y Evolución Parasitos marinos
Co-directeur de thèse Université d’Antofagasta (Chili) Dr. Dario MORAGA Laboratoire LEMAR - IUEM Co-directeur de thèse Université de Brest UBO France
1
2 CONTENTS ACKNOWLEDGMENTS 4 LIST OF TABLES 5 LIST OF FIGURES 6 1.- GENERAL INTRODUCTION 9
1.1.- Fisheries and fish reproduction 10
1.2.- Maturation and reproductive success 11
1.3.- Reproductive cycle of female 15
1.4. Oogenesis 17
1.5.- Follicular atresia 20
1.6.- Parasites affect reproduction 25
1.7. Molecular approach to study of atresia 26
1.8.- Biological Model: Chilean Jack mackerel, Trachurus murphyi 28
2. CONTEXT OF THE THESIS 32
3. HYPOTHESIS 33
4. OBJETIVES 34
5. RESULT 35
5.1 CHAPTER 1 36
A review of the Potential Genes Implicated in Follicular Atresia in Teleost Fish 5.2 CHAPTER 2 44
Atresia in the Chilean jack mackerel Trachurus murphyi(Teleostei, Carangidae): A first assessment for the South-eastern Pacific Ocean. 5.3 CHAPTER 3 69
First transcriptomic approach to the study of atresia in Trachurus murphyi using RNA-Seq analysis: genes associated with the follicular atresia. 5.4 CHAPTER 4 101 The first report of liver coccidian Goussia cruciata in jack mackerel Trachurus murphyi from the South Pacific and its relationship with host variables.
3
6
.-
GENERAL DISCUSSION AND CONCLUSIONS107
6.1 General discussion 107 6.2 Conclusions 114 7. FORTHCOMING 116 8. REFERENCES 118 RESUMEN 146 RÉSUMÉ - ABSTRACT 147
4 ACKNOWLEDGMENTS
I wish to express my gratitude to all the people who made this work possible.
I thank my sponsoring professor Dr. Marcelo E. Oliva for his advice, criticism, revision of the manuscript and for his help in the development of this research. To my co-sponsor professor Dr. Dario Moraga who gave me the opportunity to do the thesis in co-tutela in Laboratoire des Sciences de l’Environnement Marin (LEMAR) - Université de Bretagne Occidentale, Brest, Francia; and to learn about of transcriptomics and its application. To Dr. Arnaud Tanguy for his support and patience in teaching me about transcriptomics. To Dr. Maria Teresa González for all her help in the course of this thesis, and for showing me the fascinating world of coccidian. To the members of commission, Dr. Jean Ives Toullec and Dr. Luis Cubillos for their advice and comments to improve the manuscript. To CONICYT N° 21130197 doctoral scholarship and CONICYT+PAI/ ATRACCION DE CAPITAL HUMANO AVANZADO DEL EXTRANJERO + Folio N°PAI80160001.To "Laboratoire d'Excellence" LabexMER (ANR-10-LABX-19) and co-funded by a grant from the French government under the program "Investissements d'Avenir" for the financial support that allowed me to develop my studies as well as my research stay in France. In the same way, I thank Dr. Aquiles Sepúlveda and Dr. Alexandre Grechina of the Instituto de Investigación Pesquera (INPESCA, Talcahuano) for database and the logistics provided to obtain samples for transcriptomics. To the Facultad de Ciencias of the Universidad Católica de la Santísima Concepción, for all the support granted during the doctoral period, especially to Dr. Guillermo Herrera and Professor Javier Chong. To professors, colleagues and PhD students of FACIMAR, for their timely comments and criticisms; and to all the people who in one way or another collaborated in the development of this Thesis. To my family and friends who always supported me, even in my silences, thanks you all.
5 LIST OF TABLES
INTRODUCTION
Table 1. Phases of atresia and its main characteristics determined in fish, according to
Hunter & Macewicz, 1985 and Valdebenito et al. 2011
RESULT CHAPTER 1
Table 1. Factors involved in reproductive dysfunctions and follicular atresia in teleost fish. Table 2. Potential molecular marker genes for follicular atresia in teleost fish
CHAPTER 2
Table 1. Cruises performed for the evaluation of spawning biomass (DEPM) in the Chilean
jack mackerel, Trachurus murphyi from oceanic spawning area off central Chile between 2004 and 2014
Table 2. Chi- Square values of the binomial GLM model analysing the effects of sea surface
temperature (SST), gonadosomatic index (GSI), condition factor (K), presence/absence of postovulatory follicles (POF) and month/year (MY) on the prevalence (presence-absence data) of atresia and normal GLM for intensity of atresia in Chilean jack mackerel Trachurus murphyi. Model 1= all atresia stages and their combinations, model 2= only alpha atresia and model 3= only beta atresia. AIC= Akaike’s Information Criterion, D2= deviance of model, AUC= area under ROC curve, n= number total females
Table 3. Chi- Square values of the poisson GLM model analysing the effects of fork length
(FL), condition factor (K), and stage of females (non-atresia, atresia and postovulatory follicles, POF) on the batch fecundity and relative fecundity for Chilean jack mackerel Trachurus murphyi
CHAPTER 3
Table 1. Data descriptions for assembly and annotation of T. murphyi transcriptome Table 2. Primers for quantitative PCR (qPCR) amplification of cDNAs in T. murphyi. (F =
Forward, R = Reverse)
Table 3. Apoptosis encoding genes in liver and ovary in transcriptome of T. murphyi. Table 4. Caspase and caspase activity encoding genes in liver and ovary transcriptome of
6 LIST OF FIGURES
INTRODUCTION
Figure 1. Schematic representation of energy flow allocation. Open arrows represent energy
routes while solid arrows represent factors affecting energy allocation. (Source: Saborido-Rey and Kjesbu, 2005)
Figure 2. Relationship between potential fecundity and fish length for six species of
different environments. (Source: Saborido-Rey and Kjesbu, 2005)
Figure 3. Conceptual model of universal reproductive traits in fishes. (Source:
Lowerre-Barbieri et al., 2011)
Figure 4: Schematic representation of environmental cues that regulate reproductive cycle
in temperate fish species. (Source: Miranda et al., 2013)
Figure 5. Model depicting the summary of processes and events during oocyte growth,
ovary maturation, and early and late embryogenesis in fishes (Source: Reading et al., 2018)
Figure 6. Progression of ovocyte development from primary growth oocyte (A), alveolo
cortical oocytes and initial vitellogenic oocytes (B), advance vitellogenic oocyte (C), hydrated oocytes (D) to Ovulation (E) in Trachurus murphyi. (Photo: P G-K)
Figure 7. Schematic representation of the female teleost reproductive cycle, including
points in development where nutrition and environmental factors can cause spawning omission to occur. (Source: Rideout et al., 2005).
Figure 8. Principal sexual dysfunctions in females under aquaculture condition. (A) The
inhibition of vitellogenesis; (B) inhibition of oocyte maturation, resulting in atresia of postvitellogenic oocytes; (C) inhibition of spawning, resulting in retention of ovulated oocytes. (Source: Mañanós et al. 2009).
Figure 9. Atretic follicles in Trachurus murphyi ovaries. (a) = non atretic oocyte, (b) A1-A
= Initial alpha atresia, (c) A2-A = Intermediate atresia oocytes, (d) A3-A = Advance alpha stage atresia, (e) B-A = Beta atresia oocyte, and (f) G-A = Gamma atresia. ZR= Zona radiata. Scale bar = 50 mm (Photo P G-K)
Figure 10. Oocyst and sporocysts of coccidian Goussia cruciata: fresh mature oocyst in
liver (A), fibrous capsule of connective tissue surrounding oocysts in ovary (arrow) (B) and free oocyst in stroma of ovary (arrow) (C) of T. murphyi (Photo: P G-K)
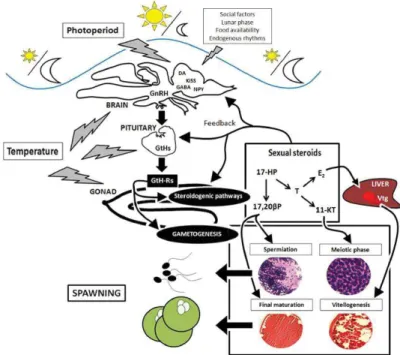
Figure 11. Schematic representation of the environmental influences on the regulation of
fish brain–pituitary–gonad axis. Photoperiod information is decoded by different hormonal pathways at brain level and together with other external factors (social interactions, lunar phase, food availability) and endogenous rhythms affect the reproductive functions. (Source: Miranda et al., 2013)
Figure 12. Chilean jack mackerel, Trachurus murphyi Nichols 1920
Figure 13. SSB spawning biomass (t), average fishing mortality, recruitments at age 1
(millions) and catches (thousands t). The blue lines represent the annual references of the RMS. (Source: SPRFMO 2018)
Figure 14. Conceptual spatial model of the jack mackerel population in the southeastern
7 RESULT
CHAPTER 2
Figure 1. Frequency distribution (%) of reproductive phase of female Trachurus murphyi
for months and spawning seasons (S). Numbers of specimens examined per month
Figure 2. Gonadosomatic Index (GSI), condition factor (K) and prevalence of atresia (%)
for reproductive phase. A= Alpha-atresia, AC= Cortical atresia, B= Beta-atresia, G= Gamma-atresia
Figure 3. Atretic follicles in Trachurus murphyi ovaries. Histological sections were stained
with haematoxylin and eosin. (a) = non atretic oocyte, (b) A1-A = initial alpha atresia, (c) A2-A = intermediate atresia oocytes, (d) A3-A = advance alpha stage atresia, (e) B-A = beta atresia oocyte, and (f) G-A = gamma atresia. ZR= Zona radiata. Scale bar = 50 mm
Figure 4. Frequency of atresia (%) and Intensity of atresia (IA) for months and spawning
seasons (S). A= Alpha-atresia, AC= Cortical atresia, B= Beta-atresia, G= Gamma-atresia
Figure 5. Relationships of (a) Batch Fecundity and (b) Relative Fecundity in relations of
females stages of Trachurus murphyi (Non-atresia, atresia and postovulatory follicle (POF)
CHAPTER 3
Figure 1. A non-atretic ovary (A) and atretic ovary with alpha atresia (arrow) (B) from T.
murphyi.
Figure 2. GO ontology of the genes exhibiting a RPKM above 5 between atretic females
and non-atretic females libraries of T. murphyi for Biological process, Cellular component, Molecular function and Protein Class.
Figure 3. Differential expression between gonads and liver (n=25). Expression ratio are
expressed as a relative expression between the two tissues. *: statistical significant value (p<0.05) after t-test.
Figure 4. Differential expression between individual with atresia (n=16) and without atresia
(n=5) in liver. Expression ratio are expressed as a relative expression between the two tissues. *: statistical significant value (p<0.05) after t-test
Figure 5. Differential expression between individual with atresia (n=16) and without atresia
(n=5) in gonads. Expression ratio are expressed as a relative expression between the two tissues. *: statistical significant value (p<0.05) after t-test
Figure 6. Phylogenetic relationship of the T. murphyi and other teleost fish Follistatin-like
genes.
Figure 7. Phylogenetic relationship of the T. murphyi and other teleost fish in the FABP
family.
CHAPTER 4
Figure 1. Relationship between the abundance (number of coccidians by liver smears) of
G. cruciata and host body indices of T. murphyi. a Fish total length, b Fish condition factor and c Hepatosomatic index. (Circle November, square February, triangle May)
8 GENERAL DISCUSSION AND CONCLUSIONS
Figure 1. Conceptual model for variables that modeling the follicular atresia in Chilena jack
mackerel, Trachurus murphyi. The black arrows indicate direct effect this varables in atresia, and red arrow indicate effect of atresia in reproduction. Question mark indicate mechanics not known. SST: See superficial temperature, Y-M: Year-Month, GSI: Gonodosamitic index, K: Condition factor.
9 1. GENERAL INTRODUCTION
10 1.1 Fisheries and fish reproduction
Fish populations include individuals of different age, size, condition factor and maturity stages and therefore, growth and reproductive dynamics, must be explored from a population (demographic) perspective (Saborido-Rey and Kjesbu 2005). Applied fisheries reproductive biology has traditionally focused on estimating size and age at sexual maturity and fecundity as important components of the fish life history (Stearns 1992), whereas there is little focus on assessing reproductive traits at the individual level and how they may impact reproductive success (Lowerre-Barbieri 2009; Wright and Trippel 2009). The amount of energy allocated to growth and reproduction will depend on several factors, some of them intrinsic (genetic, physiological) while others are environmentally driven (temperature and feeding). Intrinsic factor, e.g. energy allocated for maintenance, growth and reproduction is partitioned between survival (including survival behaviour), storage of energy reserves, somatic growth, production of gametes and reproductive activity, all which may affect energy acquisition, assimilation and distribution through feedback regulating systems. While, external factors influence the level of energy intake and allocation patterns. Energy invested in growth and reproduction can be reallocated to other locations (by e.g. reduction in reserves, loss of somatic weight, yolk absorption).
A fish stock’s ability to produce viable eggs and larvae has been termed Stock Reproductive Potential (SRP) and is a function of maturity, fecundity, egg quality, and spawn timing (Trippel, 1999). Both environmental change and fishing can impact components of SRP in various ways and the effects of these factors can be difficult to distinguish. Fishing can impose levels of mortality on juveniles and adults that far exceeds natural mortality (Mertz and Myers, 1998), leading to a truncation in age and size structure and a reduction in reproductive life span (Murawski et al., 2001) and spawning time (Scott et al., 2006). Variation in spawning time can be critical to reproductive success, because it affects the
11
early environmental conditions experienced by progeny, and the period they have to complete phases of development (Cushing, 1990). The understanding of the relationship between spawner abundance and subsequent recruitment is the most important issue in fisheries biology and management (Myer, 2001)
1.2 Maturation and reproductive success
Fish reproduction studies depend on recognizable macroscopic and microscopic (histological analysis) features of gonads together with length, somatic weight and occasionally liver and gonad weight. Ovaries for potential fecundity analysis are usually sampled from mature females, when vitellogenesis is in advanced state. The data derived from these collections are used to correlate maturity stages and fecundity with size and condition factor (e.g. Kjesbu et al., 1998; Yoneda and Wright, 2004). The development of the gonads during gametogenesis can be described at a macroscopic level using two basic indices, maturation staging and the Gonadosomatic Index (GSI). Both indices have to be supported by microscopical analysis such as histology of the developing gonads. The basic indices are most valuable when large samples of fish are taken; for example, in surveys to estimate the reproductive potential of a population subjected to fishing (Wootton and Smith, 2015). It is still far from understanding the dynamic processes associated with the egg formation from the time germ cells turn into oogonia, until the release of ova during spawning. Studies on endocrine, cellular and ultra-structural aspects of oogenesis and oocyte growth (Wallace and Selman, 1981, 1990; Le Menn et al., 2007) have been increased strongly in recent years, mainly due the advance of molecular tools, including large scale transcriptome and proteome analyses, but the information is far from complete (Cerdà et al., 2008a,b).
12
Fisheries remove individuals at various trophic levels in the ecosystem affecting the distribution of energy and hence the amount of energy available for a particular fish (Saborido-Rey and Kjesbu 2005). Species that reproduce only once (semelparous life history), e.g. some salmonids, invest all the energy in reproduction before dying. Species with repeated reproduction (iteroparous life history) save some energy for survival and possible further growth.
Reproductive activity has an energetic cost (Roff, 1983), females are limited in the time and resources that can devote to producing offspring, decreasing future growth, condition, survival, and reproductive output (Figure 1). Optimal energy allocation is dependent on inherited components (energetic thresholds and endogenous rhythms) and environmental conditions (e.g., food, and temperature). The part of ingested energy remaining after allocation to metabolic process is derived to somatic growth and reproductive investments, which are hence in mutual competition (Brosset et al., 2016). Some species spawn and feed in separate areas, during different seasons, by storing energy and drawing on it later for reproduction (i.e. capital breeding). Other species spawn using energy acquired locally, throughout a prolonged spawning season, allocating energy directly to reproduction (i.e. income breeding) (McBride et al., 2015). Spawning is the most metabolically demanding activity whether it occurs at a single spawning event or over multiple-spawning seasons (McBride et al., 2015)
13
Figure 1: Schematic representation of energy flow allocation. Open arrows represent energy routes while solid arrows represent factors affecting energy allocation. (Source: Saborido-Rey and Kjesbu, 2005)
Larger and older individuals have different reproductive attributes than smaller and younger (Trippel et al., 1997). In many species, the larger (older) females are reported to develop earlier, spawn more frequently, and have an extensive individual spawning seasons than younger, smaller fish (Ganias et al. 2003; Wright and Trippel 2009). In addition, there is a strong relationship between body size and fecundity (Figure 2); thus, older females may disproportionately contribute to the population egg production (Claramunt et al., 2007; Lowerre-Barbieri et al., 2011b). Egg produced by a fish population is a function of the abundance of mature females, their fecundity and the proportion of females that release ova at spawning (Trippel and Harvey 1990)
14
Figure 2. Relationship between potential fecundity and fish length for six species of different environments. (Source: Saborido-Rey and Kjesbu, 2005)
For fishery management and aquaculture, a critical issue is the knowledge of fish reproduction attributes such as the development of gametes, time of spawning, spatial distribution of mature individuals, and gonadosomatic index (Brown-Peterson et al., 2011; Garner et al., 2012). In addition, other indices such as the condition factor and hepatosomatic index, are used together with the gonadosomatic index because these indices facilitate the understanding of energetic dynamics associated with fish reproduction (Jobling, 1995; Santos et al., 1996; Maddock and Burton, 1998). Since knowledge of reproductive biology is a critical component for an adequate fisheries and aquaculture management, further research regarding the physiological mechanisms underlying
15
reproductive biology are necessary (Gardner et al., 2012). For species with an extensive distribution and are highly migratory, assessment of reproductive processes is especially important because these fish species often occupy a wide range of different habitats (Zhu et al., 2014) and some of the considered reproductive traits may vary, reflecting different life history strategies (Silva et al., 2013)
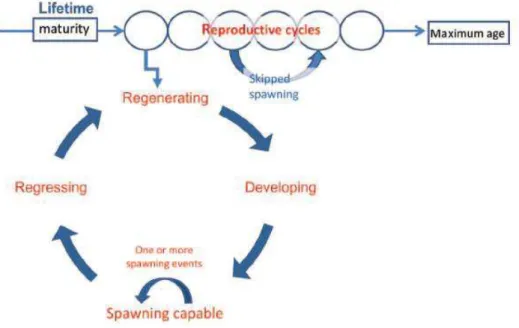
1.3 Reproductive cycle of female
The reproductive cycle of female involves a period of primary oocyte growth, followed by a yolk accumulation (vitellogenesis), and then the final maturation and ovulation of oocytes prior to spawning (Rideout et al., 2005, Lowerre-Barbieri et al., 2011b). Reproductive cycles represent the gonadal development needed for mature fish to spawn at the appropriate time (Figure 3). In iteroparous species, which multiple reproductive cycles include removal of residual oocytes by atresia and production of a new generation of oocytes for the next spawning season (Rideout et al., 2005; Lowerre-Barbieri et al., 2011b)
Figure 3. Conceptual model of universal reproductive traits in fishes. (Source: Lowerre-Barbieri et al., 2011)
16
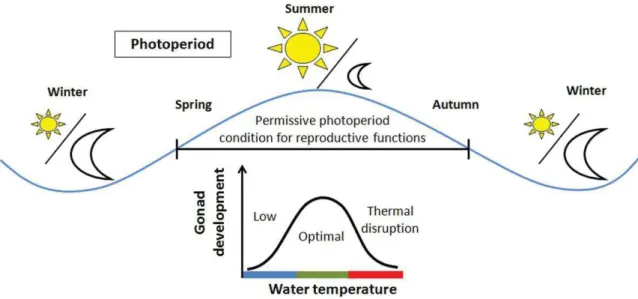
Although spawning time is in part a heritable trait (Leder et al., 2006; Otterá et al., 2012), reproductive cycles are often influenced by environmental conditions. The maturation is a complex process that must be perfectly timed to ensure that spawning or critical off-spring feeding periods coincide with higher seasonal food availability (Mañanós et al., 2008). Fish have evolved to entrain maturational development with the predictable but constantly changing environmental parameters (e.g. temperature, photoperiod). As stated by Wootton and Smith (2015) reproductive process are conditioned by endogenous cycles and external environmental factors that are critical to finish the process.
Figure 4: Schematic representation of environmental cues that regulate reproductive cycle in temperate fish species. (Source: Miranda et al., 2013)
Several teleost fish can be exposed to temperatures that are extremely different from their optimal temperature range and gametogenesis can fail and atresia could be induced (Mañanós et al., 2008). Temperature has direct effects on metabolic rates and consequently can modulate the rate at which all physiological processes can occur, including those related to reproduction (Figure 4) (Wang et al., 2010; Miranda et al., 2013). Temperature is considered a key factor that affect reproductive development, e. g. spawning time or expression and activity of regulatory proteins that influence the rate of oocyte growth and
17
development (Pankhurst and Porter 2003). The reproduction in fish, compared with other physiological processes, only occurs in a bounded temperature range (Pörtner and Farrell, 2008). It is well known that abnormal water temperature conditions could generate a mismatch between reproduction and optimal environmental conditions for progeny development (Durant et al., 2007; Miranda et al., 2013)
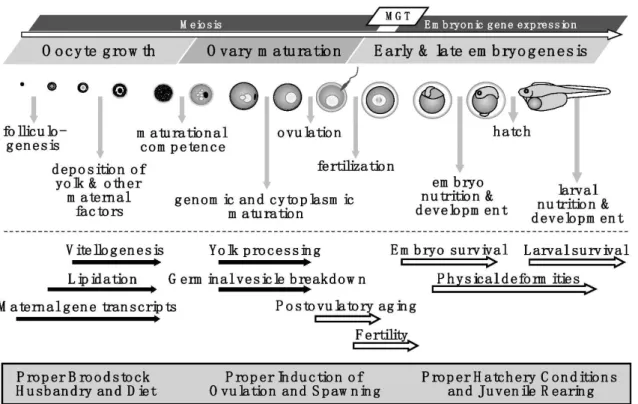
1.4 Oogenesis
Oogenesis is defined as the developmental process by an oogonium becomes a fully-grown, mature, and a fertilizable oocyte develop into a viable egg and followed fertilization become an embryo. Embryo viability depends on the accumulation of specific maternal transcripts that are deposited during developing oocytes and successive developmental stages of the embryo (Babin et al., 2007; Lubzens et al., 2017) (Figure 5)
Figure 5. Model depicting the summary of processes and events during oocyte growth, ovary maturation, and early and late embryogenesis in fishes (Source: Reading et al., 2018)
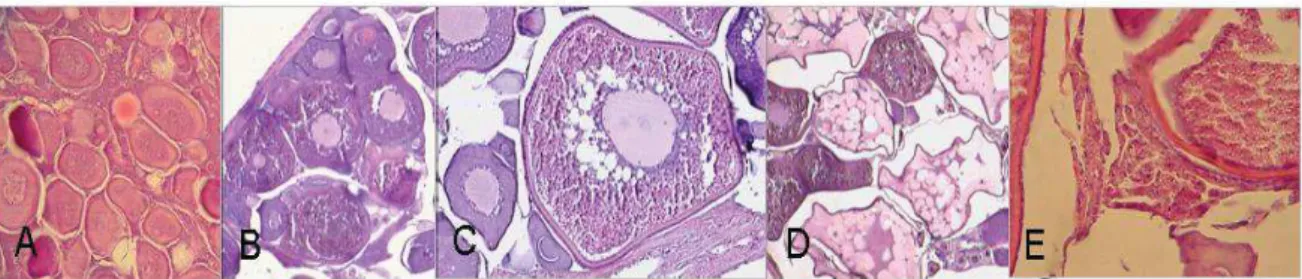
18
In numerous species of teleost fish, particularly in oviparous species, the process of oogenesis is similar and takes place within the so-called “follicle complex”. This “follicle complex” is composed by an inner surrounding follicular or granulosa cells, outer theca layers (including blood vessels and extracellular matrix), and a basement membrane between granulosa and theca cells (Grier, 2000; Jalabert, 2005; García-López et al., 2011). Progression of oocyte development from primary growth oocytes to ovulation (Figure 6), to secondary growth, which begins with the cortical alveolar stage and then proceeds through vitellogenesis, which can be broken into substages associated with the extent of yolk globules or platelets in the ooplasm. Oocyte maturation occurs after the appropriate trigger and can include germinal vesicle migration, yolk coalescence, germinal vesicle breakdown, and in pelagic spawners, hydration. At ovulation, the follicle ruptures and the oocyte is released. Postovulatory follicles remain in the ovary, where they are resorbed. (Lowerre-Barbieri et al., 2011b) (Figure 6)
Figure 6. Progression of ovocyte development from primary growth oocyte (A), alveolo cortical oocytes and initial vitellogenic oocytes (B), advance vitellogenic oocyte (C), hydrated oocytes (D) to Ovulation (E) in Trachurus murphyi. (Photo: P G-K)
During the third stage, the oocytes increase in size and often acquire oil droplets and cortical alveolar vesicles, indicating the first gonadotropin-dependent stage of development (Lowerre-Barbieri et al., 2011b), then the glycoproteins, digestive enzymes, and mucopolysaccharides are incorporated into cortical alveolar oocytes (Carnevali et al., 2006). In this progression, the meiotic phases occurred similarly to other vertebrates during the
19
oogenesis (Le Menn et al., 2007; Lubzens et al., 2010). Oocytes in the primary growth and vitellogenic stages are in arrested diplotene step of the first meiotic prophase until the appropriate hormonal stimulus (Grier, 2000; Le Menn et al., 2007; Lowerre-Barbieri et al., 2011a). The oocytes, their follicular cell and different stages of development can produce and respond to different types of molecular signals during the maturation (Jalabert, 2005; Babin et al., 2007; Lubzens et al., 2010). Therefore, different structural and molecular events occurred within oocyte growth, e.g. the accumulation of specific maternal RNA, lipids, vitamins, and hormones (Babin et al., 2007; Agullero et al., 2007; Sullivan et al., 2015). The oocytes undergo dramatic changes during development because they accumulate RNA transcripts, glycoproteins and yolk proteins that are necessary to ensure proper fertilization and embryogenesis (Breton and Berlinsky, 2014).
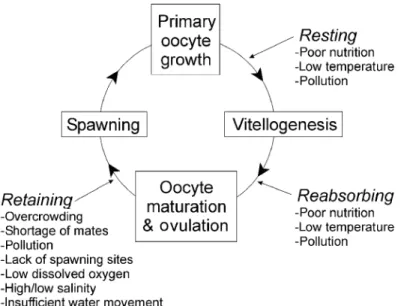
Three different ovarian follicle developmental phases can be found in fish: synchronous, group-synchronous and asynchronous ovaries. The synchronous ovarian is characterized by a simultaneous development of all oocytes which ovulate at the same time (total spawners) and is typical of semelparous species. In the group-synchronous and asynchronous ovaries, different developmental stages of oocytes can be simultaneously observed inside the ovaries. These ovarian developments are typical of iteropauros species that spawn several times (batch spawner) during the spawning season (Murua and Saborido-Rey, 2003). Three forms of spawning have been proposed based on the development at which the reproductive cycle is interrupted: (1) Retaining, eggs become fully ripened and may be ovulated but are never released due for instance to overcrowding, low dissolved oxygen, high/low salinity and others (2) Reabsorbing, oocytes begin to ripen for the next spawning season but shortly thereafter, gametogenesis is halted and all vitellogenic oocytes are reabsorbed via follicular atresia; and (3) Resting, oldest generation of oocytes remains in a pre-vitellogenic state
20
throughout the year, i.e. no ripening occurs (Rideout et al., 2005). The two last form can be due to poor nutrition, low temperature and pollution (Figure 7).
Because teleost fish exhibit a large diversity of reproductive strategies (e.g. oocyte and egg development, recruitment of oocytes and spawning pattern), it remains difficult to clearly understanding the molecular and physiological underlying mechanisms (Tingaud-Sequeira et al., 2009; Martyniuk et al., 2013).
Figure 7. Schematic representation of the female teleost reproductive cycle, including points in development where nutrition and environmental factors can cause spawning omission to occur. (Source: Rideout et al., 2005).
1.5 Follicular atresia
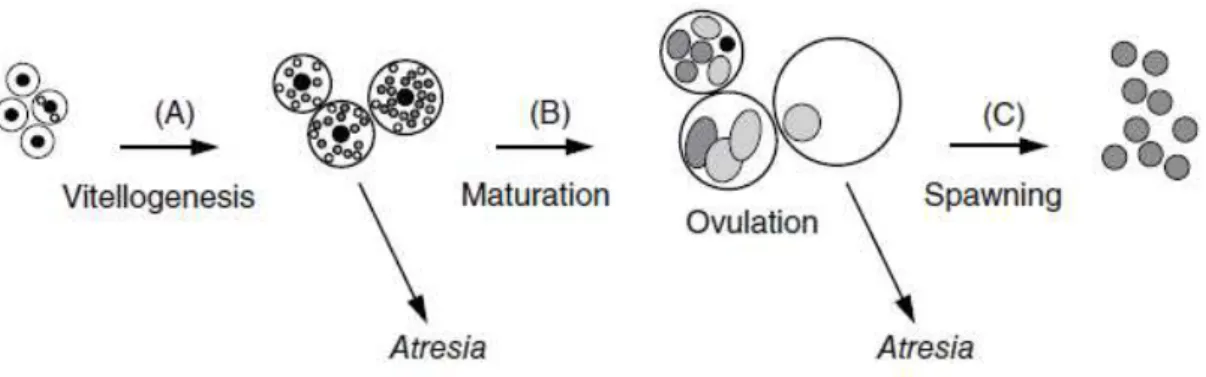
Follicular atresia, or atresia, is a degenerative process common in ovaries of fishes and other vertebrates under natural and experimental farmed conditions (Tyler and Sumpter, 1996). Atresia has been defined as a normal process that takes place inside the ovaries (Figure 8), but is considered to be a reproductive dysfunction when the vitellogenic oocytes cannot complete their development increase of atretic oocytes, a process also known as skipped spawning (Rideout and Tomkiewicz, 2011).
21
Atresia is observed in all stages of the reproductive cycle, although more frequently in regressing ovaries during the post-spawning period (Miranda et al., 1999; Wootton and Smith, 2015). Quantification of ovarian atresia is important in fisheries studies that aim to assign females to their reproductive state (Hunter and Macewicz, 1985), or to correct estimates of realized annual fecundity in determinate spawners (Hunter et al., 1992; Kjesbu et al., 1991; Kurita et al., 2003).
Figure 8. Principal sexual dysfunctions in females under aquaculture condition. (A) The inhibition of vitellogenesis; (B) inhibition of oocyte maturation, resulting in atresia of postvitellogenic oocytes; (C) inhibition of spawning, resulting in retention of ovulated oocytes. (Source: Mañanós et al. 2009).
The increased atretic oocytes can have serious consequences for fish populations because nonspawned vitellogenic oocytes may reduce the reproductive potential due a decrease of the number of viable offspring (Rizzo and Bazzoli, 1995; Miranda et al., 1999; Santos et al., 2005). Atresia is most often observed in vitellogenic oocytes, but it can occur at any phase of development (Johnson et al., 2009) and at any time during the spawning season (Rideout et al., 2000; Morua et al., 2003).
The sequential steps of follicular atresia in teleosts and other oviparous vertebrates can be summarized as: 1) the disorganization of the nucleus and cytoplasm of the oocyte; 2) the distortion of the follicle with the fragmentation of the zona radiata (or zona pellucida), 3) subsequently broken up of the zona radiata into segments of irregular shape; 4) the fusion
22
and liquefaction of the yolk globules, 5) hypertrophy of the follicle cells which acquired phagocytic features for ingestion and digestion of the yolk, 6) in the advances stages of atresia process, the ooplasm is invaded by the follicular and thecal cells forming a yellow-brownish pigmented cell (Miranda et al., 1999; Ganias et al., 2003; Lubzens et al., 2010; Morais et al., 2012).
Most studies have focused in the quantification of atresia in the early stages of resorption (i.e. alpha stage) (Murua et al., 2003) because the distinction of later stages is often not easy to identified (Hunter and Macewicz, 1985). Moreover, due to their short duration early atretic stages may provide more reliable measures of atretic rate (Hunter and Macewicz, 1985). Although late follicular atresia is rarely considered and quantified, its study may provide useful information on past reproductive activity (Ganias et al., 2008).
In recent years, the study of atresia has increased due its seem to be the major cause of reduced fecundity for any species (Ganias et al., 2008). Additionally, the recording of atresia allows us to assign real reproductive status for female, indicating the end of the spawning period as well as whether females failed in their spawning cycle, a phenomenon known as skipped spawning (Hunter and Macewicz, 1985; Ganias et al., 2008; Rideout et al., 2000). The histological characteristics used to identify the stages of atresia are indicated inTable 1 and Figure 9. The alpha- and beta-atresia stages have been independently assessed as a potential mechanism to determine previous spawning events (Ganias et al., 2008). The initial alpha-atresia is taken into account and quantified for the assignment of females to different spawning states (active, inactive/immature) as well as to determine the reproductive variables in fish population studies, such as fecundity and length/age at first maturity (Hunter and Macewicz, 1985; Karlou-Riga and Economidis, 1997; Ganias et al., 2008). Normally, beta-atretic oocytes are not considered because they may be confused with
23
Post Ovulatory Follicles (POF) in spawning individuals (Witthames et al., 2009; Kjesbu et al., 2010).
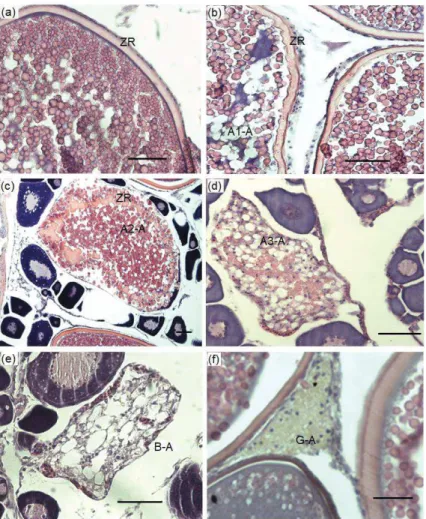
Figure 9. Atretic follicles in Trachurus murphyi ovaries. (a) = non atretic oocyte, (b) A1-A = Initial alpha atresia, (c) A2-A = Intermediate atresia oocytes, (d) A3-A = Advance alpha stage atresia, (e) B-A = Beta atresia oocyte, and (f) G-A = Gamma atresia. ZR= Zona radiata. Scale bar = 50 mm (Photo P G-K)
Understanding the trends and dynamics of atretic oocytes allows to identify any change in the spawning period, such as a potential skipped spawning (Rideout and Tomkiewicz, 2011). Spawning events and atresia are temperature-dependent processes (Hunter and Macewicz, 1985; Witthames and Greed, 1995) and females can spawn or delay during migration if the temperature regime is not suitable for spawning conditions (Ma et al., 1998; Haslob et al., 2013).
24
Table 1. Phases of atresia and its main characteristics determined in fish, according to Hunter and Macewicz (1985) and Valdebenito et al. (2011)
Phase of Atresia
Main characteristics
Alpha (α) Characterized by chorion ripples, nuclear disruption, early breakage of yolk globules and hypertrophy of granulosa cells
Beta (β) The granulosa cells migrate and engulf the yolk. The teak cells are not observed invading the interior of the oocyte. The end of beta atresia is characterized by the complete disintegration of the chorion Gamma
(γ)
The reabsorption of the oocyte content continues during this stage, until the complete reabsorption of the content. Small, irregular-looking follicles appear in yellow-brown staining with H-E staining. The thecal cells of the follicle still surround the remaining oocyte Delta (δ) It is characterized by the presence of residual components after the
reabsorption of yolk and cytoplasm. Dark yellow-brown pigments and granular pigment are observed in the granulosa cell.
Epsilon (ε) Difficult to evaluate, some authors have postulated that at this stage "cells of the corpus luteum could differentiate into new oogonial cells"
For the highly migratory carangid the yellowtail kingfish Seriola lalandi Valenciennes 1833, a temperature exceeding the optimal range can cause an aborted spawning event (Poortenaar et al, 2001; Stuard and Drawbridge, 2013). Similarly, for Sardina pilchardus, the high prevalence of atresia was also related to temperature (Ganias, 2009). Additionally, several hydrographic conditions (salinity, pH, winds, currents, day length and chlorophyll-a), or a combination of them may explain the presence and intensity of atresia (number of atretic oocytes), because the indeterminate spawners may respond quickly to changes in environmental condition (Haslob et al., 2013), but the level of energy reserves available at the beginning of spawning season is also an important factor to understand atresia.
Endogenous factors such as age, length or nutritional status may induce the presence of atretic oocytes. In the sardine of Monterrey Sardinops sagax, temporal changes in the prevalence of atresia (the number of atretic fish divided by total number of examined fish) have been observed, an increased prevalence is associated when there is a greater proportion of females under the length of first sexual maturity present in the reproduction period (Torres-Villegas et al., 2007). In some species of Sebastes, young females may abort
25
maturation, characterized by the formation of developing oocyst atresia masses (Hannah, 2014). Meanwhile, condition status and energy supply are important factors that regulate fecundity, and it is likely that together they determine the annual fecundity (Rijinsdorp, 1990). In the Atlantic sardine Clupea harengus, the development of the oocytes is influenced by the somatic energy content and during a cycle of oocyte maturation the fecundity decreases due the impact of atresia drived by a poor nutritional condition of the female. (Kurita et al., 2003)
1.6 Parasites affect reproduction
Fish serve as hosts to a range of parasites that are taxonomically diverse and that exhibit a wide variety of life cycle strategies (Wootton, 1990).Many fish parasites are associated with a reduction in host reproductive effort, and they appear to achieve this either through the energetic demand they place on their host, the release of hormone analogues that block sexual maturation (Barber et al 2000) and mechanic castration (Chávez and Oliva, 2011). Parasitism may affect life history traits such as condition, reproduction (parasitic castration) and mortality, although the research in this field is rather scarce (Ferrer-Maza et al., 2014). For European hake Merluccius merluccius the effect of metazoan parasitism in reproductive capacity (fecundity, egg quality and atresia) was study, but result showed that metazoan parasites not causing severe impairment to physical condition or reproductive capacity for M. merluccius females (Ferrer-Maza et al., 2014). Parasites can affect fish reproduction
either directly or indirectly, depending on the target organ. Protozoans parasites can show evasion strategies of the host immune response and cause changes in the reproductive process (Sitja-Bobadilla, 2009). Members of the phylum Aplicomplexa, mainly Family Eimeriidae are among the most important pathogen parasites in vertebrates and invertebrates, with economic implications (Silva et al., 2019). In Strombus gigas (Mollusca
26
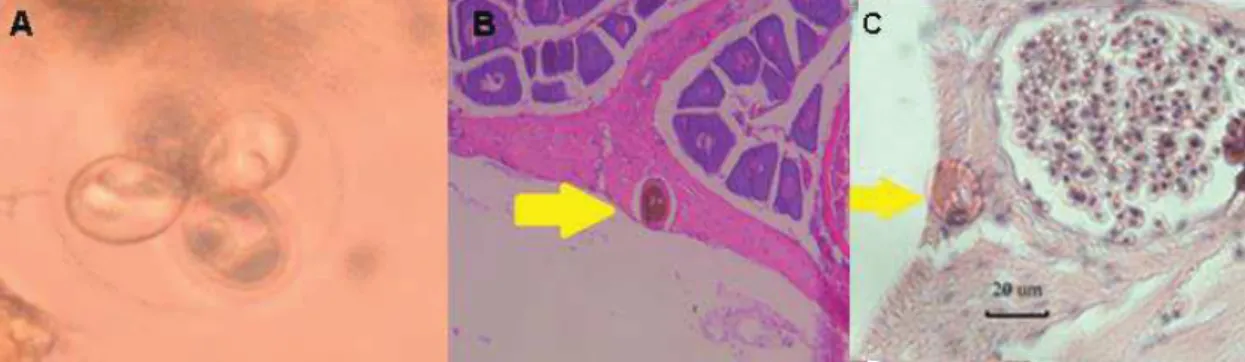
- Gastropoda), the increased number of parasites, induced an attenuated reproduction (Banqueiro et al., 2012. Coccidian of the genus Goussia infect several organs (liver, stomach, intestine) (Figure 10), and the impact in the body condition of a wide range of fish species are well known (Abollo, et al., 2001). Gene expression of parasites and host will allow us to understand the effect of the parasite on the host, but also the tradeoff between parasite infection and host response.
Figure 10. Oocyst and sporocysts of coccidian Goussia cruciata: fresh mature oocyst in liver (A), fibrous capsule of connective tissue surrounding oocysts in ovary (arrow) (B) and free oocyst in stroma of ovary (arrow) (C) of T. murphyi (Photo: P G-K)
1.7 Molecular approach to study of atresia
The study of molecular mechanisms involved in atresia has begun to be studied from a perspective that allows to determine genes regulating this process (Nicol et al., 2013, Miranda et al., 2013). Studies in transcriptomics have provided valuable information about the molecular events that lead to ovulation (Babin et al., 2007; Tingaud-Sequeira et al., 2009, Martyniuk et al., 2013), and for many species the transcriptional response can be associated with physiological changes and morphological events that are occurring in the ovary (Gardner et al 2012, Martyniuk et al., 2013).
Ovaries can provide transcriptomic specific maturation profile in mature individuals, which can be associated with specific biological processes for each stage of oocyte development, which would allow understanding the dynamics of the process of atresia in natural populations (Villeneuve et al., 2010; Lubzens et al., 2010; Martyniuk et al., 2013).
27
For some species (The Atlantic bluefin Thunnus thynnus, sole Solea senegalensis, Japanese medaka Oryzias latipes and black bass Micropterus salmoides) it has been determined candidate genes that would have a putative role in the process of atresia. Of the described, the Fst gene encoding the protein follistatin (FST) is probably a marker of ovarian age (Herpin et al., 2013), genes associated with lipid trafficking, such as the genes of the FABP superfamily (Fabp1, Fabp4 and Fabp11) (Agulleiro et al., 2007, Gardner et al., 2012). For Micropterus salmoides expression profiles for atresia are quite different to other oocyte
development stages, being genes related to oxidative metabolism higher in atretic but lower the genes that participate in gap junction pathways of the cytoskeleton, among others (Martyniuk et al., 2013).
Figure 11. Schematic representation of the environmental influences on the regulation of fish brain–pituitary–gonad axis. Photoperiod information is decoded by different hormonal pathways at brain level and together with other external factors (social interactions, lunar phase, food availability) and endogenous rhythms affect the reproductive functions. (Source: Miranda et al., 2013)
Because atresia can occur at any stage of oocyte development and could be influenced by environmental factors (Figure 11), such as temperature or by the physiological status of
28
females (Martyniuk et al., 2013); study which genes expressed in an atretic ovary versus non-atretic ovary could account for the existence of a primary endogenous component (physiological) or a secondary exogenous (temperature) that may explain the prevalence and intensity of atresia observed in the species under study, and determine its importance for the stock reproductive potential.
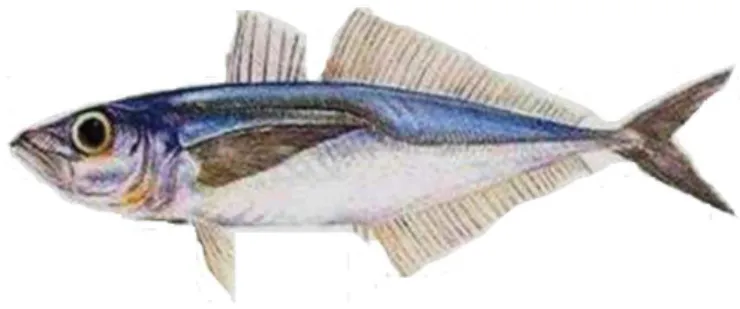
Figure 12. Chilean jack mackerel, Trachurus murphyi Nichols 1920
1.8 Biological Model: Chilean Jack mackerel, Trachurus murphyi Nichols 1920
The pelagic Chilean jack mackerel Trachurus murphyi Nichols1920 (Figure 12) is one the most important fishing resource in the South-eastern Pacific Ocean. Due at the overexploitation favoured by the oversizing of all the industrial fleet, they ended up triggering the biggest fishing crisis of the decade for this fishing resource. For population of T. murphyi in Chile, the reduction was 44% of the biomasa, landing of ca. 4.600.000 tons by 1996 drop dramatically to less than 300.00 tons by 2017 (Figure 13); generating critical changes in the age structure of the populations and all sustainability of the fishery of this resource (Figures 13) (Arcos et al., 2004; SPRFMO 2018).
29
Figure 13. SSB spawning biomass (t), average fishing mortality, recruitments at age 1 (millions) and catches (thousands t). The blue lines represent the annual references of the RMS. (Source: SPRFMO 2018)
The distribution of the Chilean jack mackerel covers from the Galapagos Islands to southern Chile, both in oceanic and coastal waters (Serra, 1991). In international waters it is distributed in large schools up to 160 ° W, and mainly between 33 ° S and 48 ° S (Grechina, 1992). Due to a recent colonization process, it has reached New Zealand and Australia (Grechina, 1998; Cárdenas et al., 2009). Studies using mitochondrial DNA and microsatellites indicate a panmictic population in the Pacific Ocean (Poulin et al., 2004; Cárdenas et al., 2009). Ahsford et al. (2011) compared the chemistry of the nucleus of the otoliths in individuals from different areas of distribution (from northern Perú to southern
30
Chile as well as New Zealand), main conclusion was that the Pacific Ocean Chilean jack mackerel comes from the same spawning area, which would be located off central Chile. The spatial distribution of T. murphyi consists of three main habitats: 1) a breeding area located off the coast of southern Peru and northern Chile, 2) a feeding area located off the south-central part of Chile 3) an oceanic spawning area in front of central Chile, which has an extension of 1800 km during spring (Figure 15) (Arcos et al., 2001; Cubillos et al., 2008; Vásquez et al., 2013).
Figure 14. Conceptual spatial model of the jack mackerel population in the southeastern Pacific Ocean (Source: Vasquez et al., 2013)
T. murphyi is a partial, asynchronous spawning that migrates for reproductive purposes off
the coast of Chile during spring (Leal et al., 2013). The main spawning area occurs between 80º and 92ºW with a maximum at 35ºS associated with a sea surface temperature (SST)
31
ranging from to of 15-16ºC but can reach 19ºC in some years (Cubillos et al., 2008). Also, T. murphyi is considered an indeterminate spawner, then egg production is not fixed at the
beginning of the spawning season, and in a similar way that other indeterminate species; continuous recruitment of new batches of mature oocytes can be spawned repeatedly during the reproductively active period (Murua and Saborido-Rey, 2003). During the spawning season, that can last for five months, females of T. murphyi can spawn every 3 to 5 days. The almost constant eggs production during an extended period requires a considerable amount of energy resources that can be obtained (1) from energy reserves accumulated prior to spawning, (2) directly from food input during the spawning season, or (3) from both sources (Hunter and Leong, 1981). Species highly migratory like T. murphyi, are exposed to several variables (environmental and physiology) that can produce that females delay or fail the reproduction. During non-adequate conditions (environmental and/or physiological) egg production can decrease or fail via atresia. Atresia might be considered an important mechanism for the adjustment of fecundity through the resorption of oocytes (Abaunza et al., 2003).
In this specie, despite their economic importance, reproductive biology is not fully understood but some recent studies have contributed to characterize the reproductive cycle (Leal et al., 2013; Perea et al., 2013). Most of the reproductive background regarding the impact of oceanographic conditions in the oceanic spawning habitat off central Chile has been described (Cubillos et al., 2008) with emphasis in the spatial distribution of egg and larvae (Cubillos et al., 2008; Vásquez et al., 2013).Description of follicular atresia and its interannual variations and potential relationshps with reproductive variables (e.g. fecundity) it has not been evaluated for this species. Similarly, the new molecular approaches to the study of reproductive biology in fish, as transcriptional studies, have not been performed in this species either.
32 2. CONTEXT OF THE THESIS
In mature females, atresia can occur at any time during the reproductive cycle. Sometime, females delay its reproduction, inclusive for one year, increasing the prevalence and intensity of atretic oocytes. In highly migratory species, such as T. murphyi, it is expected that during the spawning period, some females will have atretic oocytes due to potential energy loss during annual migration. As atresia can have strong consequences in recruitment, the knowledge of the spatio-temporal dynamics of this process is important to assign the status of female in the spawning stock during spawning season. Atresia can have direct effect on the number of eggs that females can produce. Like other reproductive traits, atresia depends on the female's physiological conditions (e.g. age, length, condition) and environmental factors (e.g. temperature). In the context of climate change, environmental variables such as temperature, can act directly or indirectly at all levels of the reproductive axis (brain-pituitary gland, liver, gonads), allowing regulation of different metabolic pathways that may affect reproductive processes.
Transcriptomic studies provide valuable information about the molecular events that lead to ovulation and atresia. Studies of gene expression in teleost fishes with different breeding strategies have been performed. Due that the transcriptional response may be associated with a physiological and morphological change in the ovary, understanding the cellular and molecular mechanisms involved in the process of atresia, is critical to understand the reproductive dynamics of this important economic species.
33 3. HYPOTHESIS
3.1 Hypothesis
- Due the extended distribution of the spawning area of T. murphyi, Prevalence and intensity of atresia in Trachurus murphyi is expected to show spatial and temporal variability correlated with length, gonadosomatic index and condition factor. Alternatively, variations in atresia will be correlated with extrinsic factors (sea surface temperature, year).
-Species highly migratory like Trachurus murphyi, are exposed to several variables (environmental and physiology) that can produce that females delay or fail the reproduction, then is expected a differential transcriptomic expression between females showing atresia and not atresia.
- The presence of parasites can be generated change in phisiologycal responce in host, including reproductive process, then is expected that females showing protozoan parasites Goussia cruciata will have more atretic oocytes than females without this parasite.
34 4.- OBJETIVES
- Describe and evaluate reproductive atresia processes and establish temporal reproductive variation in the potential spawning area.
- Determine whether the prevalence and/or intensity of atresia are related to endogenous variables (fork length, gonadosomatic index, condition factor) or environmental variables (sea sufarce temperature)
- Identified through a bibliographic review the potential molecular markers associated with the atresia processes in teleost fishes.
- Identified the transcriptome expression of genes associated a female that showed atresia and not atresia, that could be used as predictor to atresia in this species.
- Determine the potential effect of Goussia cruciata (Apicomplexa) in some biological traits (e.g. atresia) of this species.
35 5. RESULT
CHAPTER 1
Paola González-Kother, Marcelo E. Oliva, Arnaud Tanguy & Dario Moraga. 2019. A review of the Potential Genes Implicated in Follicular Atresia in Teleost Fish. Marine Genomic. https://doi.org/10.1016/j.margen.2019.100704
CHAPTER 2
Atresia in the Chilean jack mackerel Trachurus murphyi(Teleostei, Carangidae): A first assessment for the South-eastern Pacific Ocean.
Paola González-Kother, M Teresa González and Marcelo E. Oliva Submitted to: Revista Biología Marina y Oceanografía
CHAPTER 3 First transcriptomic approach to the study of atresia in Trachurus murphyi
using RNA-Seq analysis: FABPs Family gene role in Atresia.
Paola González-Kother, Marcelo E. Oliva, Arnaud Tanguy & Dario Moraga To be submitted to Marine Genomic
CHAPTER 4
González-Kother, P & M.T. González. 2014. The first report of liver coccidian Goussia cruciata in jack mackerel Trachurus murphyi from the South Pacific and its relationship
36 CHAPTER 1
44 4.2 CHAPTER 2
Atresia in the Chilean jack mackerel Trachurus murphyi(Teleostei, Carangidae): A first assessment for the South-eastern Pacific Ocean
Paola González-Kother1,2*, M Teresa González3 and Marcelo E. Oliva3,4
1Programa de Doctorado en Ciencias Aplicadas mención Sistemas Marinos Costeros. Universidad de Antofagasta. P.O. Box 170, Antofagasta, Chile
2Facultad de Ciencias, Universidad Católica de la Santísima Concepción, Alonso de Ribera 2850, P.O. Box 297, Concepción, Chile
3Instituto de Ciencias Naturales “Alexander von Humboldt”, Facultad de Ciencias del Mar y Recursos Biológicos, Universidad de Antofagasta. P. O. Box 170, Antofagasta, Chile 4Instituto Milenio de Oceanografía, Universidad de Concepción, P.O. Box 160-C, Concepción, Chile
*Autor corresponsal: [email protected]
Abstract
The Chilean jack mackerel Trachurus murphyi support an important fishery in the South-eastern Pacific Ocean and has declined considerably over time. T. murphyi have asynchronous ovarian development with an oceanic spawning (September to January). Despite the economic importance of this resource critical issue such as characteristics and dynamics of atresia, which affect the reproductive output, are unknown. Females of T. murphyi caught in different spawning years were analysed to describe patterns of prevalence
and intensity of atresia. General linear models (GLM) were performed by using prevalence and intensity atresia, as response variables and gonadosomatic index, condition factor, sea
45
surface temperature, postovulatory follicles and month/year as explanatory variables. The batch fecundity and relative fecundity were compared between females showing atresia, postovulatory follicles and non-atretic females. The stages of atresia identified were alpha, beta and gamma. Primary growth and cortical alveolar oocytes atretic were also recorded. The GLM showed that variations in the prevalence and intensity of atresia were explained for all variables, except condition factor for prevalence, while month/year, sea surface temperature, condition factor and incidence of postovulatory follicles were significant variables explaining intensity of atresia. According to our results, the dynamic of alpha and beta-atresia could be considered a potential proxy for any disruption of spawning season. The batch fecundity and relative fecundity were lowest compared with other Trachurus spp. This is the first assessment comparing fecundity between atretic and not atretic females for this species.
Key words: Atresia, condition factor, fecundity, spawning season, Trachurus
Introduction
In the South-eastern Pacific Ocean (SEP), industrial fisheries for the highly migratory Chilean jack mackerel Trachurus murphyi Nichols, 1920, have decreased considerably from 4.4x10⁶ ton during the mid-1990s to 355x103 ton in 2017 for Chile (SERNAPESCA 2017). The main fishery includes the coast off Peru and Chile, extending from the central coast of Chile to the South-west Pacific Ocean, but a recent colonization process reaching the coast around New Zealand and Tasmania has been described (Serra 1991, Cárdenas et al. 2009, Vásquez et al. 2013).
In the SEP, Chilean jack mackerel conform a single large population (Poulin et al. 2004, Cárdenas et al. 2009) that can be found in three different habitats (Arcos et al., 2001)
46
according to its life history: a) nursery ground area, b) coastal feeding area and c) a large, main oceanic spawning area off central Chile (Bertrand et al. 2004, Cubillos et al. 2008, Vásquez et al. 2013). Interestingly, otolith chemistry indicates that all adult Chilean jack mackerel come from the same oceanic spawning area (Ashford et al. 2011). Recently, Parada et al. (2017) indicated the presence of a potential new spawning and nursery ground area associated with the seamount region in the Challenger break and the East Pacific ridge
(32°S-39°S and 105°W-126°W).
Chilean jack mackerel can spawn throughout their whole distribution (Taylor 2002, Gerlotto et al. 2012), and the time extension of the spawning period varied between area and years
(Perea et al. 2013). For the main oceanic spawning area from central coast of Chile (32ºS-38°S, 80ºW-92°W) the spawning period extends from September to January when mature fish begin the annual migration from the feeding area to the oceanic spawning area; that extends more than 1800 km off the coast (Cubillos et al. 2008, Leal et al. 2013).
Like other Trachurus species, T. murphyi present asynchronous ovarian development (Leal et al. 2013); and an indeterminate fecundity considering the size distribution of oocytes, and
a long spawning period as well as incidence total of atresia (George 1995). T. murphyi is a
batch spawner and fecundity estimates should be made using the most advances development oocytes (hydrated oocytes) instead the vitellogenic oocytes (Saborido-Rey & Kjesbu 2005). Atresia is a normal process of oocyte renewal, which increases at the cessation of spawning when all remaining vitellogenic oocytes are resorbed (Saborido-Rey & Kjesbu 2005). As suggested by Ganias et al. (2008) the main reason for assessing/quantifying atresia is assign females to their correct reproductive class; especially in fishes with determinate fecundity, because the realised annual fecundity must be corrected for atretic losses, but not for fishes with indeterminate fecundity which showed a
47
spawning season (West 1990). For T. murphyi, is not easy to find females harbouring hydrated oocytes during the spawning season (George 1995, Leal et al. 2013), consequently vitellogenic oocytes could be counted, and atresia must be quantified (Saborido-Rey & Kjesbu 2005). Therefore, the main goals were (1) to describe the phases of atresia in T. murphyi caught during the post-migration spawning period in order to evaluate the
spawning history, (2) to determine the prevalence and intensity of atresia in different spawning periods and (3) to determine the impact of atresia in the fecundity.
Materials and methods
Mature females (n= 3650) of Chilean jack mackerel were sampled from seven cruises using industrial fishing vessels, during the main oceanic spawning area off central Chile (30ºS-39ºS; 71°W-88°W). Such trawls are designed to evaluate the spawning biomass based on the Daily Egg Production Methods (Hunter & Lo 1997). Our samples included only specific months within the annual spawning cycle during different years, focusing in the period of higher spawning intensity (Table 1).Females were selected at random from the catches and dissected on board, following the methodology described by Sepúlveda et al. (2009). Fork length (FL, cm) and body weight (BW, g) were measured, the significance of potential differences in these variables between spawning periods was analysed using Kruskal–Wallis test. Differences between immature and mature females for FL and BW were analysed using Mann-Whitney test. The sea surface temperature (SST) data was provided by Instituto de Investigación Pesquera (INPESCA, Chile
Gonadosomatic index (GSI) and condition factor (K) were recorded for each specimen. GSI was calculated as GSI= (GW/BW) × 100; where GW is gonad weight (g). K was estimated as K = (BW/FL3) x 100. The mean values of GSI and K, obtained for the different maturity stages during each sampled period, were compared using the Kruskal-Wallis tests. Potential
48
relationships between GSI and K for the total samples were analysed with Spearman’s correlation coefficient.
For histological analysis, the ovaries were fixed in 10% neutral buffered formaldehyde; a cross-section of tissue was sampled from the middle parts of the ovary. Each sample was embedded in paraffin, sectioned transversely with a thickness of 5 μm and stained with haematoxylin and eosin. The most advanced batch of oocytes and the reproductive phases of ovaries were based on the developmental stage of the oocytes and the presence of postovulatory follicles (POF) and atresia. We followed the methodology suggested by Brown-Peterson et al. (2011) and applied for Leal et al. (2013) to describe and characterize the reproductive maturity phases for this species. The prevalence of atresia (PA) was defined as the number of fish containing ovaries with at least one phase of atretic oocytes relative to the number of all individuals examined, expressed as a percentage (Ganias et al. 2008).
The presence/absence of atresia was modelled using a generalized linear model (GLM) with
a binomial error distribution for the response variable and a logit link function (Ganias et al. 2008). Prior to selection of variables to be included in the GLM for presence/absence of
atresia, Spearman’s correlations were performed to detect collinearity between the
quantitative variables (FL, K, GSI and SST). The explored explanatory variables were FL,
K, GSI, POF, SST and month/year (MY). Three models were performed. The first model
included as response variable all atresia phases identified (alpha, beta, gamma and cortical alveolar atresia) and their combinations, the second model included only A-atresia, and the third model included only B-atresia. The selection of the best models was checked with
Akaike’s Information Criterion (AIC) and Deviance (D2). Additionally, the Receiver
Operating Characteristic (ROC) curve was used to evaluate the sensitivity and specificity
49
For females with alpha-atresia, the intensity of atresia (IA) was calculated as the number of alpha-atretic oocytes divided by the total number of vitellogenic oocytes (alpha-atresia + non-atretic follicles) following Nunes et al. (2011). Simple counting from histological sections was used as a proxy of intensity of atresia (Ganias et al. 2008, Nunes et al. 2011). The IA was evaluated using a generalized linear model (GLM) with a normal distribution for the response variable and a log link function. The explanatory variables included in the model were FL, K, SST and MY.
Batch fecundity (BF) was estimated via gravimetric methods on hydrated females for three female stages in relation to non-atretic oocytes (n= 71), atretic oocytes (n= 41) and presence of POF (n= 66). These females were caught during the spawning period S6 (November and December to 2014). Relative batch fecundity (RF), defined as the number of hydrated oocytes per gram of body weight, was determined by dividing BF by body weight. Significance differences in BF and RF amongst three female stages were evaluated using Kruskal-Wallis tests and the Dunn “a posteriori test”. In this case, effects on the explicatory variables FL, K and female stages for BF and RF were tested with a generalized linear model (GLM) with a Poisson distribution for the response variable and a log link function. GLM analysis and ROC curve were performed in R Software (R Core Team 2006)
Results
Reproduction and condition
Fork length (FL) for the whole sample ranged from 23 cm to 64 cm (mean 34.1 cm ± 5.2), while the body weight (BW) ranged from 115 g to 3090 g (mean 481 ± 234). Significant differences were found for FL (H= 946.63, P < 0.001) and BW (H= 1156.76, P < 0.001) between month/year, with the females caught in January 2013 being the smallest ones
50
(Table 1). Also, immature females (n= 43) showed differences from matures females (n= 3607) for FL (U= 15288.5, P < 0.0001) and BW (U= 18830, P < 0.0001).
Immature females and developing females were observed at low frequency during several seasons spawning (Fig. 1). Conversely, potentially spawning capable females (range: 2%-81%) and actively spawning females (range: 8-18%) were recorded in all samples except January 2013, increasing the proportion of regressing (61%) and regenerating (17%) females (Fig. 1). The absence of females in the actively spawning reproductive phase and the high frequency of advanced maturity phases (regressing and regenerating) indicated that the long spawning period ended by January.
The GSI showed significant differences between the reproductive maturity phases (H= 1414.91, P < 0.05); high values (GSI > 5) were observed in females showing the actively spawning phase. Immature females (n= 43) showed the lowest GSI values (GSI < 1.0) when compared with regressing and regenerating females (Fig. 2).
K ranged from 0.43 to 1.92 (mean 1.12 ± 0.13), but three females showed K > 2.0 (data not
included) in all spawning periods analysed (Fig. 2), Additionally, K varied between the reproductive phases (H= 47.97, P < 0.05), although K for immature females did not show differences from mature females (U= 72788.5, P = 0.48). Considering the whole sample, GSI was negative (but marginally) correlated with K (ρ = -0.053, P < 0.001).
Atresia morphology
Three main sequential stages of atresia were observed: Alpha (A), Beta (B) and Gamma (G) (Fig. 3). Several ovaries were characterized by the presence of primary growth (PG) and Cortical Alveolar (CA) atretic oocytes. For A-atresia three morphological stages were identified: initial (A1), intermediate (A2) and advanced (A3) (Fig. 3b, c, d). During A-atresia, follicular diameter diminished gradually. The first signal for A1 atresia was an internal, non-smooth zona radiata, which subsequently showed a small fragmentation