Development of a "Genome-Proxy" Microarray for Profiling Marine Microbial Communities, and its Application to a Time Series in Monterey
Bay, California.
By Virginia Rich
B.A, University of California at Berkeley, 1998
Submitted in partial fulfillment of the requirements for the degree of Doctor of Philosophy
at the
MASSACHUSETTS INSTITUTE OF TECHNOLOGY and the
WOODS HOLE OCEANOGRAPHIC INSTITUTION September 2008
© Virginia Rich, All rights reserved.
The author hereby grants to MIT permission to reproduce and to distribute publicly paper and electronic copies of this thesis document
in whole or in part in any medium now known or hereafter created.
Signature of the Author
Joint Program in Biological Oceanography Massachusetts Institute of Technology Woods Hole Oceanographic Institution August 1st, 2008 Certified by
Thesis Co-Supervisor Edward F. DeLong Massachusetts Institute of Technology Certified by Thesis Co-Supervisor George Somero Stanford University Accepted by Edward F. DeLong Chair, Joint Committee for Biological Oceanography Woods Hole Oceanographic Institution
Development of a "Genome-Proxy" Microarray for Profiling Marine Microbial Communities, and its Application to a Time Series in Monterey
Bay, California.
by Virginia Rich
Submitted to the Department of Biology and to the Woods Hole Oceanographic Institution in summer 2008, in partial fulfillment of the requirements for the degree
of Doctor of Philosophy in Biological Oceanography. ABSTRACT
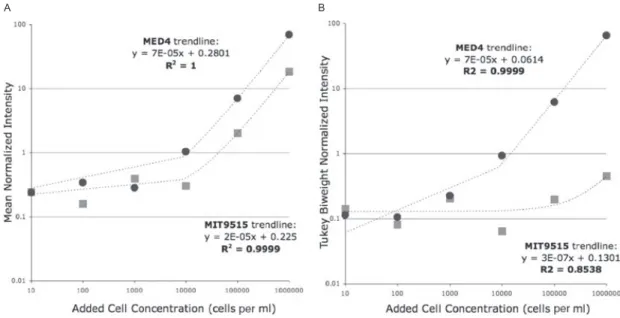
This thesis describes the development and application of a new tool for profiling marine microbial communities. Chapter 1 places the tool in the context of the range of methods used currently. Chapter 2 describes the development and validation of the “genome proxy” microarray, which targeted marine microbial genomes and genome fragments using sets of 70-mer oligonucleotide probes. In a natural community background, array signal was highly linearly correlated to target cell abundance (R2 of 1.0), with a dynamic range from 102-106 cells/ml. Genotypes with ≥~80% average nucleotide identity to those targeted cross-hybridized to target probesets but produced distinct, diagnostic patterns of
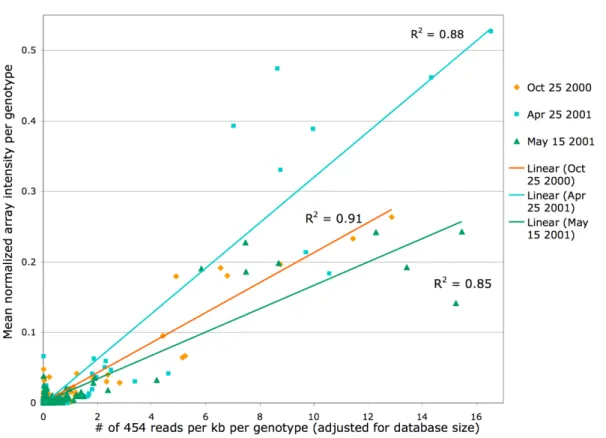
hybridization. Chapter 3 describes the development an expanded array, targeting 268 microbial genotypes, and its use in profiling 57 samples from Monterey Bay. Comparison of array and pyrosequence data for three samples showed a strong linear correlation between target abundance using the two methods (R2 =0.85-0.91). Array profiles clustered into shallow versus deep, and the majority of
targets showed depth-specific distributions consistent with previous observations. Although no correlation was observed to oceanographic season, bloom
signatures were evident. Array-based insights into population structure suggested the existence of ecotypes among uncultured clades. Chapter 4 summarizes the work and discusses future directions.
Thesis Co-supervisors: Edward DeLong and George Somero
Titles: Professor of Civil and Environmental Engineering, at MIT, and David & Lucile Packard Professor in Marine Sciences, at Stanford University.
Acknowledgments
This work was supported by a National Science Foundation (NSF) Microbial Observatories Award (MCB-0348001, to E.F.D.), a grant from the Gordon and Betty Moore Foundation (to E.F.D.), a grant from the David and Lucille Packard
Foundation (to E.F.D.), and NSF Science and Technology Center Award
EF0424599 (to E.F.D.).
I also gratefully acknowledge the scientific influence and the mentoring of several people who have been significant to this completion of work. First, I deeply
appreciate the scientific expertise that my co-authors, Konstantinos
Konstantinidis, Yanmei Shi, Vinh Pham, John Eppley, and my supervisor Ed DeLong, have added to sections of this work. Also, Matthew Sullivan and Vivienne Rich have each provided critical sounding boards for the clear
communication of this material, as well as the non-scientific support required to bring this thesis to completion. In addition, I thank my families for their
encouragement and patience through this process: my father John Rich, my mother Vivienne Rich, my brothers Alaric and Maxwell Brown, Matt’s parents Terry and Mary Sullivan, and his brother and sister-in-law Jeff Sullivan and Rupa Patel. During my time at MIT, extensive professional interactions with Associate Dean of Graduate Students Blanche Staton have been a great source of
instruction and mentorship. In both California, where this thesis began, and in Cambridge where it was completed, I have been blessed with extraordinary friends, whose camaraderie, scientific discussion, and good humor have
profoundly enriched the 5.5 years I have spent completing this thesis. In addition, this work would not have been possible without the assistance of MIT Mental Health, in particular Audra Bartz and Jack Lloyd. Lastly, the community in the Parsons Lab (Bldg. 48 at MIT) is a warm and welcoming campus home, and I appreciate the many people who make it such an unusual and special place.
Table of Contents
Section Pages
Abstract 3
Acknowledgments 5
Chapter 1: Community Profiling Methods in Microbial Ecology 9 – 40 Chapter 2: Development and Validation of a Prototype
Genome Proxy Array
2a. The case for the genome proxy array: motivation and
context 41 – 51
2b. Rich, V.I., K. Konstantinidis and E.F. DeLong. 2008. Design and testing of ‘genome-proxy’ arrays for profiling marine microbial communities. Environmental Microbiology. 10(2):506-521. Also, Rich, Konstantinidis and DeLong,
Supplementary Materials 53 – 73
Chapter 3: Application of an Expanded Genome Proxy Array to Monterey Bay
Rich, V.I., J. Eppley, Y. Shi, V. Pham, and E.F. DeLong. Manuscript in preparation. Time-series investigation of a coastal microbial community in Monterey Bay, CA, using the
“genome proxy” microarray 75 – 141
Chapter 4: Conclusions and Future Directions 143 – 154
Bibliography 155 – 181
Appendix 1. Protocols & Source Sheets Developed for the
Genome Proxy Array 183 – 223
Appendix 2. A Primer on Microarray Design 225 – 234
Appendix 3. Horz, H.P., V. Rich, S. Avrahami, and B.J. Bohannan. 2005. Methane-oxidizing bacteria in a California upland grassland soil: diversity and response to simulated global change. Applied and Environmental Microbiology.
71(5): 2642-52. 234 – 246
Appendix 4: DeLong, E.F., C.M. Preston, T. Mincer, V. Rich, S.J. Hallam, N.-U. Frigaard, A. Martinez, M.B. Sullivan, R. Edwards, B.R. Brito, S.W. Chisholm, and D.M. Karl. 2006. Community genomics among stratified microbial
assemblages in the ocean's interior. Science. 311(5760):
Chapter 1
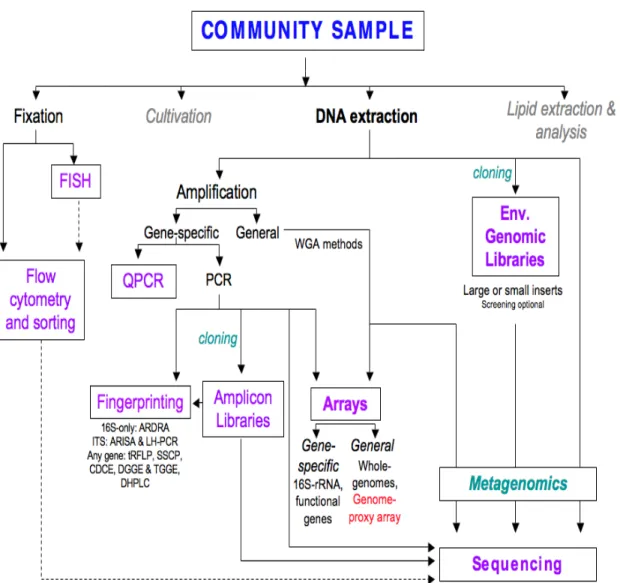
Microorganisms drive global biogeochemical cycles, and are major numerical and biomass components of every habitat on the planet. Microbial ecology seeks to understand the relationships between microbial communities and their surrounding environment. However, these communities are complex, microscopic, and difficult to observe, and it remains an ongoing methodological and conceptual challenge to track individual taxa within communities and to profile communities as a whole. A range of methods are available for microbial community profiling, spanning differing degrees of phylogenetic resolution, specificity, sensitivity, ease of use, cost of adoption, and cost per sample. In this chapter, I present an overview of the major profiling methods (Figure 1), to place the new profiling tool developed and used in this thesis into context. This review does not address methods for functionally profiling communities or linking
specific taxa to ecosystem functions, but rather focuses solely on methods used to assess community composition. These methods address questions about who is there, rather than what they are doing.
For the purposes of this review, it will be assumed that the microbial community sample has been prepared or obtained in a way that primarily
captures the microbial component of the biota (since the larger cells can swamp or obscure the microbial signal, for many of the methods discussed here). For example, marine samples are often first passed through a 1.6-2.7 µm nominal pore-size pre-filter to remove larger eukaryotic cells (along with particle-attached or larger microbes) and then collected onto a 0.2um filter, allowing non-particle-associated viruses to pass through. Soil or sediment samples can be sieved to remove roots or invertebrates, while symbiont communities are dissected away from host tissues. Based on the habitat and conditions of the sample, the chemical details of subsequent treatments are then tailored to optimize efficiency, e.g. of DNA extraction.
strategies for profiling the community composition of the sample: 1. Chemical fixation and whole-cell characterization: Cells remain essentially intact. Fixation strategies vary based on the cell types and
background particles involved. Once a sample is chemically fixed, community members can be analyzed as whole cells based upon their light scattering and autofluorescent emission properties. Fixation can be followed by fluorescence in situ hybridization (FISH), flow cytometry (FCM), and/or fluorescence-activated cell sorting (FACS). These methods provide the most direct observations of organisms, and will be discussed further below, but can rarely discriminate beyond a handful of members or cell-types within complex microbial
assemblages.
2. Lipid Extraction: A sample’s lipids are extracted, subjected to specific chemical manipulation, and structurally profiled using high-pressure liquid chromatography (HPLC), mass spectroscopy (MS), and/or other methods. Lipid profiling has been a central tool in paleomicrobiology and in associated
paleoclimate studies (e.g. reviewed in Summons et al., 1996), for extinct communities in which there are no longer intact cells, and whose DNA may be absent or excessively degraded. In these cases, lipid composition is used to make inferences about phylotype presence. It has also been used to generate overall profiles for extant communities, (e.g. Vestal and White, 1989, Summons et al., 1996, Schutter and Dick, 2000, Ritchie et al., 2000, Hinojosa et al., 2005, Moore-Kucera and Dick, 2008, Jiménez Esquilín et al., 2008), and to examine particular groups with characteristic lipids (e.g. annamox bacteria, Schmid et al., 2005, archaea, Biddle et al., 2006, Ingalls et al., 2006, Thiel et al., 2007)
However, because of ambiguities in the robust assignment of particular lipid types to specific clades (e.g. Rashby et al., 2007), and because cellular lipid content and composition can alter, like ribosome content, depending on cellular physiology (Vestal and White, 1989, Villanueva et al., 2004), it is not especially common as a profiling technique for extant communities, although lipid profiling
combined with isotope characterization is used to infer links between identity and particular metabolisms (e.g. Ingalls et al., 2006). Therefore it will not be further discussed in this review.
3. Cultivation. Cultivation typically allows the characterization of <1% of microbial taxa, particularly in oligotrophic environments (e.g. Staley and
Konopka, 1985), and cultivars are often rare phylotypes with physiologies quite different from those characteristic of the community (the standard culturing
process often selects for eutrophic clades). However, some clades are amenable to cultivation and their presence and diversity in a sample can thus be partially profiled by cultivation (e.g. marine Vibrio spp., Thompson et al., 2005). In addition, recent improvements in culturing, using conditions closer to those in situ, have led to a greater diversity of organisms becoming isolated or enriched (e.g. Connon and Giovannoni, 2002, Rappé et al, 2002, Cho and Giovannoni, 2004, Stingl et al., 2008). However, cultivation alone has yet to effectively capture the complexity of a microbial community and even in the face of high-throughput optimizations remains a significant time commitment. Thus, while cultivation is critical for model-systems-based study of particular community members, it has limited use as a community profiling tool. Even for cultivation-amenable clades, cultured representatives rarely reflect in situ relative
abundances, and thus further community characterization studies are required to accurately profile the original sample (Thompson et al., 2005). For these
reasons, cultivation will not be further described here (but see recent review by Giovannoni and Stingl, 2007).
4. Nucleic acid Extraction and characterization. The genetic code of a mixture of organisms, if it can be uniformly accessed1, is a powerful means to
1 Optimization of DNA extraction protocols to the particular community examined is critical.
Particle association, sample chemistry (e.g. humic substances in soils, waxes in some plants, excessive mucus in marine invertebrate-associated communities), and cell surface properties (e.g., cell wall composition, spore coats) affect extraction efficiency may bias community
survey a complex microbial community. Community DNA or rRNA extracted from a sample may require amplification before further analysis. Gene-specific
amplification allows profiling of microbial diversity via a phylogenetically
informative gene of interest, often the 16S rRNA gene or molecule. Amplification might be done quantitatively (e.g., quantitative PCR or RT-PCR) to assess relative abundances or non-quantitatively to generate sufficient copies of the gene of interest for further profiling analyses. In this latter case, amplified genes may be “fingerprinted” by methods ranging from terminal restriction fragment length polymorphism (tRFLP) to microarrays to sequencing. Alternatively, community profiling can occur without amplification by sampling the community genome directly through sequencing, either with or without cloning.
This range of commonly-used community profiling methods, from FISH through metagenomics (Figure 1), are described briefly in the context of profiling and compared below.
Fluorescence in situ Hybridization (FISH)
Fluorescence in situ hybridization (FISH) is widely used in microbial ecology (for a recent review, see Amann and Fuchs, 2008) and allows the enumeration and profiling of phylogenetic subsections of a community using fluorescence microcopy. Briefly, microbial cells from a natural community sample are chemically fixed and permeabilized, then hybridized to fluorescently-labeled oligonucleotide probes complementary to e.g. the 16S rRNA sequence of a clade of interest. Fluorescently labeled cells are then imaged and quantified using fluorescence microcopy (see e.g. Amann and Fuchs, 2008). Unlike the majority of community analysis techniques, FISH examines whole cells and thus provides additional community information about cellular morphology and spatial
structuring.
A functional physiological component can be added to FISH by combining it with other methods. MAR-FISH (aka Micro-FISH, STAR-FISH) combines FISH
with microautoradiography by incubating a sample with radiolabeled substrate diagnostic for a metabolic pathway or biogeochemical process (Lee et al., 1999). Further refinements include FISH-SIMS, which uses secondary-ion mass
spectroscopy to detect both stable and radioactive isotopes, to a spatial resolution of 10-15µm (Orphan et al., 2001). The resolution of such methods continues to improve, with FISH-NanoSIMS (50nm) allowing a new level of precision in hypothesis-testing (Lechene et al., 2007).
In spite of the considerable strengths of FISH-related profiling methods, there are limitations: (1) variable fixation / membrane permeabilization across cell types, (2) detection sensitivity in natural samples, (3) variable probe specificity and accessibility, (4) low sample throughput and (5) high background and sample autofluorescence. (For a good methodological review of FISH, see Bottari et al., 2006).
Fixation / permeabilization: Cell wall composition varies among microbes, and so fixation and permeabilization without lysis can be difficult to achieve across the range of cell types typically present in a community, and methods must be tailored to each investigation. Fixation and permeabilization is achieved with paraformaldehyde and ethanol, aided by enzymes (lysozymes and
proteases), solvents, acids, and detergents (Amann and Fuchs, 2008). Not only can the efficacy of these steps vary greatly among cells, and thus affect target accessibility, but the composition of co-purified elements of the community habitat can also affect the efficiency of probe binding as well as sensitivity (Amann and Fuchs, 2008).
Sensitivity: Several factors affect FISH sensitivity. First, FISH probes target ribosomal RNAs, which are an active component of the ribosome, the cell’s protein assembly machinery. The number of ribosomes in any given cell can vary significantly, from tens to tens of thousands of copies per cell. Small cells tend to have fewer ribosomes per cell (Kemp et al., 1993, Morris et al., 2002), and poor
growth conditions can result in decreased ribosomal content (Kemp et al., 1998). The ability to detect specific organisms is highly dependent on the ribosome copy number, and thus for some environmental applications targeting small and/or nutrient-deprived cells, sensitivity may be a challenge.
In addition, the probe and fluorophore selection can affect sensitivity. Not all dyes are equally bright (e.g., Alexa Fluor 555 outperforms Cy3), and probe
alterations can also help amplify signal. Multiple probes targeting the same taxon at different regions of its rRNA (e.g. for SAR11 - Morris et al., 2002), or multiply-labeling single probes (Pernthaler et al., 2002), can both be effective strategies. In the latter case, the accommodation of additional dye molecules requires more expensive polynucleotide probes instead of oligonucleotides, which consequently constrains target resolution to higher-level taxonomic levels (Amann and Fuchs, 2008). An additional option for increasing probe sensitivity is CARD (CAtalyzed Reporter Deposition) -FISH, which links the horseradish peroxidase (HP) enzyme to the oligo probe instead of a fluorophore. This enzyme then converts
fluorescently-labeled tyramide molecules in the reaction mixture into their fluorescently-active state, in which they also bind locally to the cell, allowing signal amplification up to 20 times the intensity seen with monolabel FISH probes (Schönhuber et al., 1997, Pernthaler et al., 2002). The enzyme molecule is 40-80 times larger than a fluorophore, however, and thus good entry of the HP-oligo conjugate into the cell can be challenging and requires good permeabilization (e.g. initial embedding of the cells in agarose followed by stronger chemical treatment than in standard permeabilization protocols). The bulkiness of the CARD-FISH probe is particularly problematic when evaluating
densely-associated cells (Schönhuber et al., 1997), and in these cases becomes less sensitive than classical FISH. However, in planktonic cells, the increased sensitivity of CARD-FISH has allowed the simultaneous labeling of both
ribosome and mRNA from particular genes of interest (Pernthaler and Amann, 2004). In this manner, one can simultaneously assay for “who is present” and
“are they active”, within a complex microbial community. As sensitivity increases, FISH has moved from detecting high-copy ribosomal RNAs to mRNAs, and has achieved hybridization and visualization to single-copy genes in the genome (RING-FISH, Zwirglmaier et al., 2004; RCA-assisted FISH, Smolina et al., 2007, Marayuma et al., 2005).
Lastly, rather than increasing the absolute signal, sensitivity can be
improved by reducing the noise and background fluorescence. Sample treatment plays an important role in this, since humics and other contaminants can
autofluoresce and/or interfere with probe binding. In addition, some probe structural design modifications can decrease background fluorescence caused by non-specific binding (e.g. “molecular beacon” probes, which improve signal-to-noise ratios and thus sensitivity, e.g. Lenaerts et al., 2007).
Specificity: As with other DNA-based hybridization methods, specificity is an important consideration in FISH. Recent general modifications to probe structure (e.g. peptide nucleic acid probes, described in Bottari et al., 2006, Amann and Fuchs, 2008) offer increased binding affinity and/or stability, which can increase specificity (and sensitivity). As with all nucleic-acid probes, FISH probe specificity relies on the size and quality of the reference database used to design them. Many commonly-used domain and group-specific probes were designed when the 16S databases were significantly smaller, and thus have an expanding false-negative and -positive rate (for an updated analysis of common FISH probes specificity see Amann and Fuchs, 2008). Ideally, probes should be re-evaluated before use using current databases and tools (e.g. probeBase, the online
database and toolkit for designing 16S-rRNA probes and primers, Loy et al., 2007). Probe design and optimization are not restricted to cultivated clades, since not only do many clades have sufficient database representation due to 16S environmental surveys, but such environmental sequences can be cloned and then used within their heterologous host for optimization of hybridization conditions (clone-FISH, Schramm et al., 2002). Finally, in order to add
confidence to the interpretation of FISH specificity, multiple hierarchic probes can be used simultaneously as internal cross-validation (Amann and Fuchs, 2008).
From a practical stand-point, as a community profiling method FISH is inexpensive once set up (i.e. requires a good fluorescence microscope but not exorbitant reagents), and is ideal for research questions that target a small number of monophyletic groups with good cell permeability, particularly where spatial structure and cell size observations are relevant. Sample preparation requires a moderate to advanced level of technical expertise in order to obtain good results (fixation, permeabilization and hybridization protocols all need to be tuned for different communities), and takes hours to days depending on the sample. Once methods are optimized, FISH’s limit of detection can reach ~0.1% of the community (Amann and Fuchs, 2008, Woebken et al., 2007). Although sample scanning and analysis are becoming more automated (Daims et al., 2006; Alonso and Pernthaler, 2005; Cottrell and Kirchman, 2003), FISH is not a high-throughput method. In summary, FISH is an important community profiling tool when examining division-level community structure (using previously
developed probes) or focusing in on a limited number of specific microbial groups (the number of different species simultaneously resolvable is currently around seven, Amann and Fuchs, 2008). However, given the complexity of natural microbial communities and time required for probe development, FISH is not meant to comprehensively profile more than a small fraction of the microbial community at a refined taxonomic scale. Profiling at higher taxonomic levels – e.g. the level of alpha-, beta-, or gamma- proteobacteria – can miss significant differences at lower taxonomic resolution. Also, the application of FISH cannot easily be standardized to a variety of samples, due to differences in fixation and hybridization.
Flow cytometry (FCM) and fluorescence-activated cell sorting (FACS) use optical properties of a sampled population to enumerate and/or separate different optical grouping of cells. Basic FCM relies solely upon the inherent properties of the cells themselves. For example, FCM “signatures” result from the combined effects of cell size, shape, and internal structure on light scatter, and of the characteristic autofluorescence of naturally-occurring cell pigments (e.g.,
chlorophyll or phycoerythrin). While FCM simply counts and records cells based on these properties, FACS uses the same properties to sort different populations of cells.
A major focus of flow cytometric studies has been photosynthetic members of communities (for a recent discussion of phytoplankton flow cytometry see Dubelaar et al., 2007) because of their ease of detection due to pigment autofluorescence. Many photosynthetic clades can be distinguished based on differential pigment composition and cell size. A notable example is the FCM-signature-based discrimination of the ocean cyanobacteria Prochlorococcus from its co-occurring sister group, Synechococcus, by photosynthetic pigments (divinyl chlorophyll a vs chlorophyll a and phycoerythrin) and cell size, and from larger co-occurring picoeukaryotic phytoplankton (Chisholm et al., 1988, Waterbury et al. 1984). Even without the additional probe- and dye-based discriminatory abilities of flow cytometry, its suitability for profiling photosynthetic microbes ensures its value as a tool particularly for aquatic microbial ecologists, and it has been used widely and successfully in a number of studies (e.g. Seymour et al., 2005, Johnson and Zinser et al., 2006, Mary et al., 2006, Thyssen et al., 2008).
FCM profiling of non-photosynthetic groups is more challenging because they possess less native FCM-signature information. Without fluorescence, small cells are difficult to image based solely on light scatter unless significant
instrument modifications are made for small-particle detection. As a result,
methods developed for epifluorescent microscopy have been transferred to FCM applications, for example DNA stains (e.g., Hoescht, DAPI, SYBR) may be used
to intercalate with cellular DNA and cause cells to fluoresce (when excited at the correct wavelength). Such bulk DNA staining can allow total microbial counts (e.g. in Kuypers et al., 2005), the delineation of gross microbial groups (e.g., high and low-DNA cells, Gasol et al., 1999), and the examination of cell physiology (e.g. LIVE/DEAD stains, Berney et al., 2007), it does not allow much resolution for community profiling.
Rather than bulk staining, clade-specific FISH tagging may be combined with FCM to enumerate particular phylogenetic groups from a community. FISH-FACS has begun to allow the enrichment of target populations from complex communities for further analysis. Although absolute separation of probe-targeted cell types has not yet been obtained, enrichment for targeted cells has been successful (e.g. type I and II methanotrophs enriched from 4.7% to 50% and 1.2% to 47.5%, respectively, Kalyuzhnaya et al., 2006; but only ~2-fold for targeted CFB and no enrichment for targeted β-proteobacteria in Sekar et al., 2004). Combining FCM with FISH involves many of the limitations and
challenges associated with FISH (especially the negative effects of contaminants not removed during sample preparation), while removing the spatial structural observational power of FISH, but it does allow the enumeration of the whole cells of targeted groups in a high-throughput manner.
In addition, advances in FCM, such as equipment miniaturization, are bringing down costs and enabling novel field deployments (Gruden et al., 2004, Yang et al., 2006). Perhaps pinnacle among these field efforts are the
“FlowCytoBot” (Olson and Sosik, 2007; Sosik and Olson, 2007) and “Cytosub” (Thyssen et al., 2008) which use robotics and autonomous sampling devices to enable in situ real-time FCM. The FlowCytoBot can be deployed for more than a month, and performs both in situ flow cytometry and automated image-based taxonomic identification of larger cells.
reproducible, and inexpensive (once a flow cytometer/sorter is available;
although most core facilities have them available because of their use in medical research). For community profiling, however, the approach has not been well developed for standard and comprehensive surveys. Depending on the
population being targeted and the identification method, FCM can be a relatively straightforward process or a technologically very sophisticated one that requires substantial expertise and validation.
Nucleic acid-based profiling
Since Pace et al. (1985) pioneered the use of ribosomal rRNA gene as a genetic marker for studying the diversity of microbes in natural systems, this new window has provided unprecedented views of the “uncultured majority” and vastly expanded our understanding of microbial diversity. The remainder of this chapter is devoted to reviewing the major culture-independent molecular
methods used to profile microbial communities. These methods fall into two fundamental classes: those that rely upon amplifying a single target gene from community DNA or rRNA, and use this gene to “fingerprint” the community through any of a number of methods, and those that directly examine the community DNA without gene-specific amplification (i.e. metagenomics). Single-gene surveys
One way to profile a community is by surveying a phylogenetically-informative marker gene within that community. Commonly-used phylogenetic markers include genes involved in translation (16S rRNA, 23S rRNA, the internal transcribed spacer (ITS) region between the two, and ribosomal proteins),
transcription, (e.g. transcription factors, and RNA polymerases component genes such as rpoB), and DNA replication and repair (DNA pol, recA), and other core cellular functions (e.g. the chaperone gene dnaK), as well as some functional genes that are considered phylogenetically robust (i.e., show little or no evidence of horizontal gene transfer), e.g. the pmoA gene of methanotrophs (McDonald et
al., 2008).
Caveats of DNA amplification
Single-gene investigations of community profiles use the polymerase chain reaction (PCR) to amplify the target gene from environmental DNA.
However, this amplification has several caveats. First, PCR reactions can create both errors (heteroduplex and chimeric products, as well as polymerase error) and biases (skewing of the relative proportions of sequence types). Both significantly effect downstream diversity estimates (Acinas et al., 2005, Thompson et al., 2002, Polz and Cavanaugh 1998). Second, given the
complexity of unknown microbial communities in the wild, primer specificity (as described above) may not be uncertain, i.e. primer sets may not amplify as comprehensively as they’re assumed to. For example, “universal”-primer-based surveys missed an entire high-level taxonomic group, the kingdom
Nanoarchaeota (Huber et al., 2002). Similarly, other primer sets continue to miss lineages (e.g. among the archaea, Teske and Sørensen, 2007, and among the planctomycetes, Derakshani et al., 2001, Köhler et al., 2008).
Several methodological adjustments have been suggested to ameliorate the problems of specific-primer-directed PCR. First, the number of amplification cycles should be kept to a minimum to decrease bias (Suzuki and Giovannoni, 1996) and to minimize chimera formation and polymerase errors (Acinas et al., 2005). Second, pooling replicate PCR amplification reactions helps compensate for early-cycle drift that leads to bias (Acinas et al., 2005, Polz and Cavanaugh, 1998). Third, reactions should be ramped as quickly as possible from denaturing to annealing temperatures (Acinas et al., 2005). Fourth, a “reconditioning”
approach minimizes heteroduplex and chimera formation, by employing a second low-cycle amplification using a dilution of the first amplification with excess primer (Thompson et al., 2002). Finally, as discussed above for FISH probes, it is
reassessed in light of the ever-expanding size of environmental sequence databases, and several combinations of primers may be used if the goal is to maximize the diversity of sequences recovered
Once amplified, phylogenetic marker gene amplicons can be used for community fingerprinting methods or sequenced.
Quantification during amplification
Quantitative PCR (qPCR) is widely used in microbial ecology as a means of directly enumerating the abundance of specific clades (via conserved sequences common to all clade members) in environmental samples. To date, many of these studies have examined specific food contaminants and pathogens, but qPCR has played a role in microbial ecology as well (reviewed in Zhang and Fang, 2006). Three studies of particular note apply such methods to ocean systems, and provide examples of the range of target genes used. First, Suzuki et al. (2000) was one of the first marine qPCR studies of the marine
picoplankton, and in surveys of Prochlorococcus, Synechococcus, and Archaea in Monterey Bay showed good concordance between 16S-targeted qPCR and other methods. Second, Johnson and Zinser et al. (2006) targeted the ITS region by qPCR to describe Prochlorococcus ecotype abundance across a basin-wide transect in the Atlantic Ocean. Remarkably, the qPCR results accounted for most of the FCM-detected Prochlorococcus populations in these ocean samples. A third study used qPCR of a functional marker gene (amoA) to quantify the relative abundance of putative archaeal and bacterial nitrifiers in Monterey Bay and the North Pacific Subtropical Gyre (Mincer et al. 2007). qPCR is highly reproducible and sensitive, relatively inexpensive, high throughput, and is a valuable tool for profiling particular community members. Significant primer optimization is required, and robust primer design relies on comprehensive environmental sequence information to ensure that the breadth of desired native diversity is targeted. In addition, single to several taxa can be profiled using
qPCR, but because of design and optimization issues and finite amounts of sample DNA this method is not practical for profiling many clades or taxa simultaneously.
Fingerprinting of amplified genes
Most profiling studies examine amplified phylogenetic marker gene using one or more fingerprinting method. These methods may be used as an end in themselves or as the first or complementary step in an investigation.
Fingerprinting methods separate amplicons based on sequence differences by assaying some consequence of those sequence differences - e.g., restriction sites, denaturation, or amplicon length. In general, these methods are useful for detecting structural changes in community composition between samples. Depending on the method and primer sets, these techniques may be executed along a scale from coarse to fine phylogenetic resolution. While inexpensive and relatively quick, these methods require substantial development and validation to connect particular fingerprints with particular clades. Furthermore, the dynamic range is often limited; beyond a narrow range, measurement of abundance
differences between samples may be qualitative rather than quantitative. Many of the methods described below are applied to a variety of genes, although some are specific to the 16S rRNA gene or operon, and for profiling purposes the 16S gene remains the most common target.
Fingerprinting by differences in denaturation and annealing
DGGE & TGGE: Denaturing or temperature gradient gel electrophoresis. DGGE & TGGE (reviews in Muyzer and Smalla, 1998, and Nocker et al., 2007, respectively) separate small (generally less than 800 base pairs (bp)) PCR products by dissociation differences caused by sequence heterogeneity.
Amplicons are electrophoretically separated on an acrylamide gel that contains a parallel denaturing gradient, generated either chemically (DGGE e.g. by urea-formaldehyde) or with temperature (TGGE). As amplicons move through the gel
towards the cathode, they enter increasingly denaturing conditions, causing bubbles of denatured DNA to form in the double-stranded amplicons. This greatly increases the molecules’ surface area, which significantly retards their movement through the gel. Sequence heterogeneity among the amplicons results in
difference points of denaturation, and thus different patterns of migration. Some DGGE & TGGE protocols incorporate a GC-clamp (usually ~ 40bp) on one primer in the PCR step, which will then act to hold a mostly-denatured amplicon together at one end as it moves through the gel (since G-C bonds are more stable than A-T ones, so a long G-C string will be slow to denature) and thus prevent or delay complete dissociation, which would complicate banding and interpretation. However, GC clamps can cause decreased PCR efficiency and increased likelihood of artifacts, and are not necessary if gentler denaturing gradients are used (Nocker et al., 2007).
Optimal denaturing conditions are first identified by running amplicons in multiple wells through a denaturing gradient perpendicular to electrophoresis, and then the optimized range can be used parallel to electrophoresis to generate the DGGE banding. Bands may be visualized by staining with DNA dyes, or primers can be fluorescently label to improve visualization sensitivity of denatured amplicons (e.g. 10-fold, Moeseneder et al., 1999). As with all
fingerprinting methods, the phylogenetic specificity of DGGE and TGGE depends on the specificity of the primers used for amplification, although the methods are inherently limited in resolution due to their gel separation and visualization steps. They are generally used to identify bulk shifts in community composition,
although they can be used effectively to track specific changes in simpler communities (Nocker et al., 2007), and there is continual refinement of group-specific DGGE primer sets (e.g. updated marine bacterial clade primers, Mühling et al., 2008). Under typical conditions, the limit of detection of DGGE and TGGE is target groups that represent at least ~1-2% of the community (Nocker et al., 2007). The method is inherently quite sensitive to sequence variations among
amplicons, and bands can be excised and sequenced to link bands to particular genotypes. However, as with many fingerprinting methods, one band or
fingerprint type cannot be assumed to derive from a single phylogenetically coherent sequence clade. In addition, tailoring denaturing conditions to the
particular amplicons under study can be time-consuming, and it can be difficult to compare data robustly between runs and labs because of gel variability; though see “Additional Considerations” below.
DHPLC: Denaturing high-performance liquid chromatography. PCR
products are separated using temperature and chemical denaturation. Products loaded onto an HPLC-cartridge in a solution of acetonitrile and triethylammonium acetate, TEAA. The TEAA converts to TEA+, an amphiphilic molecule, which interacts with the DNA at its charged end, and the HPLC cartridge material at its nonpolar end, thereby tethering the amplicons in place. The amplicons are sequentially eluted from the cartridge by increasing the temperature and
acetonitrile concentration. Elutants are quantified by a UV detector that measures absorbance at 260nm, or amplicons can be fluorescently labeled via their PCR primers. A fraction collector can be joined to the HPLC to collect eluted
fragments for further characterization. DHPLC does best at separating smaller fragments below about 500bp, but can work on larger e.g. 1500bp molecules at decreased sensitivity. Separation parameters need to be carefully tailored for the targets of interest, and this can be extremely time-consuming.
CDCE: Constant denaturant capillary electrophoresis. CDCE was
developed for, and remains primarily used for, genetic screening of mutations (Khrapko et al., 1994), but has been applied to community profiling in microbial ecology (Thompson et al., 2004). PCR products are loaded onto a
polyacrylamide capillary with constantly denaturing conditions (chemical- or temperature-based). Amplicons denature dynamically to differing degrees and rates based on their sequences, causing them to travel at different speeds, and elute at different times from the capillary. By tagging PCR primers with a
fluorophore, product elution can be measured by laser detection. CDCE has high sensitivity to single base pair differences, and there is a quantitative relationship between fluorescence intensity of eluted fragments and their relative abundance. Eluted amplicons can be collected for further analysis.
SSCP: Single strand conformation polymorphism. PCR amplicons are uniformly denatured first, and then are run on an acrylamide gel or on a capillary sequencer as single-stranded molecules. The ssDNA molecules folds back on themselves creating internal secondary structure. This secondary structure will result in differential migration through a matrix, and allow for separation. A challenge of SSCP is the difficulty of keeping ssDNA from re-annealing to its complement during gel loading and running. However, one of the two primers can be tagged with a 5’ phosphate group, which allows selective targeting of one of the two strands by lambda exonuclease (Nocker et al., 2007; Schwieger and Tebbe, 1998). Interpretation of results can be complicated by the fact that single ssDNA sequences can fold in multiple ways, which if they have similar energetic favorability can result in a single sequence type being represented by several bands.
Fingerprinting by amplicon restriction site heterogeneity
ARDRA: Amplified ribosomal DNA restriction analysis. The 16S rRNA genes are PCR-amplified from bulk community DNA, and cloned. Clones are then restriction digested and the fragments are separated on a gel, visualized by gel staining with a DNA dye (e.g. ethidium bromide), and the banding pattern is interpreted as a low-resolution proxy for phylogeny. Multiple restriction enzymes are required in order to differentiate among lineages (Moyer et al., 1996), and enzyme choice has a significant effect on the scale of resolution (Zeng et al., 2007). Generally, clones are also sequenced to validate interpretation of banding patterns. Using higher taxonomic-level 16S rRNA gene primers for amplification leads to in low resolution sample comparisons, while more taxonomically-specific
primers can be used to investigate particular clades of interest, as ARDRA is able to discriminate at the species level (e.g. among bioluminescent marine bacteria, Kita-Tsukamoto et al., 2006). ARDRA is inexpensive and technically straightforward, however has a relatively low sensitivity and variable resolution, and as with all gel-image-based methods, comparing profiles confidently over time or between labs can be challenging. It is used for overall community profiling (e.g. Polz et al., 1999), examining specific clades of interest within communities (e.g. Kita-Tsukamoto et al., 2006), or directing investigations of 16S clone libraries in order to optimize the cost-benefit between clone sequencing and adequate description of community diversity (e.g. Sun et al., 2008), or for indirect community profiling by distinguishing among isolates (e.g. Michel et al., 2007).
TRFLP: Terminal restriction fragment length polymorphism. TRFLP (discussed in Hartmann and Widmer, 2008) begins with gene-specific PCR amplification using a fluorophore-conjugated primer. Amplicons are restriction digested, and fragments are separated by size using capillary electrophoresis, and visualized in Genescan mode. Restriction site distribution can be a
phylogenetically informative character, and methods are tailored by initial in silico experiments using existing databases (e.g. testing the specificity of a particular primer set /restriction enzyme combination against all of RDP, Marsh et al., 2000, Kent et al., 2003). As with ARDRA, the use of multiple enzymes can help refine resolution of interpretation, and data analysis must be done carefully (Osborne et al., 2006). Caveats include incomplete restriction digestion, and a slowing of fragment migration due to unwieldy dye molecules (although not all dye
molecules have a significant effect on mobility) (Nocker et al., 2007). TRFLP is typically more sensitive than DGGE (e.g. five times as sensitive, Tiedje et al., 1999) due to fluorophore-based visualization rather than gel staining, although it may be less sensitive that LH-PCR (discussed below) because of partial
restriction digestion (e.g. in an ITS analysis using tRFLP and LH-PCR, LH-PCR was both more sensitive and higher resolution, producing more distinct bands
than tRFLP, Mills et al., 2003). TRFLP analyses of a number of genes are
common in microbial ecology studies (e.g. Bertilsson et al., 2007, Goffredi et al., 2008, Morris et al., 2005, and Horz et al., 2005, Appendix 3) because of the method’s relative ease and high reproducibility.
Fingerprinting by amplicon length
LH-PCR: Length-heterogeneity-PCR. LH-PCR (reviewed in Mills et al., 2007) examines a subsection of the 16S rRNA gene, spanning some subset of its variable regions, and amplicons (uncloned) are then distinguished based on length heterogeneity. Since relatively small amplicons are created (generally several hundred base pairs), small differences in length can be resolved. One primer used for amplification is fluorescently linked, to allow relatively precise size assessment of amplicons using capillary sequencers in Genescan mode. The area under the Genescan peak is used as a metric for the abundance of a particular fragment length class. LH-PCR has been used in a number of
community profiling studies (e.g. Suzuki et al., 1998, Ritchie et al., 2000, Mills et al., 2003, Brusetti et al., 2006, Sekar et al., 2006). As with ARDRA, primers can be taxonomically tuned to allow the fingerprinting method to focus on particular clades (e.g. LH-PCR targeted to bovine gut commensals, Bernhard and Field 2000). LH-PCR can also be used on intergenic regions of other operons, and has been for the amoC-amoA operon (Norton et al., 2002).
ARISA: Automated ribosomal intergenic spacer analysis. Rather than
fingerprinting the 16S rRNA gene, ARISA uses the amplified, uncloned intergenic transcribed spacer (ITS) region between the 16S and 23S rRNA genes in the rrn operon. The ITS can be amplified from across broad taxonomic range by using conserved primers within each of the highly conserved flanking gene, though primers can be tailored to specifically target clades of interest. The ITS evolves at a faster rate than the rRNA genes, providing a finer scale of phylogenetic
(Brown et al., 2005). Initially, ARISA amplicons were separated on
polyacrylamide gels and visualized with silver staining, but later incorporated fluorescently-labeled primer-based visualization using capillary system (Fisher and Triplett, 1999). The amplicons generated using ARISA are generally longer (typically over a thousand bases) so the resolution of length may not be as precise as in LH-PCR (depending on the primers used in LH-PCR), although a larger variety of fragments is produced, potentially allowing finer-scale resolution. Again, Genescan peak area is used as a proxy for the abundance of the
fragment source clade(s). ARISA has been used for a number of high
phylogenetic-resolution community profiling studies, some with large numbers of samples, draw sophisticated correlations between detailed community structure and environmental parameters (e.g. from oceanic drifter samples, Hewson et al., 2006a, and at several Microbial Observatories; Fuhrman et al., 2006, Hewson et al., 2006b, Kent et al., 2007).
ITS-LH-PCR is a variant of ARISA, achieving yet a finer level of phylogenetic resolution. It involves a second, parallel step of restricting ITS amplicons by targeting the tRNA-alanine genes that commonly occur within ITS regions (Suzuki et al, 2004), and then estimating the size of the restricted fragment. This form of ITS-LH-PCR provides a higher degree of phylogenetic specificity among those clades with a tRNA-alanine in their ITS, as compared to standard ITS-LH-PCR/ARISA. ITS-LH-PCR has been used as a library-screening method (Suzuki et al, 2004) to assess community diversity captured in a large-insert clone library.
There are caveats involved in the interpretation of ITS patterns observed with ARISA. First, not all species have linked 16S and 23S rRNA genes (e.g. in Planctomycetes, Liesack and Stackebrandt, 1989, Menke et al., 1991). Second, many organisms have multiple linked 16 and 23S rRNA genes in their genomes, the copies of which may or may not be identical. A recent study of 155 fully-sequenced bacterial genomes showed the average number of rRNA (rrn)
operons per genome to be 4.8 (range 2-15), with 2.4 unique ITS length variants per genome and 2.8 unique ITS sequence variants (Stewart and Cavanaugh, 2007). Thus, although gene conversion does act to homogenize multiple rrn operons in a genome, substantial heterogeneity persists (Stewart and
Cavanaugh, 2007). Third, there appears to be preferential PCR-amplification of shorter ITS templates (Fisher & Triplett, 1999) causing the relative abundance of variants to be skewed (beyond other potential PCR biases; see “Amplification” section).
ARISA is relatively easy, and like LH-PCR its profiles are digitally extracted, and run alongside markers, and so can be compared easily between runs and labs. However, it is “destructive” fingerprinting and amplicons cannot be sequenced after they are measured.
Fingerprinting - Additional considerations: Lineage differences in target gene copy number, and intragenomic diversity of multicopy genes, can have potentially confounding effects on fingerprint-based single-gene community profiling. For example, with a range of 2-15 rrn operons per genome among 155 bacterial genomes (Stewart and Cavanaugh, 2007), 16S- or 23S-based diversity could overestimate organismal diversity quite considerably. In addition, for many of above fingerprinting methods, it can be difficult to compare between labs and environments. And for all of the above methods, it is not always straightforward to convert fingerprint data into ecologically-meaningful metrics. A recent unified set of metrics has been proposed (Marzorati et al., 2008), developed for DGGE but also applicable to other fingerprint data, and summarized here as being of particular interest. This conversion of fingerprints to environmental metrics has three steps: 1. Generation of a range-weighted richness, Rr, describing the relative complexity of the fingerprint given the degree of separation applied; in the case of DGGE this would involved the number of bands (N) and the
denaturing gradient the span of given bands (Dg, e.g. 35% to 40% urea and formamide), such that Rr = (N2 × Dg). 2. Community dynamics, Dy, where profiles
are available for the same community over time (which they usually are, since they are used to identify shifts in community composition). This uses a moving window analysis to look at the Pearson correlation between subsequent time points, and calculates the consecutive percent change of the community at consecutive times. This is then converted into a Dy value for that community averaging the moving window percent change values over time. Low Dy values represent communities that do not change quickly or substantially, and high Dy values indicate highly dynamic communities. 3. Functional organization, Fo, is a proxy for evenness of the fingerprints observed. It is plotted as the number of unique fingerprint elements observed along the x axis, and their contributions (by e.g. intensity) along the y axis, such that a 1:1 line would represent perfect
evenness and skewing from that line indicates the relative unevenness of a community. The authors take this final Fo metric a step further to tie evenness to community resiliency, but regardless of the merits of that connection, the
potential utility of these basic quantification metrics stands. A given environment can then be plotted as a point in three dimensions, and compared to other environments.
Fingerprinting summary: The important unifying caveats of these methods are that single observed fingerprints may not be phylogenetically coherent, and that different fingerprints using a given method probably do not reflect the same level of phylogenetic resolution. In addition, since most techniques are not universal in their coverage, they may miss significant subsets of the community. Also, many of them have limited dynamic range, which may preclude accurate relative abundances comparisons of different groups among samples.
Fingerprinting methods are ubiquitously used in microbial ecology research as they provide quick, relatively inexpensive profiling information. However, care must be taken in their interpretation and validation. Additional overall conclusions about fingerprinting methods are that visualization by fluorophores leads to higher sensitivity than by gel staining, and methods that capture data in silico
(e.g. using Genescan mode of capillary sequencers) offer higher resolution and reproducibility.
Sequencing of Amplified Genes
The highest-resolution way to distinguish sequence variants among PCR amplicons is to sequence them. Because these community PCR amplicons are heterogeneous, they must be first cloned in order to separate each variant and then individually sequenced. Although it has been speculated that small-insert cloning introduces bias, (e.g., small sequences clone with higher efficiency, end sequences can effect modification reactions required in cloning, and expressed inserts may be toxic to the host), one recent study showed good congruence between chemically dissimilar cloning methods and concluded that in general, little bias is introduced using the common TOPO TA cloning method (in a ITS and rRNA-gene survey, Taylor et al., 2007). Sequencing 16S rRNA gene clone libraries remains the gold standard for profiling communities, and there is a wealth of information about interpreting microbial diversity with this method (e.g. Schloss, 2008, Fierer et al., 2007, Janssen, 2006, Bohannan and Hughes, 2003, Hughes et al., 2001), and so it will not be discussed in depth here.
New high-throughput sequencing technologies, e.g., “454” or
“pyrosequencing” (Margulies et al., 2005), allow direct sequencing without the need to clone, separating templates instead using microfluidics, dilution, bead-binding, and isolation within tiny reaction wells for sequencing reactions. This technique therefore avoids potential amplification and cloning biases, and also generates up to 400,000 sequencing reads per run. Current limitations are that sequencing chemistry is expensive, and read lengths are significantly shorter than traditional Sanger sequencing (100-250 bases versus 750+ bases). These shortened read-lengths create a trade-off between robust phylogenetic
assignment (e.g. see Krause et al., 2008) and phylogenetic discrimination. However, some analyses indicate that short reads can still allow profiling via the
16S rRNA gene with some confidence, at varying levels of resolution, depending on the assignment method used (e.g. Liu et al., 2007, Sundquist et al., 2007), particularly when variable regions within the 16S gene are targeted (e.g. Sogin et al., 2006, Huber et al., 2007, Roesch et al., 2007). In addition, technology
improvements are producing ever-lengthening reads (e.g., 500 bases by the end of 2008 with 454 technology, and an estimated 20kb by Pacific Biosciences in 2010, Korlach et al., 2008).
DNA microarrays:
In general terms, DNA microarrays are a hybridization platform, with DNA probes immobilized on a substrate (often a glass slide), used to query a mix of nucleic acids for complementary sequences. The query mix is labeled with a fluorophore such that its hybridization of to the immobilized probes can be visualized. A single array can contain tens of thousands of probes, deposited using robotic spotters or synthesized in place using photolithography. Since their development, microarrays have been used primarily in gene expression studies to compare expression across different cellular types or conditions. However as the technology has matured, microarrays have been applied to a widening range of biological questions, including microbial ecology. Microarrays are currently applied in microbial ecology to assay the presence and relative abundance of particular organisms or genes (for reviews see Lucchini et al., 2001, Zhou, 2003, Gentry et al., 2006, Wagner, 2007).
There are two broad categories of microbial microarrays. The first,
representing the majority of microarrays, target particular genes. There are two types of gene-specific arrays. In the first, arrays target putative functional guilds (e.g. sulfate reducers, nitrogen fixers, etc.), either via functional genes in the pathway(s) of interest or 16S genes in cases where 16S identity correlates to conserved metabolism (Small et al., 2001, Wu et al., 2001, Cho and Tiedje, 2002, Koizumi et al., 2002, Loy et al., 2002, Bodrossy et al., 2003,
Taroncher-Oldenburg et al., 2003, Greene and Voordouw, 2003, Stralis-Pavese et al., 2004, Tiquia et al., 2004, Rhee et al., 2004, He et al., 2007). The second type of gene-specific arrays are those which attempt to holistically profile a community, via its 16S diversity (e.g. Wilson et al., 2002; Marcelino et al., 2006; Palmer et al., 2006; Brodie et al., 2007; DeSantis et al., 2007). For both types of gene-specific
microarrays, PCR amplification of the targeted gene from the sample is typically (though not always) performed prior to or as part of the labeling reaction, such that labeled amplicons are hybridized to the arrays.
The second, less common category of arrays used in microbial ecology studies are community genome arrays (CGA) which use entire genomes as probes (e.g. Wu et al., 2004, Wu et al., 2006, Bae et al., 2005), and evolved from earlier lower-throughput platforms whose use was dubbed “reverse sample genome probing” (RSGP; reviewed in Greene and Voordouw, 2003). Thus far, such arrays have relied on axenic cultures or isolates in order to generate the required genome probes. However, it has been suggested (Zhou, 2003; Greene and Voordouw, 2003) that environmental genomic surveys and large-insert clone libraries could instead be used to identify and generate genome fragment probes.
It is in this context that the genome-proxy array has been developed, and is described in this thesis. The genome proxy array is a hybrid of the two major categories of arrays currently used in microbial ecology, in that it targets
genomes and genome fragments through many individual gene-specific oligonucleotide probes. In many respects it is conceptually more like a multi-species “comparative genome hybridization” (CGH) array. The multiple oligonucleotide probe design allows a finer-scale resolution than using entire genome fragments, and allows related cross-hybridizing sequences to be distinguished based on their hybridization patterns. In the genome proxy array, sets of 70-mer oligonucleotide probes (generally n=20 per genotype) were designed to different genomes and genome fragments derived from microbial assemblages found in the ocean, one of the most comprehensively characterized
and genomic sampled environments on earth. The majority of these targets (roughly two-thirds) were sequenced from in-house large-insert environmental genomic libraries, captured from the same sites under investigation. This array platform is described further in Chapter 2.
Microarrays have certain inherent limitations, as a technology based on hybridization. Microarrays can generally only provide information about what is represented on the array, or closely related sequences (although see Wang et al. 2002), and are thus fundamentally different from metagenomics in their ability to profile communities, and are more akin to methods like FISH. In addition, arrays provide relative rather than absolute quantification (although correlations
between array signal and absolute abundance can be strong). The strength of microarray profiling is in the simultaneous tracking of many distinct organisms or genes, unlike FISH, FCM, or Q-PCR, and at a higher and more reliable level of resolution than fingerprinting methods.
Community Genomics, aka Metagenomics
There are two distinct methods for obtaining metagenomic data from a community. Environmental DNA can be cloned into small- (e.g. shotgun) or large-insert libraries (e.g. fosmid and BAC), and some or all of the clones can be sequenced, either in a random or a targeted (i.e. based on screening of the library for clones of interest) approach. Alternatively, new methods have allowed environmental DNA to be sequenced directly without cloning.
Environmental genomic libraries: Small-insert environmental genomic clone libraries(or shotgun clone libraries) have been used in a number of different environments to capture small genomic DNA fragments from the numerically dominant members of natural microbial assemblages (e.g. Tyson et al., 2004, Venter et al., 2004, Tringe et al, 2005, Strous et al., 2006, Rusch et al., 2007, Yooseph et al., 2007, Kurokawa et al., 2007). The relative success of small-insert metagenomic studies is directly related to the complexity of the community, the
amount of sequence obtained, and the goals involved. To date, these libraries have been used to reconstruct near complete “population genomes” from low complexity communities (e.g. Tyson et al., 2004, Strous et al., 2006), and also used for gene-centric approaches in more complex environments (e.g. Yutin et al., 2007). In both cases, these data are used to look at the distribution and diversity of organisms and provide insight into their metabolic and functional capabilities.
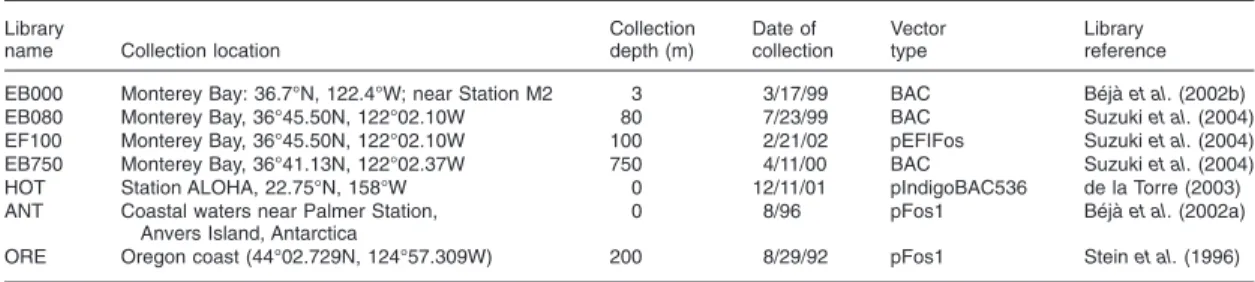
Large-insert environmental genomic clone libraries typically employ a bacterial artificial chromosome (BAC, insert size ~20-160kb) or a fosmid (insert size ~35-40kb) to capture large genomic fragments from a cross-section of individual microorganisms from the environment. Such large-insert libraries have been constructed from a number of habitats and extensively screened for clones of interest (e.g. Rondon et al., 2000, Béjà et al., 2002a, Zeidner et al., 2003, de la Torre et al., 2003, Treusch et al., 2004, Béjà et al., 2000, Sabehi et al., 2005, Frigaard et al., 2006, Neufeld et al., 2008). 16S- or ITS-profiling of libraries has also been proxy for profiling of the communities themselves (e.g. Suzuki et al. 2004, Martin-Cuadrado et al., 2007, Neufeld et al., 2008). End-sequencing of large-insert libraries has been used to describe the taxonomic and metabolic profile of the community (e.g. DeLong et al., 2006, Appendix 4, Martin-Cuadrado et al., 2007), while full-sequencing of particular clones has been used to
investigate genomic context for particular groups or processes of interest (e.g. Béjà et al., 2002a, Zeidner et al., 2003, Hallam et al., 2006, Frigaard et al., 2006, Martinez et al., 2007, McCarren et al., 2007, Neufeld et al., 2008).
Metagenomics without cloning: Cloning of unamplified total DNA (shotgun cloning) and subsequent sequencing is being eclipsed by highly-parallel, clone-free sequencing technologies, such as pyrosequencing (described above). Such clone-free sequencing avoids cloning biases, and is cheaper per base pair obtained. Currently this approach suffers only from short read lengths, but they are quickly increasing, see above. There have been a number of pyrosequencing
studies in microbial ecology (e.g. Mou et al., 2008, Dinsdale et al., 2008b, Wegley et al., 2007) with perhaps the most advanced to date including a simultaneous comparison of 45 microbiomes and 42 viromes (Dinsdale et al., 2008a), and an ocean microbial metagenome versus meta-transcriptome study (Frias-Lopez & Shi et al., 2008). Although these studies offer previously
unobtainable insights into microbial communities, made possible by the sheer depth of sequencing involved, care must be taken in comparing studies using unamplified DNA with those amplifying DNA prior to sequencing. Multiple
displacement amplification (MDA), using the phi29 polymerase, has been used in a number of pyrosequencing studies (e.g. in some but not all of those reported in Dinsdale et al., 2008b), and its biases in complex mixed community samples have not yet been described.
The metagenomic approach, by bypassing the preconceptions (e.g. about particular known sequence and metabolic diversity) inherent in the design and implementation of other profiling methods, offers microbial communities the clearest opportunity to “tell the story” of what is important in their world. In
addition to the potential biases of pre-sequencing amplification, however, a major caveat of both cloning-based and cloning-free metagenomics is that the bulk of sequence space remains unexplained and undefined, with the majority of metagenome reads representing sequences of unknown function.
Community Profiling Conclusions
A wealth of profiling tools are available for characterizing microbial communities, and each has its strengths and weaknesses. As the price of
sequencing continues to fall it will replace other methods, as it has already begun doing. In the interim, and to direct sample choice for community sequencing efforts, alternative profiling methods will continue to be useful, and remain widely applied in the field. Furthermore, some of these methods have uses other than just community profiling (e.g. FACS and FISH) and so will remain important tools
for years to come.
Presentation of the Genome Proxy Array in this Thesis
This thesis describes the development, testing, and application of a new microarray-based tool for community profiling. It builds upon a pre-existing
knowledge of communities of interest derived from the sequencing of clones from environmental large-insert clone libraries, and of cultured isolates from related habitats. Like other indirect tools for microbial community profiling (Rohwer, 2007), the genome-proxy microarray is expected to be mostly obsolete within five years and entirely obsolete in 10, as sequencing costs decrease and massive sequencing is feasible for high-resolution spatial and temporal studies of microbial communities, in research labs at all funding tiers.
Chapter 2 of this thesis has two sections. The first places the genome proxy array in the context of marine microbial research, and expands upon the
applications of other microarrays to microbial ecology. The second section describes the design and validation of a prototype of the genome proxy array, in a published paper.
Chapter 3 is a manuscript in preparation describing the design, development, and validation of the expanded genome proxy array, and its application to a time series in Monterey Bay.
Chapter 4 summarizes the work and outlines the next directions for the use of this tool during its remaining lifetime of relevance.
Appendices include the methods developed for this array platform, a primer on array design, and two papers I have been involved in during my PhD whose scope pertains to the topics covered in Chapter 1.
Figure 1. Community profiling methods in microbial ecology. A community sample may be treated in a number of ways during profiling, as presented in this review (greyed sections are not covered in depth). Dashed lines indicate less common links between methods.
Chapter 2
Development and Validation of a Prototype Genome Proxy Array.
2a. The case for the genome proxy array: motivation and context.
2b. Rich, V.I., K. Konstantinidis, and E.F. DeLong, 2008. Design and testing of ‘genome-proxy’ microarrays to profile marine microbial communities. Environmental Microbiology. 10(2): 506-521.
I. The Case for Microarrays in Marine Microbial Ecology
As details of the marine microbial communities have been revealed at ever-finer scales, the complexity and variability of marine microbial diversity continue to astonish (e.g., Acinas & Klepac-Ceraj et al., 2004, Thompson et al. 2005, Rocap et al., 2003). In tandem, the importance of these communities to global biogeochemistry has become increasingly evident (e.g. Howard et al., 2006, Karl et al., 2007, Moran and Miller, 2007, Kuenen et al., 2008). This deepening
knowledge of, and respect for, marine microbial communities, particularly as scientific and societal concern over global change grows, has led to increasing research efforts devoted to further understanding their composition, dynamics, and functional capacities, and how observed genomic variability relates to functional variability at the level of organism and system.
Historically, the majority of marine microbial community studies have focused, of necessity, on specific phylogenetic or functional groups, or taken a coarser-grained higher-taxonomic-level approach. Recently new methods have allowed the scope of microbial community investigations to broaden without coarsening and to encompass entire co-occurring microbial communities and their metabolic potential. Despite the deluge of community genomic sequence information
brought by the field of marine microbial metagenomics (e.g. Venter et al., 2004, DeLong et al., 2006 (Appendix 4), Rusch et al., 2007, Yooseph et al., 2007, Martin-Cuadrado et al., 2007, Mou et al., 2008, Dinsdale et al., 2008) our understanding of marine microbial ecology remains far from complete.
Thus far marine metagenomic studies have been snapshots of communities, and have been enormously informative but do not reveal community dynamics. Microbial ecology is at a cross-roads, with a need for repeated community-level sampling to better understand both the variability of the tools themselves
(notably, metagenomics is single sequence datasets randomly sampled from large pooled sample), and the actual variability of communities across time and