-1-Cryotribology of Diamond Film-Coated Silicon Disks Against Metals, Ceramics, and Natural Diamond
by
Thomas M. Willett BA Mathematics and Physics
(1993)
Submitted to the Department of
Mechanical Engineering in Partial Fulfillment of the Requirements for the
MASTER OF SCIENCE at the
Massachusetts Institute of Technology May 1995 copyright Massachusetts All rights Signature of Author . Certified by ...
/i
Institute of Technology reserved m... :c..i o. E... i /,1 Department of Mechanical Engineering- v
/[I~~~~~~~
.
...
~Yukikazu Iwasa
~-."-a A- '" " .s SupervisorAccepted
by..
...
. : . ...
'...
Ain A. Sonin Chairman, Department Committee on Graduate Studies
..i~A; s-rs il~s-il;riy
OF r.t,..OL OG¥
AUG 31 1995
LIBRARIES
CRYOTRIBOLOGY OF DIAMOND FILM-COATED SILICON DISKS AGAINST METALS, CERAMICS, AND NATURAL DIAMOND
by
THOMAS M. WILLETT
Submitted to the Department of Mechanical Engineering on May 22, 1995 in partial fulfillment of the requirements for the degree of Master of Science ABSTRACT
Cryogenic tribology is the study of the friction and wear of materials at very low temperatures. In this research the range of temperatures investigated was 4.2 to 293 K, with particular emphasis on 4.2, 77, and 293 K. Hardness of a material is inverse with temperature and this change in physical parameter was examined for its effect on tribological behavior. The testing was carried out using a pin-on-disc tribometer. Natural diamond and representative metals, ceramics were tested primarily against chemical vapor deposition (CVD) diamond films. The friction was recorded during testing and the wear was measured after testing using a stylus profilemeter. Several results were collected. Friction is inverse with hardness for most material combinations. Wear is inverse with hardness for most material combinations. Further wear is inverse with hardness across all material combinations. Of particular interest was the low observed friction between natural diamond on CVD-diamond film.
Thesis Supervisor: Dr. Yukikazu Iwasa
Title: Research Professor, Francis Bitter National Magnet Laboratory, Senior Research Engineer, Department of Mechanical Engineering
-3-Acknowledgements
I would like to take this opportunity to thank the following people for their support and contributions. First, I would like to thank Dr. Yukikazu Iwasa, my advisor, for much guidance and patience. Next, Dr. Ernest Rabinowicz for his generous advice and diamond connections. Drs. Koji Kobashi and Yoshio Kawate, of Kobe Steel Ltd., have generously provided the CVD-diamond film specimens tested. I would like to thank my colleagues Mamoon Yunus, Humwook Lim, and Jun Kim for their support, Ahmet Ashaboglu for his assistance.
On a more personal note, I would like to thank my mother and my father, and most of all my fiance Reimi for motivating me to finish my work.
Table of Contents
A bstract... 2
Acknowledgements... 3
Table of Contents ... 4
1. Introduction and Background ... 5
Tribology ... 5 Friction... 5 A dhesive friction... 8 A brasive friction ... 8 W ear ... 9 A brasive w ear ... 11
D elam ination w ear ... 11
2. M ethods and M aterials ... 15
A pparatus ... 15
M aterials... 17
Sam ple Preparation ... 22
Testing... 22
3. Results and Discussion ... 23
Results concerning CVD-diamond films ... 23
Results on Natural Diamond ... 30
O ther Results ... 32
Conclusions... 35
References... 36
A ppendix A ... 38
-5-1. Introduction and Background
Tribology
Tribology is from the Greek "tribos" meaning sliding and "ology" which is the study of. Hence we have tribology, the study of sliding. In truth, it is the study of what occurs during sliding, and indeed during many other activities, and that is the creation of friction and wear. Friction and wear are intimately linked, as will be shown, and manage to find their ways into most aspects of our lives. Indeed, engineers should be most aware of the effects of friction and wear, and take these into consideration during the design and construction of devices. This thesis grew out of an established research project to identify and examine those tribological issues of importance to the design and construction of cryogenic devices including superconducting magnets[l-4].
Going back to linguistics, we examine cryotribolgy, which is a shortened form of cryogenic tribology, which is of course the study of tribology at cryogenic temperatures. The temperatures we dealt with are 77 and 4.2 K, compared with 293 K which is approximately room temperature. One may ask why does tribology warrant special investigation at cryogenic temperatures? In general, material properties are altered as temperatures are lowered into the cryogenic region, which has some effect on the tribological properties of said materials. This section will outline some basic principles of tribology and elucidate on what effect cryogenic temperatures have on materials.
Friction
Friction is defined as the tangential resistance to relative motion between bodies in contact. The frictional force arises from the molecular and mechanical interactions of the surfaces at the area of contact. While there is no universally agreed upon theory of friction, there are certain quantitative laws concerning friction that have been more or less agreed upon. They are as follows:
1. The friction force F is proportional to the normal force L, that is,
F=p!L 1.1
where is the coefficient of friction. p is thereby given by the ratio of the frictional force to the force normal to the sliding surfaces.
F
1.2
2. The friction force is independent of the apparent area of contact Aa. 3. The friction force is independent of the sliding velocity v.
These three laws provide a quantitative framework within which scientists and engineers study friction.
The first law is generally well obeyed. Exceptions generally occur with very hard or very soft materials, such as diamond (hard) and teflon (soft). In these cases the friction is related to some other power of the load besides a linear one given by Eq. 1.1. Other materials which may violate this linear law are those with a hard surface coating on a soft substrate. When the load, or wear, becomes too great the hard surface is broken and the properties of the substrate come into play.
The second law of friction was a great puzzlement for researchers for well over two hundred years, until around 1940, when the idea was proposed to look beyond the apparent area of contact. Hence, when discussing frictional processes it is necessary to distinguish between the apparent area of contact Aa and the real area of contact Ar. The apparent area of contact is the area that appears to the human eye to be making contact between two or more surfaces, according to the geometry of the situation. But no surface is perfectly smooth, in actuality consisting of an uneven series of high and low spots. The real area of contact is defined by the area where the high spots, or asperities, of each surface come into contact with one another. As a normal load is applied between the contacting surfaces, the asperities deform to create the total contact area, which is determined by the flow stress of the softer material. For most engineering materials this flow stress is equated to the indentation hardness of the material. Hence the real area of contact can be estimated as such,
L
Ar-
r~~~~~~p~~
~1.3
where L is the applied load, and Hp is the indentation hardness of the softer material. Typically the real area of contact is much less than the apparent area of contact, on the order of 1/20. Figure 1.1 is an illustration of an interface, demonstrating the apparent and real areas of contact.
The third law of friction is the most violatable of the group. It is not surprising to see moderate violations of this law, but serious ones are rare.
Friction is a complicated matter, and one of the complications arises at the time when relative motion begins. It has been observed that the force needed to begin relative motion between surfaces differs from the force necessary to maintain that motion once begun. This leads to definition of two separate coefficients of friction: one describing the
-7-A.
e Ar
J
Figure 1.1.
of contact. Schematic illustration of an interface, showing the apparent and real areas
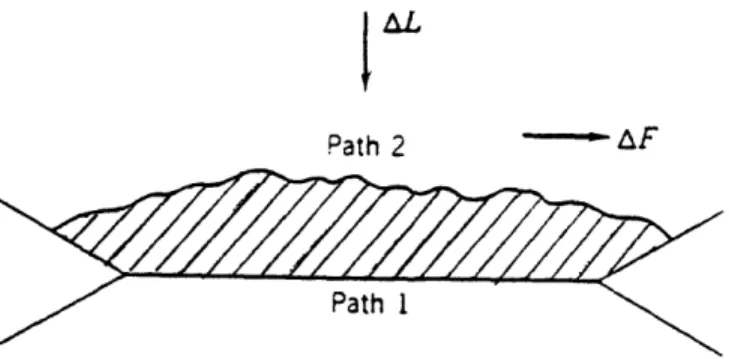
[AL
Path 2 - AF
Figure 1.2. Shearing of a junction. When the shear strength of the junction is much bigger then the bulk strength of the top material, shear will occur along path 2 producing the fragment shaded.
He
4
friction before motion and one describing friction after motion commences.These are known as the static and kinetic coefficients of friction, us and uk, respectively. Generally the kinetic coefficient of friction is less than the static, ie. Uk<Us. Throughout this thesis when we refer to the coefficient of friction u we mean k the kinetic coefficient of friction.
Sliding friction arises from two basic mechanisms; rupture of intermolcular bonds between surfaces, known as adhesive friction, and mechanical fracture of the asperities and other surface features, known as abrasive friction. Simply put, the frictional force is the force needed to break the molecular bonds between asperities or the asperities themselves.
Adhesive friction
The high stress at the junction of opposing asperities produces molecular forces between the surfaces which bind them together. The strength of these junctions are dependent upon several factors, including the chemical compatibility of the opposing surfaces, the cleanliness of the contact area, and the time allowed for the junction bond to grow to full strength. Once a junction is formed, an increasing tangential force between surfaces leads to elastic deformation in the direction of the sliding motion. As long as the relative displacement is small compared with the junction size ( 10-100 um) [5], the deformation approximates plastic flow [6]. However as the displacement approaches the size of an asperity junction, the junction is broken and full-scale sliding ensues. After the old junction is broken, other opposing asperities come into contact and new junctions are formed. The cycle of junction formation, growth, and rupture happens continuously while sliding occurs. Variations in the sliding conditions, such as speed, distance, temperature, or time, affect the strength of the junctions between two surfaces. Add to that the varying numbers and sizes of junctions, and it is understandable why fluctuation
in the observed frictional force is all too common in adhesive sliding scenarios.
Abrasive friction
Mechanical as well as molecular interactions play their part in contributing to the friction force. Friction arising from a mechanical nature is typically labelled abrasive friction. Typically two interactions are responsible for abrasive friction; the interlocking of opposing asperities, and the ploughing of one or both of the surfaces by an asperity or some other particle. Asperities in contact between surfaces often interlock with one another. The tangential force is acting on one surface in the direction of sliding motion, and is opposed by the force arising from asperities. The friction force is the force needed to either overcome interlocked asperities, or to break either or both opposing asperities. Ploughing describes the action of an asperity penetrating the surface of the opposing material and seeking to gouge out a path for itself. Ploughing also has two possible outcomes: the penetrating asperity is successful in ploughing a path for itself, in which case the friction force is the force necessary to push the opposing material out of the way;
-9-or the asperity is broken off from its own surface, in which case the friction f-9-orce is that force which is necessary to physically break the asperity.
Besides asperities, another player is often responsible for the creation of friction: loose particles. Particles trapped between two opposing surface during sliding motion often add to the frictional force observed. Although loose particles seem more inclined to be involved in abrasive wear, ploughing one or both surfaces, it is possible for the loose particles to form adhesive bonds with one or both of the surfaces to participate in adhesive friction. Loose particles may come from outside of the system, for example dirt between gears, or may result from the wear of the opposing materials themselves, in which case they may be referred to as trapped wear particles. Keep in mind that the presence of loose particles in sliding motion may be beneficial or detrimental, depending upon what you want to accomplish.
Wear
For many practical applications the importance of wear far exceeds that of friction. It has been estimated that wear is responsible for the obsolescence of goods worth roughly 6% of our GNP[7]. Practically speaking, friction is the cause, and wear is the result.
Wear can be quantified as the volume of material lost for unit of sliding distance. Corresponding to the mechanisms of adhesive and abrasive friction are the concepts of adhesive and abrasive wear. Adhesive wear is defined as the wear of a material which arises from adhesive friction, and abrasive wear is likewise defined. In addition, we are often faced with wear due to surface fatigue, also known as delamination wear, and wear caused by corrosive effects.
Adhesive wear is the topic of much study, because the adhesive model of friction has been the leading tribological theory for some years [8,9]. Adhesive bonds form between two surfaces. The force needed to break these bonds is the adhesive friction force. At times the bond is not broken, and a small amount of material is broken away from the surface. This material is known as a wear particle, and the sum volume of all wear particles formed is the amount of adhesive wear. Figure 1.2 and 1.3 demonstrate this process.
Quantitative laws have been formulated that describe adhesive wear. They are as follows: 1.the amount of wear is generally directly proportional to the load L.
Formation of a fragment according to a soft, copper model ( Greenwood 1957).
Typical Values of Coefficient of Wear k
Table 1.1
Metal (on Metal) Non-Metal (on Metal)
Like Unlike Clean 5 10-3 2 10- 4 5' 10- 6 Poorly lubricated 2 10- 4 2 10-4 5 - 10- 6 Average lubrication 2 10-5 2 10-5 5 10- 6 Excellent lubrication 2 1(-6-10 - 2 10-6-10 - 7 2 10-6 Shear directon Shear drection Figure 1.3. and Tabor, Condition f ~ ~ ~ _ _ . - -=~~- - ~ i ~ ~ Il ~ ~ ~~~~ Il
11-3. the amount of wear is generally inversely proportional to the hardness Hp of the surface being worn away.
V= kL-x
p 1.4
where V is the volume of material worn, L is the applied load, Hp is the indentation hardness of the softer material, and k is a dimensionless constant dependent on the materials and conditions involved in the contact. Combined these three laws give us our first expression for the wear.
Factors generally believed to influence adhesive wear are the hardness of the materials involved and the cleanliness of the contact. It has also been promoted that the surface energy is an important factor, influencing the strength of the asperity junctions and hence the wear rate. The Table 1.1 gives some typical values of the adhesive wear coefficient k for metal on metal and non-metal on non-metal under different sliding conditions..
Abrasive wear
Abrasive wear can be a very important source of wear, as it is often several orders of magnitude larger than adhesive wear. Fortunately it can usually be controlled or virtually eliminated through the judicious use of lubricants. The positive side of abrasive wear is that it is employed in many types of finishing operations.
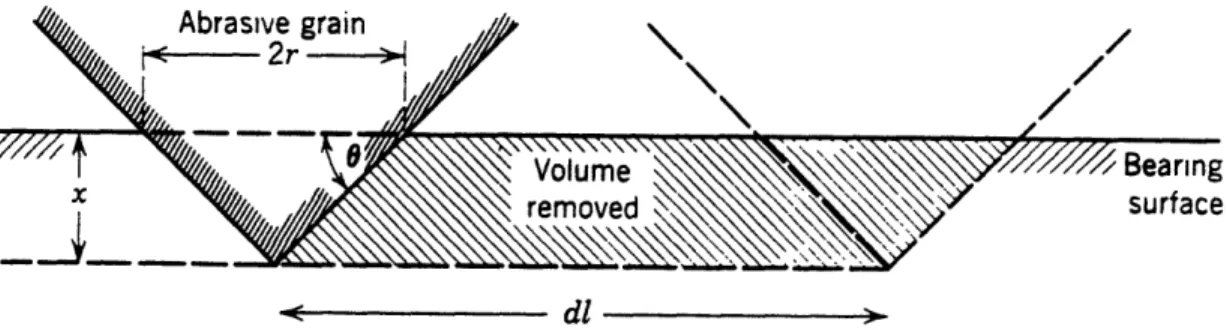
Abrasive wear is the result of abrasive friction. As the asperities of one surface plough into the other surface, the material removed from the ploughed area generally becomes wear particles. These wear particles can in turn plough into one or more of the surfaces, removing more material. Add to that the volume lost due to the asperities that are broken off during contact and you have abrasive wear. Figure 1.4 demonstrates the geometry of abrasive wear.
If we were to define a coefficient of friction k for abrasive wear, we would see that it is indeed much larger than that of adhesive wear. Typical values for kabr are given in Table
1.2.
Factors believed to influence abrasive wear are again hardness and cleanliness of the contact. Also important is the size of the abrasive particles involved in the sliding.
Delamination wear
The other important type of wear is delamination, or surface fatigue wear. This type of wear occurs when the same areas of material are again and again exposed to the load of the contact. Each time the load is applied and released, as in the passing of a series of
Abrasive grain
/ /
X
dl
Figure 1.4. Abrasive wear model depicting removal of material from a surface by a single cone asperity.
Table 1.2.
Investigator
Abrasive Wear Constants kabr
Wear Type Size (u)
Materials
k(X 10-3)
Spurr et al. (1957) Spurr et al. (1957) Avient et al. (1960) Lopa (1956) Kruschov et al. (1958) Samuels (1956) Toporov (1958)
Rabinowicz et al. (1961a) Rabinowicz et al. (1961b) 2-body 2-body 2-body 2-body 2-body 2-body 3-body 3-body 3-body 110 40-150 260 80 70 150 80 40 lMIany
Many
Many
SteelMany
Brass Steel SteelMany
180 150 120 80 24 16 64.5
2 - b [
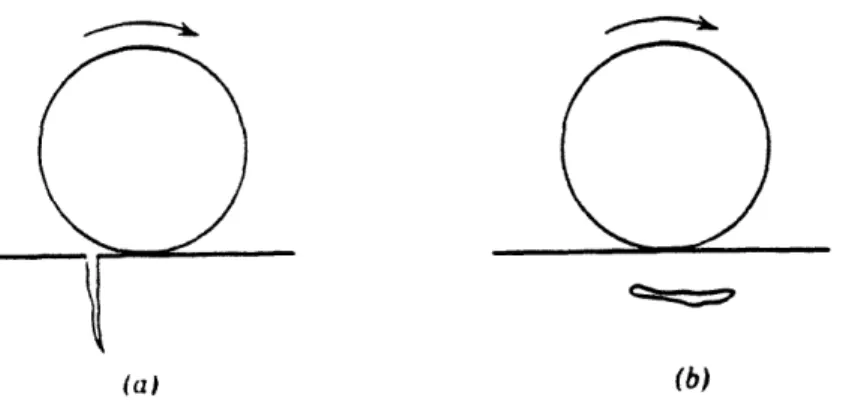
-13-(a) (b)
Appearance of typical surface fatigue failures in their early stages. (a) Surface cracks; (b) subsurface crack.
d
47% max
Figure 1.6 Position of stress maximum for elastic contact and flat (Davies, 1949) Figure 1.5.
asperities, the surface is greatly stressed and unstressed. Small cracks are formed below the surface, where the stress is at its maximum. These cracks grow and link together, until the effectively separate a particle from the rest of the material. These particles, unless removed from the system, become involved in the wear process, either adhesively, abrasively, or as another load bearing agent. The position of the maximum stress and the crack formation are detailed in Figs. 1.5 and 1.6.
There are several characteristics observed to be generally true concerning delamination wear.
1. The particles removed tend to be close to the size of the area under contact, which makes them several orders of magnitude larger than adhesive wear particles.
2. Surface-active lubricants increase delamination wear, as contrast to adhesive wear that is decreased.
3. Delamination wear is dependent on the load, perhaps as the third power on load.
4. Data for delamination wear are subject to a great deal of scatter, perhaps 10 times as much as that of data for adhesive wear.
Many different estimations have been made of the magnitude and relative importance of the various types of friction and wear to the total friction and wear [5,10]. Until it is proven decisively what the true proportions are, it is best to be open to all explanations when conducting experiments.
Adhesive and abrasive friction and wear often go hand in hand, and this complex dual nature of tribology has made the formulation of a complete universal, or even satisfactory theory as yet unattainable. Despite that fact, a large number of experiments, many of a highly practical and practicable nature, have provided a great deal of information.
-
15-2. Methods and Materials
The sliding friction and wear tests were carried out with a rotational pin-on-disc tribometer over the temperature range of 4.2 - 293 K. Materials, sliding velocity, and distance slid were principal variables.
Apparatus
A schematic cross sectional view of the pin-on-disc tribometer [2,3] is presented in Figure 2.1. The test geometry consisted of a rotating specimen disc slid against three hemispherically surfaced specimen pins, symmetrically spaced on a 51-mm bolt circle diameter. The symmetrical spacing of the pins makes the apparatus self-aligning, and permits simultaneous testing of three specimen pins under identical conditions. The apparatus was designed to operate at room temperature in air and at cryogenic temperatures with the specimens immersed in an appropriate cryogenic liquid. Liquid nitrogen was used to achieve and maintain the test temperature of 77K, liquid helium that of 4.2K.
The tribometer is capable of testing sliding velocities in the range between 10-7 to 10'l
m/s. Velocity is controlled through control of the voltage supplied to the DC servo motor, and combination of precision gear reducers. Normal loads are applied through placing weights on the load ring, which transfers the force through a pulley system. The useful range of loads employed was 7.5 N to 22.4 N. During a test the total distance slid was calculated with a rotational mechanical counter coupled to the drive shaft of the
apparatus.
Strain arms prevented the rotation of the outer friction assembly, and thereby measured the friction force. These friction values were continuously monitored by a computer-based data acquisition system. The wear of the pins was determined after each test
through optical measurements of the wear scar diameters. Due to the geometry of the pins, relatively minute amounts of wear can be determined by comparing the wear scar diameter, d, with the pin's radius of curvature, R. It has been shown that the wear
volume, V may be calculated in terms of d and R [ 1 ]:
/rcd4 d 2
2.1
V= 64R (1+ ) 2.1
For our test apparatus R was 3.18 mm, and the wear scars were determined to nearest 25 um, as the average of two orthogonal measurements for each pin.
PIN HOLDER
BE
N
TEF
Schematic cross-section of pin-on-disc tribometer.
-
17-The wear of the discs was determined from the average cross sectional area of the wear path, measured with a profilemeter. The area of the wear track was measured in six distinct places, and averaged. This value was multiplied by the circumference of the wear track to determine the wear volume loss. The profilemeter had a vertical resolution in the range of 10-65 angstroms. Other characteristics of the profilemeter are presented in Appendix A.
Materials
A wide variety of materials were obtained and tested. Table 2.1 presents a listing of the materials tested, both in disc and pin form. It was not the intention of this project to examine all possible combinations of materials, but rather to test certain combinations that were of interest. Below is a brief description of each of the material.
Because it is a unique and relatively untested material, CVD-diamond film was one major focus of the experiments. Natural diamond is also another focus. Since these materials are not as common as steel or copper, and since some of their properties are unique, they are described more thoroughly below.
Stainless steel (AISI 304) is a nominally nonmagnetic, low thermal conductivity alloy. It
was chosen because it is often used in cryogenic applications as a structural material. It was tested in the form of pins and disc.
Steel (AISI 1012) is a hard steel. It was chosen because it is a harder steel than AISI 304.
It was tested in the form of pins and disc.
Copper - 12-hard oxygen-free high-conductivity (OFHC) was tested because of its wide
use in composite superconductors. It is also of interest as a softer metal than the steels tested. It was tested in the form of pins and disc.
Natural Diamond was tested for comparison with the diamond coating. As the hardest
substance it was tested in the form of pins.
Natural diamond is a unique crystalline material with the following extraordinary properties: it is the hardest known substance; the best electrical insulator; and the best thermal conductor [12]. Diamond is a crystalline form of carbon. It is covalently bonded, as pictured in Fig. 2.2. A diamond's thermal conductivity at room temperature is approximately 5 times greater than that of copper. Diamond is also chemically inert, and resistant to high temperatures. The hardness of diamond has long been exploited, but recently its other properties have garnered interest.
Materials tested and hardness values at 293, 77, and 4.2 K.
Pin materials
Steel (AISI 304)
Steel (AISI 1012)
1/2-hard oxygen free high-conductivity (OFHC) copper
Natural Diamond
Chemical Vapor Deposition (CVD) diamond film
Disc materials
Steel (AISI 304)
Steel (AISI 1012)
1/2-hard oxygen free high-conductivity (OFHC) copper
Natural Diamond
Chemical Vapor Deposition (CVD) diamond film
Alumina Oxide Silver
Silicon Nitride
PTFE (Teflon) Table 2.1.
-19-Crystal structure of natural diamond Figure 2.2.
CVD diamond film appears to retain some of the properties of interest of natural diamond.
It takes the form of thin films, lum thick, which are deposited on various substrates. Chemical vapor deposition (CVD) is one of the successful methods of creating diamond film, and is beginning to be used in electronic applications. It is hoped that some of the properties which make it valuable, particularly the heat transfer properties, will find application to cryogenic operations. In disc form, the CVD diamond film is deposited on a silicon substrate wafer. In pin form, it is deposited onto silicon nitride and tungsten carbide ball bearings, which acted as the substrates. The process and techniques of deposition have improved rapidly in recent years which promises to lower the cost and expand the availability of such films, thereby making them more attractive for practical applications. The CVD-diamond coated discs and pins used in this project were provided by Drs. Koji Kobashi and Takeshi Tachibana of Electronics Research Laboratory of Kobe Steel, Ltd (Kobe, Japan).
Alumina (alumina oxide) was chosen as a representative ceramic. Previous research at
cryogenic temperatures had focused on metals. Ceramics are replacing metals to a large degree and there is interest in observing their properties in cryogenic applications. It was tested in the form of ball bearings.
Silicon Nitride, was one of the material that the CVD diamond film was deposited on in
ball form. It was also tested to gain a comparison of its behaviour with that of the diamond film. It was tested in the form of ball bearings as pins.
Tungsten carbide, a hard ceramic, is the other substrate ball with diamond film coating. It
was tested in the form of ball bearings.
Teflon, polytetraflouroethylene, is an inert, semicrystalline polymer. It is often used as electrical insulators, O-rings, and seals at cryogenic temperatures. Teflon is well documented as a solid lubricant, exhibiting low frictional properties at room temperatures. It was tested in the form of pins and disc.
Silicon was the substrate material for the CVD-diamond discs. The uncoated side of the
discs was tested for comparison with CVD-diamond film.
Silver is a soft metal. It was chosen because of its relative chemical incompatibility with
forms of carbon. It is also the most widely used matrix material for high-temperature superconductors.
Table 2.3 presents the materials tested and some of their physical properties. Hardness values at room temperature for most materials are well documented, and in some cases, particularly at cryogenic temperatures, measured by previous researchers on this project [13]. The hardness values for diamond and diamond coatings are from the literature. Hardness values for the ceramic pins are the manufacturers'.
21
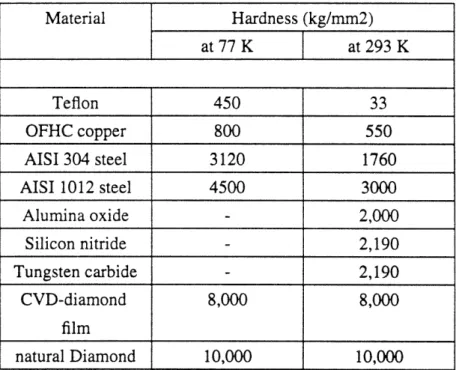
-Table 2.3. Hardness values for materials tested
Material Hardness (kg/mm2) , , at 77 K at 293 K Teflon 450 33 OFHC copper 800 550 AISI 304 steel 3120 1760 AISI 1012 steel 4500 3000 Alumina oxide - 2,000 Silicon nitride - 2,190 Tungsten carbide - 2,190 CVD-diamond 8,000 8,000 film natural Diamond 10,000 10,000
Sample Preparation
The metal discs were machined from stock plate and faced with a single point cutting tool to remove surface irregularities. The discs were abraded with 320-grit paper under running water. This accomplishes two things: the cleaning of the discs; and a consistent surface finish between tests. Water will not wet a surface contaminated with organic contaminants, so the discs were deemed clean when a water layer wetted the testing surface. The discs were then rinsed with methanol, and placed in an oven at 200° C, for
overnight, to bake away any residual contaminants left.
The diamond coating tested was 1-2 um thick. The surface of the diamond coated disc was used as received in order to preserve as much coating as possible. To remove possible organic contaminats from the surface of the disc, each disc was placed in an oven at 200 C for overnight for use the next day.
All of the pins were obtained in the form of 1/4 inch balls. The diamond coated balls were originally silicon nitride or tungsten carbide ball bearings, which were subsequently coated over a small area of contact with the disc through CVD deposition. Three natural diamond pieces, each approximately 1/3 carat of irregular shape were mounted to allow contact with the specimen discs.
Each set of three pins was mounted in a brass ring, wiped clean with a swab soaked in methanol, allowed to air dry, and placed into the apparatus.
Testing
After the materials were placed into the tribometer they were slid against one another at various conditions of temperature, sliding speed, applied load, and distance. The tribometer was housed in a cryostat and the frictional interface was immersed in an appropriate cryogenic liquid to achieve and maintain a desired temperature. Liquid helium was used for 4.2 K, and liquid nitrogen for 77K, respectively boiling temperatures at atmospheric pressure.
Two basic scenarios of testing were generally applied: 1, fixed temperate at a constant load and selected sliding velocities that ranged from 10- to 10-1 m/s, and 2) fixed load and velocity with temperature varying from 4.2 or 77 K to room temperature, as the cryogen was first allowed to "boil away" and then heat entering into the cryostat gradually increased the test sample's temperature. The first is achieved by keeping the frictional interface immersed in the cryogenic liquid. In either case a computer-based data acquisition system records data until testing is completed. As explained above the wear is then determined with a profilemeter.
23
-3. Results and Discussion
Tribological data are often unrepeatable and sometimes inexplicable. The second issue will be dealt with later in the section, the former we must address now. Friction and wear by their very nature are complex creatures. The factors that contribute to a tribological process may be divided into three classifications: those we know, those we don't, and those we can control. The first is finite, the second may not be, and the third is very finite indeed. In experiments involving tribology the conditions of the experiment are particularly crucial. We have done our best to be consistent but often ambient conditions, e.g. room temperature, air humidity, cleanliness of the air, have crept in to make a difference. Add to that the natural variation of the structures and composition of the materials tested and we suddenly have a sometimes large variability in results.
The data gathered will be presented according to three classifications: those interactions involving CVD-diamond film as the disc material; those with natural diamond as the pin material; and those not involving diamond in any way, being primarily concerned with metals.
Results concerning CVD-diamond films
Figure 3.1 is a graph of friction coefficient f vs sliding velocity for the combinations of alumina oxide and natural diamond pins on CVD-diamond film. This figure presents data taken at discrete sliding velocities at our three reference temperatures. The data presented are the arithmetic mean of two trials. The two trials agreed to within 10 % of each other at all points. The applied load was 7.5 N and the distance slid at each velocity was 0.05m. We can see that any dependence the friction has on the sliding velocity is weak. For the alumina oxide pins at 77 K the friction coefficient seems to decrease with velocity, while at 4.2 K the friction coefficient seems to increase with velocity. The friction coefficient seems to have no dependence on sliding velocity at 4.2 K. In both the 77 and 293 K cases the change in the friction coefficient is no greater than 0.05, a change of at most 10%. Regarding the natural diamond pins, the friction coefficient seems to be proportional to the sliding velocity at all three temperatures tested. Again the change in friction coefficient in any case is no greater than 0.05, but this represents a potential change of up to 50% . These results are not surprising in light of the 3rd quantitative law of friction. The 3rd law states that friction is independent of sliding velocity. The weak dependence may be explained as a result of the dependence of the strength of some materials to the rate of application of the stress. This dependence of strength on rate of stress is small, but can account for a weak dependence of the friction on the sliding velocity.
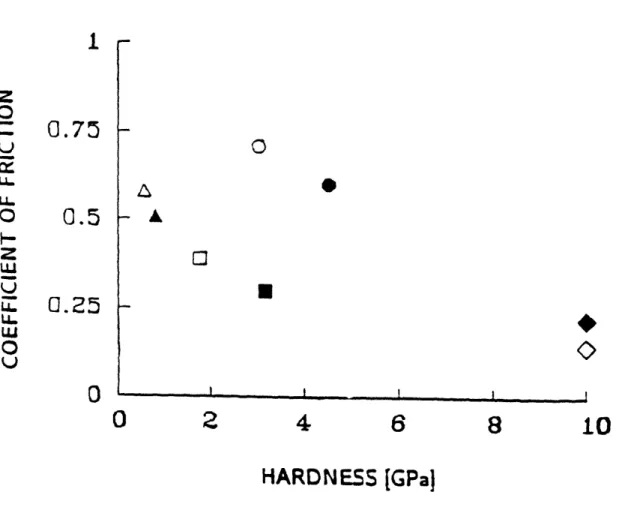
Figure 3.2 shows friction vs hardness data for various material pins slid against CVD-diamond coated discs. The pin materials are AISI 1012 (circles), AISI 304 (squares), OFHC copper (triangles), and natural diamond (diamond). The applied load for this test is 7.5 N, the sliding velocity is 104 m/s, and the distance slid was 3.2m.
0.4
0.2
n
U
10-
7106
10-5
10-
410-3
10-2
10-1
SLIDING VELOCITY [m/Is]
Figure 3.1. p vs v plots for CVD-diamond discs against pins of: alumina oxide (open points) and natural diamond (closed points) at 4.2 K (circles), 77 K (squares), and 293 K (triangles).
z
0
mv
UA.0
z
L)O
LL }-U.'0
U25
-Figure 3.2 shows that although there does not seem to be a direct overall correlation between friction and hardness between materials tested, there does seem to be an inverse relationship between friction and hardness for a particular material. Notice that, except for the case of natural diamond, the friction coefficient was lower when tested at 77 K than at 293 K. Because the hardness of these materials increases with a decrease in temperature, this corresponds to friction being inversely proportional to hardness, for each particular material. It should be noted here that due to the extreme difficulty of making a hardness measurement on diamond, the hardness value used was based on those values reported in the literature [12,14]. Also, it is assumed that the change in temperature from 293 to 77 K has no effect on the hardness of the natural diamond. We have seen there seems to be no overall dependence of friction on hardness between the materials tested. That is not surprising: if hardness were all there were to predicting friction, a complete theory would exist. The genesis of friction is a complex affair, of which hardness can have but a part. Yet the dependence of friction coefficient upon hardness of material for any particular material suggests that the part hardness has to play is not insignificant. For all materials tested, with natural diamond as the exception, the friction coefficient decreases with decrease in temperature. As one of the major results of lowering in temperature is an increase in hardness this could be interpreted as a dependence of p on the hardness of the pin. This can be explained by the changes in the amount of subsurface deformation occurring. As the surface grows harder, the asperities are not able to penetrate as deeply, thereby reducing the force necessary to drag them along. Also as the material becomes harder, ie. the intermolcular bonds become stronger, the adhesive bonds between surfaces become weaker.
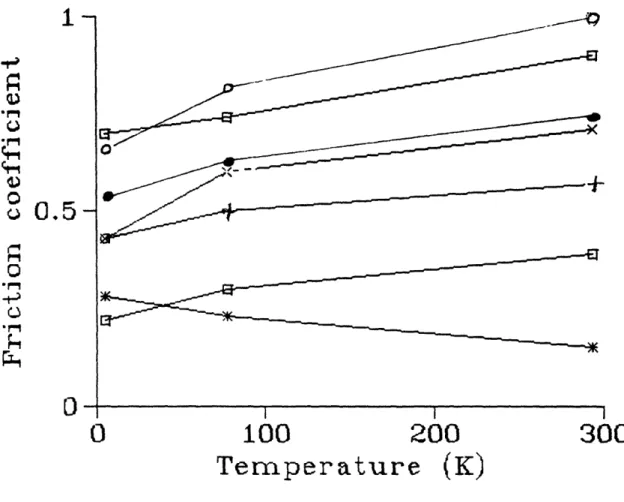
Figure 3.3 shows friction coefficient versus temperature plots for several materials slid against CVD-diamond film. We have AISI 1012 (circles), AISI 304 (squares), OFHC copper (triangles), natural diamond (diamond), alumina oxide (filled squares), tungsten carbide (filled circles2, and silicon nitride (filled triangles). The applied load is 7.5 N, the sliding speed is 10- m/s, and the sliding distance is 20 cycles (3.2m). The traces shown are based on the data from our three discrete reference points: 4.2 K; 77 K; 293 K. Data were actually taken at 5 K intervals starting from 4.2K, but figure 3.3 presents the three reference points only in the interests of visual clarity. Graphs showing each individual trace in greater detail are presented in Appendix B.
From figure 3.3 we see that there is a general trend of friction decreasing with temperature. All materials, except natural diamond, when slid against CVD-diamond film exhibit successive lower friction coefficients as temperature decreases to 4.2 K. Natural diamond is the exception; it showed a decrease in friction coefficient from 4.2 to 293 K. Our initial explanation of these results is to say the hardness of these materials increased inversely with temperature thereby precipitating a decrease in friction. The behavior of the metals supports this theory, and agrees with results from previous studies [15,16]. What is interesting to note is the behavior of the ceramics and of natural diamond. The ceramics exhibited the highest coefficients of friction. Each of the ceramics is a relatively hard material, so we might have expected low coefficients of friction. A possible explanation for the high friction is the ceramics' greater similarity to the diamond film.
4
I
z
Z
2U-u
o
.5
z
LU*;
0.25
LL U-LU 0.Z
t.J~tn
0
a
.... I .! I I I0
2
4
6
8
10
HARDNESS [GPaIFigure 3.2. g vs hardness (Hp) plots CVD-diamond discs against pins of AISI 1012 steel (circles); AISI 304 stainless steel (squares); OFHC copper (triangles); and natural diamond (diamond). Open data: 293 K; closed data: 77 K.
-27-C
o
0.5-A
0
o *,,~.f.0
0 -
IaI i I0
100
200
300
Temperature
(K)
Figure 3.3. x vs T plots for CVD-diamond film against pins of AISI 1012 steel (x-marks); AISI 304 stainless steel (open squares); OFHC copper (plus); natural diamond (star); alumina oxide (filled circle); tungsten carbide (open circle); and silicon nitride (filled square).
-JI
0
There is evidence that structural and chemical similarity and compatibility leads to more severe frictional behavior [17]. But natural diamond should be most compatible, yet it has very low friction. While we might expect a low friction coefficient due to its high hardness, we would expect adhesion between the diamond film and diamond to be strong which would provide for a high friction coefficient. Another possible explanation is the formation of wear particles. The ceramics are more brittle than the metals and may be more likely to create wear particles than either the metals or natural diamond. These particles become trapped, and increase the friction greatly. The metals are more likely to shear and natural diamond is worn very little by the CVD-diamond film, entailing less wear particles becoming trapped at the friction interface.
Figure 3.4 shows the wear of the material pins sliding against the CVD-diamond coated discs. Again we have AISI 1012 (circles), AISI 304 (squares), OFHC copper (triangles), and Teflon (diamond). The applied load is 7.5 N, the sliding velocity is 10-4 m/s, and the
sliding distance is 3.2 m. The wear is quantified by the dimensionless wear coefficient k, as defined in eq 1.1. Here we provide a more explicit definition for kw.
kw= pp 3.1
LX
where Vp is the wear volume of the pin [m3], Hp is the hardness of the pin [kg/m2], L is the applied load [kg], and X is the distance slid [m].
The graph shows a strong relationship between hardness of the pin and the wear of the pin for three of the materials. Teflon, AISI 304, and AISI 1012 all show a positive correlation between the wear coefficient and hardness. Between the three there seems to be a good correlation between their respective hardnesses and wear coefficients. Based on the values for PTFE, AISI 304, and AISI 1012 the wear coefficient appears to vary as
Hp. OFHC copper on the other hand exhibits an inverse relationship between wear
coefficient and hardness. Overall the materials besides OFHC copper show the expected behaviour- wear decreasing with hardness.
The behavior of teflon is perhaps the easiest to explain. Teflon normally exhibits very low friction properties because it is easily sheared and often a layer of the teflon is attached to the opposing surface. After transferral the friction between the teflon surfaces is quite low, and after the initial transferral of material, the wear is correspondingly low. It is for these reasons that Teflon is a favored solid lubricant. As the hardness increases in Teflon, it loses its ability to shear so easily, and the usual friction and wear lowering mechanisms begin to fail. Hence, an increased amount of wear at an increased hardness. The behavior of the AISI 304 and 1012 is also something we might have anticipated, and is explained by the change in the amount of asperity penetration and subsurface deformation. As these materials grow harder the opposing asperities cannot penetrate so deeply, hence less material is removed through ploughing. Further, harder material are more resistant to sub-surface deformation, which results in less wear.
-29-A I I I I I 10
30
100
a I 1 I i0 3 I I 1 110300 1000 3000 10000
Hardness (kg/mm2)
Figure 3.4. kw vs hardness (Hp) plots for CVD-diamond coated discs against pins of AISI 1012 (circles); AISI 304 (squares); Teflon (diamonds); and OFHC copper (triangles). Open data: 293 K; closed data: 77 K.
1
0.1
0.01
-I nn10
c) C.)n
W.. Li L .LO.0001
10
_I ___The results of OFHC copper are less straightforward. First of all, it shows an increase in wear coefficient as it becomes harder. Secondly it does not fall on the "wear coefficient-hardness" line that the other materials seemed to define. However, it does not fall too far from the line, and the change in wear coefficient between the 77 K and the 293 K value is not very great. Keeping in mind that tribological data are subject to a good deal of scatter, perhaps we should not be too dismayed with OFHC copper data. In any case the relationship between hardness and wear coefficient should be further examined, and in the case of OFHC copper other fundamental properties, elastic modulus for example, should be examined for their effect of the wear rate.
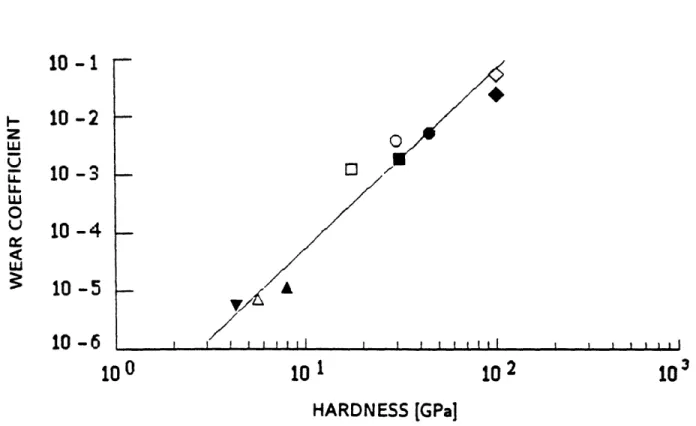
Figure 3.5 represents the wear of the CVD-diamond coated disc vs the hardness of the pin. The pin materials tested are again AISI 1012 (circles), AISI 304 (squares), OFHC copper (triangles), and natural diamond (diamond), with the addition of Teflon (inverted triangles). Again the applied load is 7.5 N, the sliding velocity is 10 4m/s, and the sliding
distance is 20 cycles or 3.2 m.
In this graph we define a slightly modified wear coefficient, kd. The coefficient kd differs from kw in that V, the wear volume of the material and Hp the hardness of the material are not referring to the same material. Vd is the volume worn of the disc and Hp is the hardness of the pin.
VdHp
kd= LX 3.2
Figure 3.5 shows a very good correlation between wear and hardness, both pertaining to a particular material, and between various materials. Notice that in all cases, except natural diamond, the wear of the disc increased proportionally with the hardness of the pin. This effect seems to be a result of the larger correlation between hardness of the pin and wear of the disc. The harder the material of the pin the greater the wear of the disc. This makes sense intuitively: as the pin grows harder and is more resistant to wear, more wear occurs on the CVD-diamond film surface. More formally we say the harder the pin is, the more resistant to penetration and subsurface deformation it becomes. Further, the more resistant it becomes the more it is able to inflict subsurface deformation upon the CVD-diamond film.
Results on Natural Diamond
The following results concern natural diamond as a pin material sliding upon other materials. Figure 3.6 gives average summary traces of friction coefficient vs temperature for natural diamond on other materials. The disc materials tested were AISI 304 (squares), OFHC copper (circles), silver (plus), CVD-diamond film (diamond), and the silicon substrate (star) upon which the CVD-diamond film was deposited. The traces shown are averaged values between the complete trials of each material combination.
0
[
A I I t I IIIt 10 2 HARDNESS [GPajFigure 3.5. kd vs Hp data for CVD-diamond discs against pins of AISI 1012 steel (circles); AISI 304 stainless steel (squares); natural diamonds (diamonds); OFHC copper (up triangles); and teflon (down triangles). Open data: 293 K; closed data: 77 K.
-31-10 -1
z
LL LU0
U. U0
LJ 10 -2 10 -310 -4
10 -5
10 -6
10 0 10 I I , I I I lI 103_
0
-e 00
100
200
300
Temperature
(K)
Figure 3.6. At vs T plots for natural diamond pins against discs of AISI 304 stainless steel (squares); OFHC copper (open circle); silicon substrate (filled circle); silver (star); and CVD-diamond film (x-mark).
"?-4
0
U
-33-From the graph we see that diamond exhibits both a positive and an inverse relationship between friction and temperature, depending upon the material it is paired with. Natural diamond is positively proportional to temperature when slid upon AISI 304, OFHC copper, and silver, but inversely proportional to temperature when slid upon CVD-diamond film and the silicon substrate. Generally we expect to see friction coefficient increase with temperature, so the results with CVD-diamond film and the silicon substrate are somewhat unexpected. Here we must state that the measurement of the hardness of both the natural diamond and the diamond film was beyond the scope of this research. Further, there are no data on the effect of cryogenic temperatures on the hardness values of these materials. It is assumed that the hardness is temperature independent over the range of interest. I believe that in the case of these two materials hardness is not the controlling factor, but perhaps some other temperature defendant physical parameter plays a more significant role.
What is more interesting about the CVD-diamond film and silicon substrate results is that the friction coefficient is low. For the silicon substrate it may be explained as the silicon substrate giving way very easily to the very hard natural diamond pin, thereby entailing a low friction coefficient. But that would not be the case for the CVD-diamond film, which is assumed to have a significant hardness level. But adhesion theory would tell us two such like materials would produce very strong adhesive bonds, leading to a high friction coefficient. Perhaps for diamond, which requires a very high temperature and pressure to be crystallized, "adhesion" as it is understood in tribology does not occur at ordinary temperatures.
Another unexpected finding is that OFHC copper would exhibit the largest coefficient of friction when paired with natural diamond. We have seen that metals tend to follow an inverse hardness-friction coefficient relationship. Based on that relationship, we would expect AISI 304 to have the highest friction coefficient, followed by OFHC copper, and then silver. We see that this is not the case, and must believe some other parameter besides hardness is the controlling factor for the friction of a material paired with natural diamond.
Other Results
Table 3.1 summarizes the remaining tests run. The main thrust of these results is that for these materials there seems to be a good correlation between hardness and tribological properties.. This would lead us to believe that in these cases the friction and wear are proportional to one another. Notice also that OFHC and AISI 304 when paired with themselves exhibit moderately high friction and wear. These results add some support to the claim of adhesion theory that compatibility of surfaces leads to strong adhesive bonds, and correspondingly high friction and wear. Teflon when paired with itself does not exhibit this behaviour at all, which illustrates its value as a solid lubricant. Notice that the friction and wear of teflon paired with OFHC copper is higher than that of teflon on teflon, yet it is still very mild.
Table 3. 1. Friction and wear coefficients for miscellaneous tests
raterials Temperature friction coef. kd kw
(K) u (disc) (pins) OFHC on 293 .67 +0.02 3.3 x 10⁻² 3.8 x 10⁻² OFHC 77 0.58 +0.02 4.28 x 10⁻² 4.8 x 10⁻² AISI 304 293 0.53 +0.02 2.7 x 10⁻² 4.6 x 10⁻² on 304 77 0.45 +0.03 4.1 x 10⁻² 4.5 x 10⁻² Teflonon 293 0.13 +0.02 9.9 x 10⁻⁸ 8.1 x 10⁻⁸ Teflon 77 0.09 +0.03 6.5 x 10⁻⁷ 5.8 x 10⁻⁷ OFHC on 293 (0.43 +0.02) 1.9 x 10 -5 7.1 x 10⁻⁸ Teflon 0.13 +0.02
35
-Conclusions
As with the results and discussion, the conclusions drawn are separated according to the testing classifications.
CVD-diamond film
1) friction is generally independent of sliding velocity. Our data have clearly shows that the friction is at best weakly dependent upon the sliding velocity, and can either increase or decrease with velocity depending upon the materials in question.
2) friction is dependent upon hardness only for different hardness values of the same metal, but not between materials tested. The friction decreased for material combinations with hardness. There is no overall correlation between friction and hardness among materials.
3) friction generally increases with temperature for most materials. The exception is natural diamond.
4) wear of pin is proportional to hardness of pin. This relationship holds both for any particular material and among materials.
5) wear of disc is proportional to the third power of the hardness of pin. Natural diamond tests
1) friction can be both inverse and positive with temperature. Metals tested tend to have a positive relationship, non-metals tested an inverse.
Other tests
1) friction and wear are inverse with temperature, due to hardness change. Like materials tend to exhibit relatively high friction and wear.
The complex interactions that make up tribology do not allow for strict repeatability. An agreement to within 30% between trials is often acceptable. While they may serve as a guideline for similar situations, the preceding results are not definitive, and the best way to be certain about the tribological behavior of a situation you must face is to examine and test it yourself.
References
[1] Y. Iwasa, R. Kensley, and J.E.C Williams, "Frictional Properties of metal-insulator interfaces," IEEE Trans. Mag. MAG-15, 36-39 (1979).
[2] R.S. Kensley and Y. Iwasa, "Frictional Properties of metal insulator surfaces at cryogenic temperatures,", Cryogenics 20, 25-36 (1980).
[3] R.S. Kensley, H. Maeda, and Y. Iwasa, "Transient slip behavior of metal/insulator pairs at 4.2 K," Cryogenics 21, 479-489 (1981).
[4] P.C. Michael, E. Rabinowicz, and Y. Iwasa, "Reassessment of cryotribological theory," Wear 174, 163-168 (1994).
[5] E. Rabinowicz, Friction and Wear of Materials, (John Wiley, New York, 1965). [6] E. Rabinowicz, "Autocorrelation analysis of the sliding process," J. Appl. Phys. 27, 131-135 (1956).
[7] E. Rabinowicz, personal communication.
[8] Bowden, F.P., and D. Tabor, The Friction and Lubrication of Solids, Pt. I, (Clarendon Press, Oxford, 1964).
[9] Bowden, F.P., and D. Tabor, The Friction and Lubrication of Solids, Pt. II, (Clarendon Press, Oxford, 1964).
[10] N.P. Suh, Tribophysics, (Prentice-Hill, Inc, New Jersey, 1986)
[11] Lancaster, J.K., Friction and wear, Ch. 14 in Polymer Science, Ed. Jenkins, A.D., (North-Holland Publishing, Amsterdam, 1972).
[12] Physical Properties of Diamond, Ed. R. Berman, (Clarendon Press, Oxford, 1965).
[13] P.C. Michael, "Cryotribological investigation of sliding motion emphasizing mechanical behaviors of high-performance superconducting magnets," (Ph.D. thesis, Mechanical Engineering Department, MIT, 1992; unpublished).
[14] Diamond Films and Coatings, Ed. R.F. Davis, (Noyes Publications, New Jersey,
1993).
[15] F.P. Bowden and G.W. Rowe, "The friction and deformation of clean metals at very low temperatures," Proc. Roy. Soc. A 312, 451-466 (1969).
37
-[16] Coffin, L.F., "Some metallurgical aspects of friction and wear," Friction and Wear:
Proc. Symp. on Friction and Wear, Detroit, 1957 (Elsevier, New York, 1959).
[17] E. Rabinowicz, "Determination of Compatibility of Metals through Static Friction Test," ASLE Transactions, 14, 198-205 (1971).
Appendix A
Appendix A contains the technical specifications of the stylus profilemeter used to measure the wear of the discs after testing. The model used was a DekTak 8000, and the specifications are those provided by the manufacturer.
-39-TECHNICAL SPECIFICATIONS
Vertical Range: 100ooA to 655 KA (0.4 microinch to 2.5 mils) Vertical Resolution: 10 Angstroms
Scan Length Range: 50 microns to 30mm (2 mils to 1.2 inches)
Scan Speed Ranges: Low, Medium, High
Scan Time Range: 3 seconds to 50 seconds
Software Leveling: Two-point programmable or cursor leveling
Stage Leveling Manual
Stylus (standard): Diamond, 12.5 micron radius Stylus Tracking Force: Adjustable. 10mg to 50mg
(0.1 milliNewton to 0.4 milliNewton) Maximum Sample Thickness: 20mm (0.75 inches)
Sample Stage Diameter. 127mm (5 inches)
rar,_. ~'agc Translation: X Axis, =10mm (±0.4 inches)
(r5 , nt:re ,c Y Axis, + 10mm, -70mm (+0.4, -2.8 inches) Sample Stage Rotati,,,.: 360° continuous
Maximum Sample Weight: 0.5Kg (1 lb)
Power Requirements: 100/115/200Vac :10%, 50-60Hz, 200Vac
Warm-up Time: 15 minutes recommended for maximum
stability Operating Temperature: 21 C, 3aC
(70 F, 5 F)
Zoom Magnification: 35X to 200x
Camera: Solid state monochrome video image
Sample Illumination: Variable intensity white light; IR & UV blocked Dimensions: Scan Head 26cmW x 36cmD x 51lcmH (10"W x 14"D x 20"H) Computer 41cmW x 41cmD x 15cmH (16"W x 16"D x 6"H)
Appendix B
Appendix B contains individual traces of friction vs temperature for some of the material combinations tested. The results of these tests were summarized in the Results and Discussion section, but are presented here to afford greater detail of the friction behavior observed.
-41-0.7
p4j0
0
f." .- ,0.5
g vs temperature for alumina oxide on CVD-diamond film.
0
100
200
Temperature
(K)
300
100
200
Temperature
300
(K)
p vs temperature for silicon nitride on CVD-diamond film.
0.
-.0
o4)0
0
0
.Pm4 Srq0A.B-
0.7-
0.6-
0.5-
0.4-0.3
0
-
---D-I Figure A.2Institute Archives and Special Collections Room 14N-118
The Libraries
Massachusetts Institute of Technology Cambridge, Massachusetts 02139-4307
This is the most complete text of the thesis
available. The following page(s) were not included
in the copy of the thesis deposited in the Institute
Archives by the author:
Y
if
1N M
0.4-0
. -" ,1" q--,9
0.3
-0
-0
n
-0
-,0
.,---'~
0.1-0-
I I IFigure A.4 g vs temperature forAISI 304 stainless steel on CVD-diamond film.
0
100
200
300
Temperature
(K)
*-I-41
1
-To -4Q U. 19-
O.B-0
§0
8-
0.6-0.5
I I ip vs temperature for tungsten carbide on CVD-diamond film.
-45-0
100
200
300
Temperature
(K)
n
U.0
-
0.7-0
.r-4je-
I,-,0.6-0
0
g
0.5-0
0
·
n
4l0.3
-,u vs temperature for natural diamond on OFHC copper.
0
100
200
300
Temperature
(K)
- r
i~I
-47-n
n
U . U-,
0.7-.1-4 U .-r-"-4I0.6-
©
0
10.5-0
0
. 0.4-c-40.3
I I I,u vs temperature for natural diamond on silver.
0
100
200
300
Temperature
(K)
in I
· 0.15
HU
4)0
o 0.1
4-40
t
0.D5
0~
0
p vs temperature for natural diamond on silicon.
0
100
200
300
Temperature
(K)
-49-100
100
200
300
Temperature
(K)
vs temperature for natural diamond on AISI 1012 steel.
.0
0
0
-0
0
0.4-
0.3-
0.1-0
0
· I . .rdr
I Figure A.9 ^ MU.
I
0.8
0.6
0.4
0
2
0
Figure A. 11 u vs temperature for OFHC copper on AISI 1012 steel.
4)