THE CRUSTAL STRUCTURE AND SUBSIDENCE HISTORY of
ASEISMIC RIDGES AND MID-PLATE ISLAND CHAINS
by
ROBERT SHERMAN DETRICK, JR. B. S., Lehigh University
(1971)
M. S. University of California, San Diego Scripps Institution of Oceanography
(1974)
SUBMITTED IN PARTIAL FULFILLMENT OF THE REQUIREMENTS FOR THE
DEGREE OF DOCTOR OF PHILOSOPHY
at the
MASSACHUSETTS INSTITUTE OF TECHNOLOGY
©
and theWOODS HOLE OCEANOGRAPHIC INSTITUTION September, 1978
Signature of Author
Joint Program in Oceanography, Massachusetts Institute of Technology-Woods Hole Oceanographic Institution, and the Department of Earth and Planetary Sciences, Massachusetts Institute of Technology, June, 1978
Certified by
Thesis Supervis~ro
Accepted by
Chairman, Joint Oceanography Committee in the Earth Sciences, Massachusetts Institute of Technology-Woods Hole Oceanographic
Institution
WSTHT
, TS INSTITUTEF
fft NOLOGYLIBRARIES 1__I_____I__ _I1LiI_--I--Y~IY-Y_~III-I _.~11 I
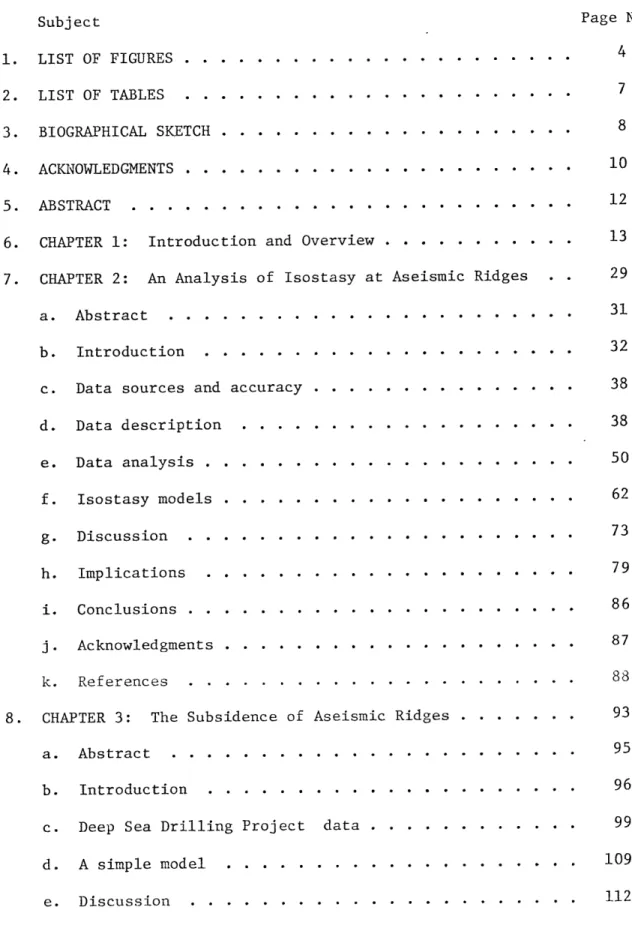
TABLE OF CONTENTS Subject i. LIST OF FIGURES . . . Page No.
4
.
1
2. LIST OF TABLES . . . . . . . . . . . . 3. BIOGRAPHICAL SKETCH . . . . . . . . . . 4. ACKNOWLEDGMENTS . . . . . . . . . . . 5. ABSTRACT . . . . . . . . . .6. CHAPTER 1: Introduction and Overview
7. CHAPTER 2: An Analysis of Isostasy at
a. Abstract
b. Introduction . . . . . . . . . .
c. Data sources and accuracy .
d. Data description . . . . . . . . e. Data analysis . . . . . . . . . . f. Isostasy models . . . . . . . . . g. Discussion . . . . . . . . . . . h. Implications . . . . . . . . . . i. Conclusions . . . . . . . . . . . j. Acknowledgments . . . . . . . . . k. References . . . . . . . . . . .
8. CHAPTER 3: The Subsidence of Aseismic
a. Abstract . . . . . . . . . . . .
b. Introduction . . . . . . . . . .
c. Deep Sea Drilling Project data .
d. A simple model . . . . . . . . . e. Discussion . . . . . . . Aseismic Rides . . . . . * . . . . . . . . * . * * * * * * * . . . . Ridges . . - * * . . . . . . . . . . . . * * Ridges * * * . . . . . . * * * . . . * * . * * * * * * . . . * * * - * * . . . * * . . . . . . . 7 8 10 12 13 29 31 32 38 38 50 62 73 79 86 87 88 93 95 96 99 109 112
Subject
f. Comparison with oceanic plateaus and island chains .
g. Conclusions . . . . . . . . . . . . . . . . .
h. Acknowledgments . . . . . . . . . . . . . . . i. References . . . . . . . . . . . . . . . . . . 9. CHAPTER 4: Island Subsidence, Hot Spots and
Lithospheric Thinning . . . . . . . . a. Abstract . . . . . . . . . . . . . . . . . . . b. Introduction to the problem . . . . . . . . . c. Possible mechanisms . . . . . . . . . . . . . d. Origin of the Hawaiian swell . . . . . . . . . e. Discussion . . . . . . . . . . . . . . . . . . f. Implications . . . . . . . . . . . . . . . . . g. Conclusions . . . . . . . . . . . . . . . . . h. Acknowledgments . . . . . . . . . . . . . . . i. References . . . . . . . . . . . . . . . . . . 10. APPENDIX A: Applying transfer function techniques gravity data--theory and method . . . a. Introduction . . . . . . . . . . . . . . . . . b. Theory . . . . . . . . . . . . . . . . . . . . c. Method . . . . . . . . . . . . . . . . . . . . d. Admittance models . . . . . . . . . . . . . . e. Summary . . . . . . . . . . . . . . . . . . . f. References . . . . . . . . . . . . . . . . . . Page No. 117 . . . . 118 . . . 119 . . . . 120 marine 124 126 127 134 140 153 157 159 160 161 165 166 166 168 172 180 181
LIST OF FIGURES
Page No.
CHAPTER 1
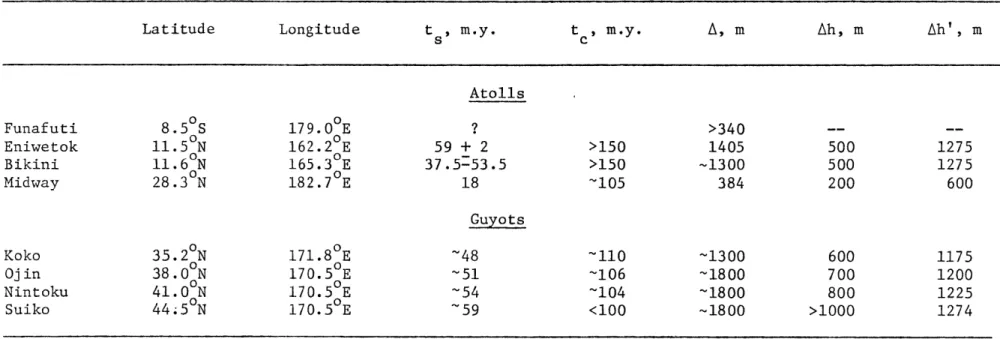
1. Location of several prominent aseismic ridges and
mid-plate island chains . ... ... . . . 16
CHAPTER 2
1. Summary of published seismic refraction data from aseismic
ridges ... ... . . 34
2. Location of free-air gravity anomaly and bathymetry profiles
across the Ninetyeast Ridge used in this study . ... 41
3. Projected free-air gravity anomaly and bathymetry profiles
across the Ninetyeast Ridge . ... 44
4. Location of free-air gravity anomaly and bathymetry profiles
across the Walvis Ridge used in this study . . . ... 47
5. Projected free-air gravity anomaly and bathymetry profiles
across the Walvis Ridge . ... ... . 49
6. Coherence, log1 0 admittance amplitude, admittance phase
and filter calculated for Ninetyeast Ridge . ... . . 54
7. Coherence, log1 0 admittance amplitude, admittance phase
and filter calculated for Walvis Ridge . ... 56
8. "Observed" bathymetry, filtered bathymetry, "observed"
gravity and difference gravity for Ninetyeast Ridge profiles 59
9. "Observed" bathymetry, filtered bathymetry, "observed"
gravity and difference gravity for Walvis Ridge profiles . 61
10. Observed admittance values for Ninetyeast Ridge
super-imposed on theoretical admittance curves for Airy and
plate models of compensation . ... ... . 67
11. Observed admittance values for Walvis Ridge
super-imposed on theoretical admittance curves for Airy and
plate models of compensation . ... 69
12. Comparison of gravity effect for simple Airy crustal
model using line integral method and Fourier method .... 72
13. "Observed" and calculated gravity for two Walvis Ridge
Page No.
14. Comparison of isostatic response functions for the
Ninetyeast and Walvis Ridges and the
Hawaiian-Emperor seamount chain . ... 78
15. Comparison of gravity anomalies calculated with
filters from the Hawaiian-Emperor seamount chain
and the South Atlantic . .... ... . . 82
CHAPTER 3
1. Location of aseismic ridges and Deep Sea Drilling
Project sites discussed in this study . ... 98
2. Isostatically adjusted basement depth plotted against
age for several aseismic ridges . ... 105
3. Simple model which can account for the observed
subsidence of many aseismic ridges . ... 111
4. Expected subsidence curve for Iceland-Faeroe Ridge . . . . 116
CHAPTER 4
1. Location of drilled western Pacific atolls and guyots
used in this study . ... . 129
2. Subsidence history of three western Pacific atolls that
have been drilled . ... ... .. . 132
3. Bathymetric and gravity profile across the Hawaiian
Ridge near Oahu showing Hawaiian. swell, moat and arch . 139
4. Asthenospheric bump model and lithospheric thinning model
for origin of Hawaiian swell . ... ... .. 143
5. Ratio of free-air gravity anomaly and topography versus
half wavelength of surface topography . ... 147
6. Depth of the crest of the Hawaiian swell plotted against
age along the Hawaiian-Emperor chain . ... . . 152
7. Predicted subsidence history of Eniwetok assuming a
6
Page No. APPENDIX A
1. Illustration of smoothing effect of averaging spectra
from many profiles . ... . . . . . . . .. 171
LIST OF TABLES
Page No. CHAPTER 2
1. Summary of navigation and instrumentation . . . . . . . . . 39
2. Summary of parameters assumed in model computations . . .. 64
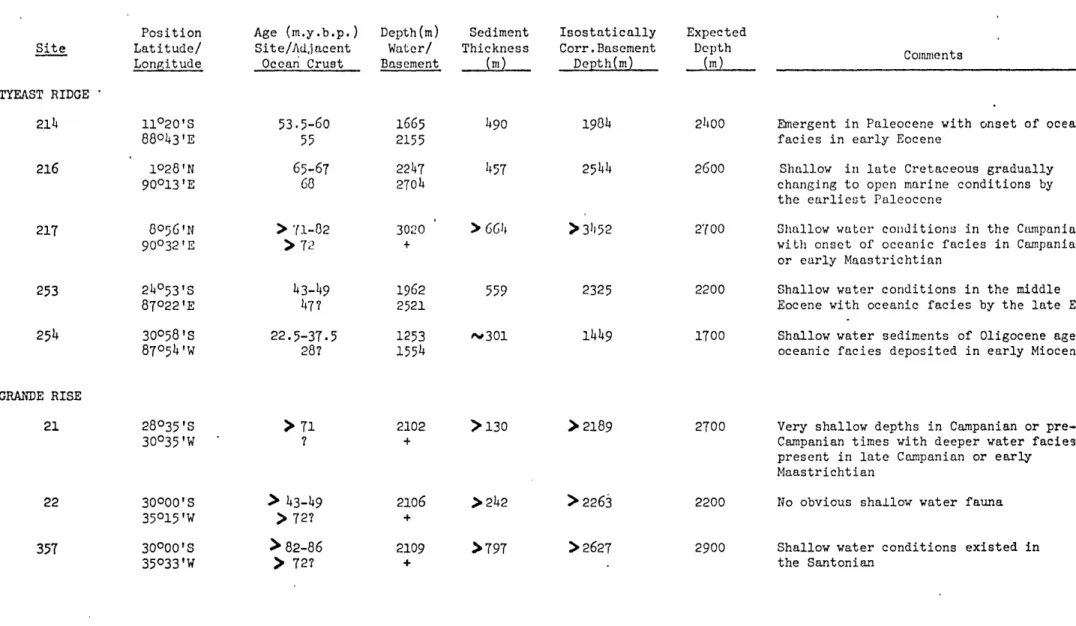
CHAPTER 3
Apparent and expected subsidence at DSDP drilling sites on
aseismic ridges ... . ... 100
CHAPTER 4
BIOGRAPHICAL SKETCH
I was born in Pittsburgh, Pennsylvania, on-November 19, 1949. I attended Lehigh University (Bethlehem, Pennsylvania) from 1967-1971
and was graduated in June, 1971, with a Bachelor of Science Degree in physics and geology, awarded with highest honors. My introduction to marine geology and geophysics came in 1970, when I was a summer fellow
at Woods Hole Oceanographic Institution, working with Dr. Carl Bowin. In September, 1971, I enrolled at the Scripps Institution of Oceanography
(La Jolla, California). While there I worked with the Scripps deep tow group, participating in surveys of the Galapagos Spreading Center
(1972) and the Mid-Atlantic Ridge (FAMOUS area, 1973). After receiving
my Master of Science Degree in June, 1974, I worked for one year as an exploration geophysicist with Standard Oil Company of California in San Francisco.
In the fall of 1975 I entered the MIT-WHOI Joint Program in
Oceanography. Since then my work has concentrated on using gravity and seismic refraction techniques to investigate the crustal structure of -anomalous sea floor features such as aseismic ridges and fracture zones.
I am presently a post-doctoral research investigator in the Depart-ment of Geology and Geophysics, Woods Hole Oceanographic Institution.
My publications include:
1. Detrick, R. S., and A. B. Watts, Isostasy in the World's Oceans;
Part 3 Aseismic Ridges, submitted to J. Geophys. Res., 1978. 2. Detrick, R. S., and S. T. Crough, Island subsidence, hot spots and
3. Detrick, R. S., J. G. Sclater and J. Thiede, The subsidence of aseismic ridges, Earth Planet. Sci. Lett., 34, 185-196, 1977.
4. Detrick, R. S., and W. S. Lynn, The origin of high-amplitude magnetic anomalies at the intersection of the Juan de Fuca Ridge
and Blanco fracture zone, Earth Planet. Sci. Lett., 26, 105-113, 1975.
5. Detrick, R. S., D. L. Williams, J. D. Mudie and J. G. Sclater,
The Galapagos spreading center: Bottom water temperatures and the Ot
significance of geothermal heating, Geophys. J. R. Astr. Soc., 38, 627-637, 1974.
6. Detrick, R. S., J. D. Mudie, B. P. Luyendyk and K. C.,Macdonald, Near-bottom observations of an active transform fault (MAR 370N), Nature Phys. Sci., 246, 59-61, 1973.
7. Purdy, G. M.,and R. S. Detrick, A seismic refraction experiment in
aP
the central Banda Sea, J. Geophys. Res., in press, 1978.
8. Sclater, J. G., and R. S. Detrick, Elevation of mid-ocean ridges
and the basement ages of JOIDES Deep Sea Drilling Sites, Geol. Soc. S
ACKNOWLEDGMENTS
Since this thesis is a collection of three co-authored papers, I first want to acknowledge the contributions my co-authors have made to this research. John Sclater suggested I use Deep Sea Drilling results to examine the subsidence history of aseismic ridges and provided the initial encouragement I needed to begin this project. Jorn Thiede contributed his insight into the subsidence history of the Rio Grande Rise. These results, included here in Chapter 3, have been published
in Earth and Planetary Science Letters, 34, 185-196, 1977. The work
reported in Chapter 4 grew out of a student seminar I presented in October, 1976. I had discussed available data on island subsidence
and shown that islands formed on old sea floor were subsiding much faster than expected. Tom Crough suggested that lithospheric thinning might explain this excess atoll subsidence, and together we developed the model for the origin of mid-plate island swells presented in Chapter 4.
This research has been published in Journal of Geophysical Research, 83,
1236-1244, 1978. Impressed by the potential of transfer function
niques of analyzing gravity data, I was interested in using these tech-niques to investigate the crustal structure of aseismic ridges. Tony Watts generously allowed me to use Lamont gravity data and computer
programs in the work presented in Chapter 2. This manuscript has been submitted to the Journal of Geophysical Research for publication.
Of the many scientists, staff and students at Woods Hole and MIT who have helped make my graduate experience rewarding, I would particularly like to thank Mike Purdy, my thesis advisor and friend, whose support and guidance have been invaluable; Hans Schouten and Chuck Denham for
teaching me principles of time series analysis; and Jake Pierson for guiding me through the combined bureaucracies of MIT and WHOI. I am also particularly grateful to John Sclater, LeRoy Dorman and Pete Molnar, for without their encouragement it is unlikely that I would have returned to graduate school.
The one individual to whom I am most indebted is my wife, Sandy. Without her patience, support and constant encouragement this thesis would never have been completed. I am also grateful to her for typing
the final draft of the thesis.
THE CRUSTAL STRUCTURE AND SUBSIDENCE HISTORY of
ASEISMIC RIDGES AND MID-PLATE ISLAND CHAINS by
Robert Sherman Detrick, Jr.
Submitted to the Woods Hole Oceanographic Institution-Massachusetts Institute of Technology Joint Program in Oceanography on May 5, 1978 in partial fulfillment of the requirements for the degree of Doctor of Philosophy.
ABSTRACT
This thesis consists of three papers examining problems related to the crustal structure, isostasy and subsidence history of aseismic ridges and mid-plate island chains. Analysis of gravity and bathymetry data across the Ninetyeast and eastern Walvis Ridges indicates these features are locally compensated by an overthickening of the oceanic crust. Maxi-mum crustal thicknesses are 15-30 km. The western Walvis Ridge is also compensated by crustal thickening; however, the isostasy of this part of the ridge is best explained by a plate model of compensation with elastic plate thicknesses of 5-8 km. These results are consistent with the forma-tion of the Ninetyeast and Walvis Ridges near spreading centers on young lithosphere with flexural rigidities at least an order of magnitude less than those typically determined from flexural studies in older parts of the ocean basins. As the lithosphere cools and thickens, its rigidity increases, explaining the differences in isostasy between aseismic ridges and mid-plate island chains. The long-term subsidence of aseismic ridges and island/seamount chains can also be explained entirely by lithospheric cooling. Aseismic ridges form near ridge crests and subside at nearly the same rate as normal oceanic crust. Mid-plate island chains subside at slower rates because they are built on older crust. However, some island chains have subsided faster than expected based on the age of the surrounding sea floor, probably because of lithospheric thinning over mid-plate hot spots, like Hawaii. This lithospheric thinning model has major implications both for lithospheric and mantle convection studies as well as the origin of continental rift systems.
Thesis Supervisor: G. M. Purdy Title: Assistant Scientist
CHAPTER 1
INTRODUCTION AND OVERVIEW
The cooling and thickening of oceanic lithosphere as it ages can explain much of the regional bathymetry of the ocean basins. However,
this pattern of increasing depth with age is interrupted by seamount chains, aseismic ridges and various plateau-like features that stand
several kilometers shallower than the surrounding sea floor (Figure 1).
A few of these features, such as Seychelles, Orphan Knoll and Rockall
Plateau, are clearly continental fragments isolated by rifting and sea floor spreading; however, most of these highland areas appear to be oceanic and volcanic in origin. While various models have been pro-posed to explain the origin of island/seamount chains and aseismic
ridges, there is increasing evidence that many of these features have formed by the passage of the lithosphere over a hot spot or mantle plume (Wilson, 1963; Morgan, 1972).
The hot spot model postulates that there are deep volcanic sources in the mantle which create rising plumes of asthenospheric material. These plumes may be fixed relative to the deep mantle (Morgan, 1972), or they may move relative to one another at rates on the order of that
ob-served for lithospheric plates (Molnar and Atwater, 1973). Material
associated with these rising plumes penetrates the lithosphere, resulting in the formation of a volcanic center that remains nearly stationary relative to the moving lithosphere. An aseismic ridge is built if the volcanism is continuous and an island or seamount chain if the volcanism
is discontinuous. Generally aseismic ridges form from hot spots located on or near spreading centers, while seamount chains form from hot spots located off-ridge (Wilson, 1973).
FIGURE 1
Physiographic map of the World's Oceans by B. C. Heezen and M. Tharp showing location of aseismic ridges and mid-plate
THE FLOOR OF THE OCEANS
6 -U~'~n 5*,, ,h C I k md Ms- raprr). ,r
PAF
gp "l I y TIM rnm F rffAT? NAVY
17 This thesis is a collection of three papers examining problems re-lated to the crustal structure, isostasy and subsidence history of aseis-mic ridges and mid-plate island chains. The basic objectives of this research are (a) to gain insight into the mechanical properties of the lithosphere by studying the manner in which lithosphere of different ages responds to these volcanic loads; (b) to examine the effect of hot spots on the thermal structure of the lithosphere by studying the subsidence history of aseismic ridges and mid-plate island chains.
We find that the isostasy of aseismic ridges require plate rigidities near spreading centers to be at least an order of magnitude less than
that typically determined for old (>80 m.y.) oceanic lithosphere. The differences in isostasy between aseismic ridges and mid-plate island chains can, thus, be largely explained by the increasing rigidity of the lithosphere as it cools and thickens. The long-term subsidence of aseis-mic ridges and island/seamount chains can also be explained entirely by
lithospheric cooling; there is no evidence for significant viscoelastic behavior of oceanic lithosphere. Aseismic ridges generally form near ridge crests; consequently, they subside at nearly the same rate as normal oceanic crust. Mid-plate island chains subside at slower rates because they are built on older crust. However, some mid-plate island chains subside faster than expected based on the age of the surrounding sea floor, probably because of lithospheric thinning over mid-plate hot spots.
Plate tectonics is based on a relatively simple mechanical model for the outer layers of the Earth in which a strong, rigid layer (litho-sphere) overlies a weak layer (astheno(litho-sphere).- The existence of the asthenosphere can be inferred from the gravitational compensation of surface loads. This compensation must be achieved by the lateral flow of material in a weak asthenospheric layer. A rigid lithosphere
is required in order to support large surface mass inequalities, like mountain ranges, for many millions of years.
Studies of the response of the lithosphere to different surface loads have provided much information on the structure, thickness and rheology of the lithosphere. In the oceans these studies have been made for seamounts (Watts et al., 1975), seamount chains (Walcott, 1970a; Watts and Cochran, 1974) and at deep sea trenches (Hlanks, 1971; Watts
and Talwani, 1974; Parsons and Molnar, 1976). In these situations the
oceanic lithosphere appears to respond to long-term (>106 yrs) surface loads as would a thin elastic plate overlying a weak fluid layer. The equilibrium vertical displacement, w, of the lithosphere under a load P is
DV4W + Apgw = P (Walcott, 1970b)
where D is the flexural rigidity of the lithosphere and Ap is the
dif-ference in density between the displaced fluid (asthenosphere) and the
material above the plate infilling the deflection (water, sediments,
basalt,etc.). The flexural rigidity of an elastic plate is a measure
of its resistance to bending and is principally determined by, T, the plate thickness (Walcott, 1970b):
ET a
19
where E is Young's modulus and
a
is Poisson's ratio. From these studies,the flexural rigidity of oceanic lithosphere has been estimated to fall in the range 5 x 1029 to 1031 dyn-cm. These rigidities correspond to effective elastic plate thicknesses of 18 to 48 km. These thicknesses are much less than the seismically determined thickness of the lithosphere. They represent, in essence, that part of the lithosphere that responds elastically to long-term (>106 yrs) surface loads.
Most of these flexural determinations have, however, been limited to older parts (>80 my) of the oceanic lithosphere. There is increasing
evidence that the elastic properties of the lithosphere are temperature dependent. For example, McKenzie and Bowin (1976) have treated the
irregularities of normal sea floor topography as a load created at a spreading center and have estimated a best fitting effective elastic plate thickness of -10 km. This is considerably less than that typically determined for loads on old oceanic crust. Watts (in press) has argued that at temperatures above 4500 + 1500 C stresses in the lithosphere are relieved by plastic flow. Thus the hot, young lithosphere near mid-ocean ridges should be much weaker than the thicker and colder lithosphere in older parts of the ocean basins.
This should have a profound effect on the isostasy of aseismic ridges,
which are generally believed to form at or near spreading centers. By
studying the isostasy of aseismic ridges we can obtain information on the mechanical properties of young oceanic lithosphere. The isostasy of aseismic ridges is, however, still poorly known. Refraction data from aseismic ridges have been used to argue both for (Bott et al., 1971; Goslin and Sibuet, 1975) and against (Francis and Raitt, 1967) crustal
ridges are compensated at depth, several different isostatic models (Airy, Pratt or flexure) have been used to describe the manner in which these ridges are supported (compare Bott et al., 1971, with Bowin, 1973, and Kogan, 1976).
In Chapter 2 we have investigated the crustal structure of two prominent aseismic ridges, the Ninetyeast and Walvis Ridges, in order to place better constraints on their deep crustal structure and isostasy. In this study we have used linear transfer function techniques of
analyzing gravity and bathymetry data similar to those previously used
by McKenzie and Bowin (1976). This relatively new method of analyzing
marine gravity data treats the free-air gravity and bathymetry data as time series. Using cross-spectral techniques a transfer function (or admittance) between gravity and bathymetry is computed,and this function is used to examine the state of isostasy of features along the profiles
(see Appendix A). The advantage of these techniques is that they use
observational data and are not based on any particular model of isostasy. The transfer functions can, however, be interpreted in terms of different isostatic models (McKenzie and Bowin, 1976).
From this analysis of gravity and bathymetry across the Ninetyeast
and Walvis Ridges we draw the following conclusions:
1) The Ninetyeast Ridge and the eastern Walvis Ridge are locally compensated by an overthickening of the oceanic crust. Maximum crustal thicknesses beneath these ridges are estimated to be 15-30 km. The western Walvis Ridge is also compensated by crustal thickening; however, this part of the ridge is
plate thickness of 5-8 km. This compares with elastic plate thicknesses of 20-30 km typically determined around Hawaii
(Walcott, 1970; Watts and Cochran, 1974).
2) These results are consistent with the formation of the Ninetyeast and Walvis Ridges near spreading centers on litho-sphere that is thin and weak with little or no elastic strength.
The differences in isostasy and morphology between the eastern
and western Walvis Ridge are attributed to an off-axis shift (relative to the Mid-Atlantic Ridge) of the "hot-spot" forming the Walvis Ridge beginning ~80 mybp.
3) Comparison of the wavelength and amplitude of gravity anomalies across aseismic ridges and mid-plate island chains indicate that the rigidity of the lithosphere increases by about an order of magnitude from ~1028 to 1029 dyn-cm near
ridge crests to ~1029 to 1030 dyn-cm for lithosphere 90-100 my old. This increased rigidity is attributed entirely to the cooling and thickening of the lithosphere as it becomes older.
The long-term subsidence of oceanic islands has been known since the time of Darwin. Recent Deep Sea Drilling results from a number of dif-ferent aseismic ridges indicate that these features have also experienced a long history of subsidence (Pimm et al., 1974; Vincent et al., 1974;
Thiede, 1977). The simplest explanation for the widespread occurrence
of atolls and guyots and the subsidence of aseismic ridges is that these features ride passively atop the underlying lithosphere and subside as
this lithosphere cools and thickens. In Chapter 3 the geological evidence for aseismic ridge subsidence is reviewed in the context of this simple model. From this study we have concluded:
1) At least five major aseismic ridges--the Ninetyeast Ridge, the Rio Grande Rise, the Walvis Ridge, the Chagos-Laccadive Ridge and the southeast Mascarene Plateau--have formed at or close to sea level and have since subsided at rates comparable to
that of normal oceanic crust. Other aseismic ridges such as
the Iceland-Faeroe Ridge and Broken Ridge have probably under-gone a similar but more complicated subsidence history.
2) This long-term subsidence of aseismic ridges can be ex-plained entirely by the cooling and thickening of the litho-spheric plate on which these ridges are built. Since most aseismic ridges appear to have formed on very young lithosphere near spreading centers, their rates of subsidence are comparable to that of normal oceanic crust.
The long-term subsidence of island and seamount chains formed on older crust away from spreading centers should also be attributable to the cooling and thickening of the underlying lithosphere. That is,
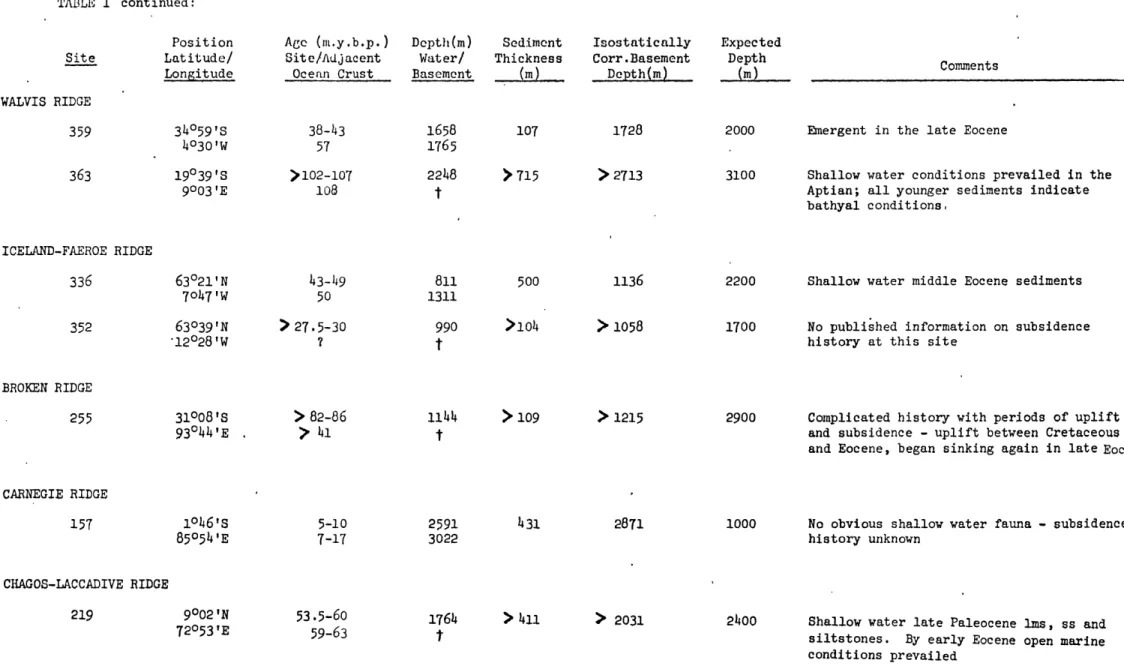
after an initial, relatively short period of rapid isostatic adjustments, these islands should subside at the same rate as the surrounding sea floor. The subsidence of western Pacific atolls and guyots has been well documented (Menard and Ladd, 1963); however, geological evidence from drilling on several of these atolls indicates their long-term
23
subsidence is much greater than this model would predict. In Chapter 4 these data are presented and several possible explanations for this excess subsidence are discussed. We conclude:
1) This excess subsidence cannot be explained by isostatic adjustments either to the weight of the volcano or the weight
of the coral reef cap. It also cannot be explained by
visco-elastic flexure of the underlying lithosphere.
2) This excess subsidence is apparently related to island forma-tion atop areas of anomalously shallow sea floor, such as the Hawaiian swell, associated with mid-plate hot spots. As this sea floor returns to its normal depth, the islands subside an extra amount equal to the original height of the swell.
3) The Hawaiian swell is caused by lithospheric thinning over
the Hawaiian hot spot. Since the lithosphere is denser than
the asthenosphere, this thinning results in broad regional isostatic uplift. As the lithosphere moves away from the hot spot, it cools and thickens, and the swell disappears. The subsidence of the Hawaiian swell and a number of western Pacific atolls is in quantitative agreement with this model. The model also satisfies gravity data over the H1awaiian swell which appear to require compensation in the lower half of the lithosphere.
These three studies demonstrate that the thermal and mechanical properties of the lithosphere largely determine the state of isostasy and subsidence history of both aseismic ridges and mid-plate island chains. Additional studies of how lithosphere of various ages responds to these and other volcanic loads can provide new insight into the thermal and mechanical evolution of the lithosphere. Perhaps the most exciting re-sult of this work is the evidence found for lithospheric thinning over the Hawaiian hot spot. This model, if correct, has major implications both for lithospheric and mantle convection studies as well as the origin
of continental rift systems. It has also pointed out the need for
addi-tional geophysical data on the origin of hot-spot related swells both in the oceans (Hawaii, Cook-Austral, Iceland) and on the continents (East
African rifts, Rhine graben, Lake Baikal). Surface wave studies and the
analysis of long wavelength free-air gravity and geoidal height anomalies probably offer the best hope of resolving the deep lithospheric structure associated with these features.
REFERENCES
Bott, M. H. P., C. W. A. Browitt, and A. P. Stacey, The deep structure of the Iceland-Faeroe Ridge, Mar. Geophys. Res., 1, 328-351, 1971.
Bowin, C., Origin of the Ninety East Ridge from studies near the Equator, J. Geophys. Res., 78, 6029-6043, 1973.
Francis, T. J. G., and R. W. Raitt, Seismic refraction measurements in the southern Indian Ocean, J. Geophys. Res., 72, 3015-3041, 1967.
Goslin, J., and J. C. Sibuet, Geophysical study of the easternmost Walvis Ridge, South Atlantic: Deep structure, Geol. Soc. Am. Bull., 86,
1713-1724, 1975.
Hanks, T. C., The Kuril trench Hokkaido rise system: Large shallow earth-quakes and simple models of deformation, Geophys. J. Roy. astr. Soc., 23, 173-189, 1971.
Kogan, M. G., The gravity field of oceanic block ridges, Izvestiya, Physics of the Solid Earth, 12, 710-717, 1976.
McKenzie, D. P., and C. Bowin, The relationship between bathymetry and gravity in the Atlantic Ocean, J. Geophys. Res., 81, 1903-1915, 1976. Menard, H. W., and H. S. Ladd, Oceanic islands, seamounts, guyots and
atolls, in The Sea, vol. 3, edited by A. E. Maxwell, pp. 365-387, Interscience, New York, 1963.
Molnar, P., and T. Atwater, Relative motion of hot spots in the mantle, Nature, 246, 288-291, 1973.
Morgan, W. J., Plate motions and deep mantle convection, in Studies in Earth and Space Sciences (Hess volume),edited by R. Shagam et al., Geol. Soc. Amer. Mem. 132, 7-22, 1972.
26
Parsons, B., and P. Molnar, The origin of outer topographic rises associated with trenches, Geophys. J. Roy. astr. Soc., 45, 707-712, 1976.
Pimm, A. C., B. McGowran and S. Gartner, Early sinking history of the
Ninetyeast Ridge, Northeastern Indian Ocean, Geol. Soc. Am. Bull., 85,
1219-1224, 1974.
Thiede, J., Subsidence of aseismic ridges: Evidence from sediments on
Rio Grande Rise (Southwest Atlantic Ocean), Am. Assoc. Petrol. Geol. Bull., 61, 929-940, 1977.
Vincent, E.,J. M. Gibson and L. Bran, Paleocene and early Eocene micro-facies, benthonic foraminifera, and paleobathymetry of Deep Sea Drilling Project Sites 236 and 237, western Indian Ocean, in Fisher, R. L.,
Bunce, E. T., et al., Initial Reports of the Deep Sea Drilling Project, 24, 1974.
Walcott, R. I., Flexure of the lithosphere at Hawaii, Tectonophysics, 9, 435-446, 1970a.
Walcott, R. I., Flexural rigidity, thickness and viscosity of the lithosphere, J. Geophys. Res., 75, 3941-3954, 1970b.
Watts, A. B., An analysis of isostasy in the world's oceans: Part
1--Hawaiian-Emperor seamount chain, submitted to J. Geophys. Res.
Watts, A. B., and J. R. Cochran, Gravity anomalies and flexure of the lithosphere along the Hawaiian-Emperor seamount chain, Geophys. J. R. astr. Soc., 38, 119-141, 1974.
Watts, A. B., and M. Talwani, Gravity anomalies seaward of deep-sea trenches and their tectonic implications, Geophys. J. R. astr. Soc., 36, 57-90, 1974.
28
Watts, A. B., J. R. Cochran and G. Seizer, Gravity anomalies and flexure
of the lithosphere: A three-dimensional study of the Great Meteor
Seamount, Northeast Atlantic, J. Geophys. Res., 80, 1391-1398, 1975. Wilson, J. T., Evidence from islands on the spreading of ocean floors,
Nature, 197, 536-538, 1963.
Wilson, J. T., Mantle plumes and plate motions, Tectonophysics, 19, 149-164, 1973.
CHAPTER 2
AN ANALYSIS OF ISOSTASY IN THE WORLD'S OCEANS: PART 3--ASEISMIC RIDGES*
Robert S. Detrick
Woods Hole Oceanographic Institution Woods Hole, MA 02543
Massachusetts Institute of Technology Cambridge, MA 02139
A. B. Watts
Lamont-Doherty Geological Observatory and Department of Geological Sciences
of Columbia University Palisades, New York 10964
31
ABSTRACT
Cross-spectral estimation techniques have been used to analyze the relationship between gravity and bathymetry on 26 profiles across the Walvis and Ninetyeast Ridges. The resulting filters or transfer functions have been used to study the state of isostasy at these ridges. Transfer functions for the eastern Walvis Ridge and the Ninetyeast Ridge profiles can be best explained by an Airy-type thickening of the crust beneath these ridges. The crustal thicknesses required are in the range 15 to 25 km, in good agreement with available seismic refraction data. The transfer function for the western Walvis Ridge can be best explained by a flexure model in which the oceanic lithosphere is treated as a thin elastic plate overlying a weak fluid. The elastic plate thicknesses required are 5 to 8 km. These plate thicknesses are substantially less
than those typically determined from flexural studies of loads on older crust, but are similar to estimates determined for sea floor topography at mid-ocean ridges. These observations are consistent with the
forma-tion of aseismic ridges near spreading centers on lithosphere that is young, thin and relatively weak. The differences in isostasy between the eastern and western Walvis Ridge are attributed to an off-axis shift relative to the South Atlantic spreading center of the "hot spot" forming the Walvis Ridge about 80 m.y.B.P. These observations suggest that the isostatic parameters determined for these aseismic ridges were "frozen in" at the time of their formation at or near a spreading center and have not significantly changed through time.
INTRODUCTION
Scattered throughout the ocean basins are various ridge and plateau-like features that stand 2-3 km shallower than the surrounding sea floor. Some of these features such as Jan Mayen Ridge, Seychelles and Rockall Plateau are clearly continental in structure and probably were isolated by the processes of rifting and sea floor spreading. More difficult to explain are features such as the Ninetyeast Ridge, the Walvis Ridge or the Rio Grande Rise, which are composed mainly of basaltic (volcanic) rocks. These ridges, which are noticeably free of earthquake activity, have been called aseismic ridges (Laughton et al., 1970). While various models have been proposed for the origin of aseismic ridges, there is increasing evidence that many aseismic ridges have formed from "hot spots" centered on or near a mid-ocean ridge (Wilson, 1963; Morgan, 1971).
Deep Sea Drilling results from aseismic ridges have confirmed their volcanic nature and have demonstrated that basement ages along many
aseismic ridges vary systematically along their length and are approximately the same as the surrounding sea floor (von der Borch, C. C., Sclater, J. G., et al., 1974; Davies, T. A., Luyendyk, B. P., 1974; Perch-Nielson, K.,
Supko, P. R., et al., 1975; Bolli, H. M., Ryan, W. B. F., et al., 1975). Sediments recovered from aseismic ridges indicate they have experienced a long history of subsidence. The oldest sediments indicate shallow water, even subaerial conditions, followed by progressively deeper water and more open marine depositional environments (Pimm et al., 1974; Vincent et al.,
1974; Thiede, 1977). The rates of subsidence are similar to that of
FIGURE 1
Summary of published seismic refraction data from aseismic ridges. Also shown for reference is a typical oceanic crustal section and an interpretation of the crustal structure be-neath Iceland. Velocities are in km/sec; parentheses indicate unreversed velocities; asterisks indicate assumed velocities.
S- 8
I I Ilk~I~IN
r-_.:: o ::U Ui U
SOc -: ::."-
~ ~~ ~ ~~~~~~~~~..
-" ... : : ;~ ~
'J .... ... : "." " '- "-.." ", :" .;"-. ' " : " "' • . : .:. ... . " -.... : .... : ... :,:: : ii iii,.. :::::".':'."'.""... .* ;...-.:T.M.U,::~:I'is;ii:if:eii......-. :. cs i -- e ::.U t ...:::: 04 ... ... i-T
4
?-/0a~ ," " 01- I&:: 14 ,
-U::.U : II-ifu HI K)' ::.i IHQ : .. ... .... " ... : ... . . . . : .- :-:. : :-: : .. : .-- S.:': ... : . ....
: Ii :.!- -:-i ,i'i:: :: !ii:-iii .],:-..iii. .iii !
-L
b~. ... ...
~,.,:
..4LO ... '.:: '::;
L~,~
~~~ii
~~~~I
:s :iiiriiiii~ coriiiiiiii6=:.U U= : I..:. . : " .-: : -" .... .. . . ... • ... ...': .. :... .:.:::U: : % :V46 '": ... U- U -U U:Ir U . -lq ... .UN "" :::: :-" .: .. . ... .. .. .. ... .. . : . -" -. fl±.. kr I ftF_ t:li .4ii . S: . . .. .. : .. . .. ::: U.:. U.: ,,, . . . .. ,. , . ... .. I i I I I ( ic] 1OY1)
Hid3O
--IL-::.
*
: ;
... . : ... .. - ;: " :'; .::. 0 .... ":.. " " .. ".' .: .' " ".; i '- :::' ,:!:.. .- -.: : ; K :: ; : . ..: .: ...: '.: - ; ;: : : :i : , :The deep crustal structure of aseismic ridges, however, remains
poorly known despite a number of seismic refraction experiments (Figure 1). Mantle-type velocities have only been identified beneath three aseismic
ridges, the Chagos-Laccadive Ridge, the Iceland-Faeroe Ridge and the Nazca Ridge. Only one of these velocities (Nazca Ridge) was a reversed determination. Deep refraction data are unavailable from many aseismic ridges including the Walvis Ridge, the Rio Grande Rise and the Cocos and Carnegie Ridges. Even where refraction data are available the results show considerable variability, especially in shallow crustal structure
(Figure 1). Francis and Shor (1966) reported "Moho" beneath the Chagos-Laccadive Ridge at depths of about 17 km. Similar mantle depths have been reported beneath the Iceland-Faeroe Ridge (16-18 km) by Bott et al.
(1971) and the Nazca Ridge (16 km) by Cutler (1977). Since the depth to
"Moho" in normal oceanic crust is 9-11 km, these studies indicate crustal
thickening of ~8-10 km beneath aseismic ridges. However, Francis and
Raitt (1967) argued against crustal thickening beneath the Ninetyeast Ridge. They interpreted their refraction data as indicating about the same crustal thickness beneath the ridge as in the adjacent Wharton Basin and suggested the Ninetyeast Ridge was a horst-type structure underlain by low-velocity (7.1 km/sec) mantle material.
Because of the lack of reliable deep refraction data from many
aseismic ridges, most information on their deep crustal structure has been inferred from gravity studies. Free-air gravity anomalies over aseismic ridges are generally small in amplitude indicating that the ridges are in approximate isostatic equilibrium. Bott et al. (1971) found, for example, that the small free-air gravity high (-20 mgal) over the Iceland-Faeroe
Ridge could be best explained by an Airy-type thickening of the crust. The amount of thickening deduced was about 8 km, in general agreement with seismic refraction results. Goslin and Sibuet (1975) and Kogan
(in preparation) have interpreted gravity data over the Walvis Ridge also in terms of a thickening of the crust. The main difference in these studies is the model of isostasy which is preferred. Goslin and Sibuet (1975) found their gravity data could be best explained by an Airy-type model of local compensation, while Kogan (in preparation)
preferred a regional compensation model for the ridge. The amount of crustal thickening deduced was about 10-15 km for the Airy model and about 7-10 km for the regional (flexural) case. However, Bowin (1973) suggested a different compensation mechanism for the Ninetyeast Ridge. He proposed a Pratt-type model of compensation in which the ridge is supported by an emplacement of gabbro and serpentinized peridotite be-neath normal crustal layers rather than by a thickening of the crust. In his preferred model (Bowin, 1973; Figure 7), the thickness of the layers of normal crust beneath the ridge is about the same (or slightly less) than in the adjacent ocean basin and intermediate density material
(gabbro and serpentinized peridotite) extends to depths of about 25 km. These previous seismic refraction and gravity studies suggest a
number of outstanding problems. They include: (1) the overall
struc-ture of aseismic ridges and whether or not the crust is thicker beneath the ridges than in the adjacent ocean basins, (2) the state of isostasy of the ridges and whether or not an Airy, Pratt or flexure model best describesthe manner in which the ridges are supported and (3) the origin of the ridges and whether or not they formed near mid-ocean ridge crests.
A useful approach to these problems can be made by using linear transfer function techniques of analyzing gravity and bathymetry data, similar to those previously used by Lewis and Dorman (1970), Dorman and Lewis (1970) and McKenzie and Bowin (1976). These techniques examine
the relationship of gravity and bathymetry as a function of wavelength. The resulting transfer function (or admittance) contains information on the mechanism of isostasy. The advantage of these techniques is that they use observational data and are not based on any particular model of isostasy. The transfer function can, however, be interpreted in terms of different isostatic models and may in some cases be used to distinguish between them.
The purpose of this paper is to apply linear transfer function tech-niques to the study of isostasy at aseismic ridges. One limitation of many previous studies is that the transfer functions have been calculated over rather broad regions comprising different tectonic provinces. There-fore we have used a modification of the techniques previously described by Dorman and Lewis (1970), Lewis and Dorman (1970) and McKenzie and Bowin (1976) designed to study isostasy over a single two-dimensional
geological feature. This method, which has been presented by Watts (in
preparation), differs from these earlier techniques in that cross-spectral rather than Wiener filtering techniques are used to compute the transfer function and in that many profiles of gravity and bathymetry over the same geological feature are used to obtain smooth spectral estimates. The three main objectives of this work are (1) to determine the transfer function which describes the relationship between gravity and bathymetry over aseismic ridges, (2) to interpret this transfer function in terms of
various isostatic models and (3) to use the preferred model of isostasy to provide new constraints on the origin of aseismic ridges.
DATA SOURCES AND ACCURACY
In this study we have used 26 gravity and bathymetry profiles across two prominent aseismic ridges, the Walvis Ridge in the eastern South Atlantic and the Ninetyeast Ridge in the Indian Ocean. These ridges were chosen primarily because of the large amount of available gravity data. Most of the data used in this study havenot been previously pub-lished.
The ship's tracks along which these data were collected are shown in Figures 2 and 4. The data sources and information on instruments and navigation are presented in Table 1. The overall accuracy of the gravity measurements depends on the type of instrument and navigation used. Generally
the accuracy is estimated to be 2 to 5 mgal for the Gss2 sea gravimeter and the vibrating-string gravimeter when used with satellite navigation. Somewhat larger errors are expected for those data collected using celestial navigation. The gravity anomalies were reduced to the International
Ref-erence Ellipsoid (flattening = 1/297.0); however, the choice of a refRef-erence ellipsoid is not important since the mean and trend were removed before the data were Fourier transformed.
DATA DESCRIPTION Ninetyeast Ridge
The Ninetyeast Ridge (Figure 2) is a remarkably linear, 5000 km long
PROFILE Ninetyeast Ridge 1 2,7 R6ob 3,4,6,8 5 9 10 11 12 13 14 Walvis Ridge 1,5 2 3 4 6,10,12 Rob 7,9 8 Rob 11 SHIP Argo ert D. Conrad Chain Vema Vema Vema Atlantis Argo Vema Vema Vema Vema Atlantis Atlantis ert D. Conrad Vema ert D. Conrad Vema YEAR 1963 1971 1971 1976 1971 1976 1976 1960 1963 1962 1963 1964 1972 1972 1970 1970 1963 1962 TABLE 1
SUMMARY OF NAVIGATION AND INSTRUMENTATION
CRUISE & LEG GRAVIMETER STABLE PLATFORM
LU 14 1402 100-6 3308 2901 3305 93-11 MN05 1909 1811 1912 2011 67-5 67-2 1313 2712 0801 1809 LaCoste-Romberg Graf-Askania Gss2 VSA Craf-Askania Gss2 Graf-Askania Css2 Graf-Askania Gss2 VSA LaCoste-Romberg Graf-Askania Gss2 Graf-Askania Gss2 Graf-Askania Gss2 Graf-Askania Gss2 VSA VSA Graf-Askania Gss2 Graf-Askania Gss2 Graf-Askania Gss2 Graf-Askania Gss2 Gimbal mounted AnschUtz Sperry Gyrotable Aecroflex Aerofex Aeroflex Sperry Gyrotable GCmbal Mounted Alidade Alidade Alidade Alidade Sperry Gyrotable Sperry Gyrotable AnschUtz Alidade AnschUtz Alidade NAVIGATION Celestial Satellite Satellite Satellite Satellite Satellite Satellite Celestial Celestial Celestial Celestial Celestial Satellite Satellite Satellite Satellite Celestial Celestial CROSS-COUPLING Yes Yes Yes Yes No No No No No Yes No No - NAVIGATION CROSS-COUPLIN
--FIGURE 2
Location of free-air gravity anomaly and bathymetry profiles across the Ninetyeast Ridge used in this study. The thin lines indicate the actual ship track while thick lines represent the projected profiles. Magnetic anomalies (dots) and fracture zones (long dashes) after Sclater and Fisher (1974), Sclater and others (1976) and Pierce (1977). The bathymetry is based on a map by Sclater and Fisher (1974).
about 310 S until it is buried by the sediments of the Bengal Fan near
90N. Sclater and Fisher (1974) found that the crust east of the ridge becomes older to the south while the crust west of the ridge becomes older to the north. The ages of the oldest sediments recovered at DSDP sites on the ridge increase from Oligocene (22.5 to 37.5 m.y.) at Site 254 (Davies, T. A., Luyendyk, B. P., et al., 1974) to Campanian
(71 to 82 m.y.) at Site 217 (von der Borch, C. C., Sclater, J. G., et al., 1974) indicating that the Ninetyeast Ridge also progressively increases in age to the north. These ages are similar to oceanic crust
to the west, suggesting the Ninetyeast Ridge has always been part of the Indian plate (Sclater and Fisher, 1974).
The 14 gravity and bathymetry profiles across the Ninetyeast Ridge used in this study are shown in Figure 3. These profiles illustrate the asymmetric, blocky nature of the Ninetyeast Ridge. It is typically
200-300 km wide and averages about 2 km shallower than the surrounding sea floor. Sediment cover on the ridge is patchy with locally thick accumulations of sediment; however, steeper slopes are almost sediment free. A positive free-air gravity anomaly is associated with the ridge. It is small in amplitude, generally not exceeding 75 mgal peak to peak, indicating that the ridge is compensated at depth (Bowin, 1973).
Large, steep scarps are common on many profiles suggesting that block faulting has contributed to the formation of ridge topography. Several of these scarps have relief in excess of 2000 m. While the steepest, largest scarps often occur on the eastern flank of the ridge (Profiles 90E-2, 90E-4, 90E-11, 90E-13, 90E-14, Figure 3), it is almost equally
common for the largest scarps to occur on the western ridge flank (Profiles
43
FIGURE 3
Projected free-air gravity anomaly and bathymetry profiles across the Ninetyeast Ridge. Location of profiles shown in Figure 2. Acoustic basement indicated by shading where seismic reflection data are available.
NINETYEAST
RIDGE
90E- 1
LU1490E-6
CH100-690E-
119
?2:5 G
2.5 A2935.0 A2-93-1190E-7
RC140290E-8
CH100-690E-9
V290190E -10
V3305 0 300 S I I IKM
90E-12
MN0590E -13
V1909 25 K 0> -25 r"I
0
2.5 5.03
-25
25 9, -0 2.5 X 5.0]25
0 25 0I2.5
-5.090E-14
25 1 -25 2 0 2.5 K 5.0 V1811 25 K0
o
I0
-25 5.0 600 WJl90E-2
RC140290E-3
CHiOO-690E-4
CHOO0-690E-5
V3308vn2
As=t
is little or no indication for large scale faulting (Profiles 90E-5, 90E-6, Figure 3), an observation which led Bowin (1973) to suggest that block faulting was only a secondary process in forming the ridge topography.
Walvis Ridge
The Walvis Ridge extends WSW some 2800 km from the South West African continental margin to the Mid-Atlantic Ridge near Tristan da Cunha and
Gough Islands (Figure 4). The eastern part of the Walvis Ridge (east of
30E) has a continuous block-like structure with several distinct segments
trending at nearly right angles. Further west the ridge develops into two branches, one trending N-S and the other trending NE-SW, both composed of individual seamounts, guyots or short elongate ridges. The N-S trending
branch disappears near 340S; however, the other branch continues WSW to the
eastern flank of the Mid-Atlantic Ridge.
The location of the 12 gravity and bathymetry profiles from the
Walvis Ridge used in this study are shown in Figure 4. Profiles 1-5 cross a 400 km long, continuous N-S trending segment of the eastern Walvis Ridge
located near 60E. These profiles, shown in Figure 5, indicate this part
of the Walvis Ridge has an asymmetric blocky cross-section remarkably
similar to the Ninetyeast Ridge. It is typically 200-300 km wide with a
steep eastern flank and a gentler, sediment-covered western flank. Evi-dence for large scale block faulting is common on many profiles. Like the Ninetyeast Ridge, this part of the Walvis Ridge is associated with only a small positive free-air gravity anomaly, generally not exceeding 75 mgal in amplitude. This gravity high is flanked by smaller amplitude gravity
lows (-25 mgal) which return to near zero values within 50 to 100 km of the ridge axis.
FIGURE 4
Location of free-air gravity anomaly and bathymetry profiles across the Walvis Ridge used in this study. The thin lines indicate the actual ship track while thick lines represent projected profiles. Magnetic anomalies (dots) and fracture zones (long dashes) after Ladd (1974) and Rabinowitz and
LaBreque (in press). The bathymetry is based on a map by
ANGOLA BASIN
YAL-7
33--15o -100 :-4.5 CAPE BASIN -450 L -20" -50 159 200FIGURE 5
Projected free-air gravity anomaly and bathymetry profiles across the Walvis Ridge. Location of profiles shown in Figure
4. Acoustic basement indicated by shading where seismic re-flection data available.
WALVIS RIDGE
WAL-1
V1912WAL-
2
V2011WAL-3
A2-67-5WAL-4
A2-67-2 ?WAL-6
RC1313WAL-10
0 >-2
5
r
-0 2.5 5.0 RC1313WAL-11
WA L-7
V2712WAL-8
RC0801 0 300 600 KM -25r 10 Vi-.5J5.0
V1809WAL-12
25 Koo
-25I
0
2.5 _ 5.0 RC1313WAL-5
V1912WAL-9
V2712 2 5to o
-25jo
2.5 5.050
Profiles WAL-6 and WAL-7 (Figure 5) cross the central Walvis Ridge
near 270S. The ridge in this area is similar in morphology to the ridge
farther east, although it is slightly deeper and more symmetric in cross-section. West of 3 E the Walvis Ridge develops into two seamount and guyot chains. The easterly branch is the more prominent with
rounded or elongate peaks often rising to depths of less than 1000 m while the western branch is composed mostly of isolated seamounts and
guyots (Connary, 1972; Dingle and Simpson, 1976). Profiles WAL-8 to
WAL-12 all cross the western Walvis Ridge; however, most of the profiles are located between 300 and 340S near where the ridge bifurcates. One striking feature of these crossings is the much higher amplitude free-air gravity anomalies associated with the ridge in this area. These anom-alies are generally 100-150 mgal peak to peak or about twice the typical amplitude of anomalies over the eastern Walvis Ridge.
DATA ANALYSIS
The basic computational procedure involved in applying transfer function techniques to these data has been discussed by McKenzie and
Bowin (1976) and Watts (in preparation) and will only be briefly summarized here.
We wish to obtain a filter which when applied to an observed bathymetry profile converts it to a series which resembles the observed gravity.
The wavenumber (or frequency) domain representation of this filter is the
complex admittance Z(k ) defined simply as
G(k )
51 where G(k ) and B(k ) are the discrete Fourier transforms of the gravity
n n
and bathymetry and k is the wavenumber (k = 2/A). In the presence of
n n
noise a better estimate of the admittance is given (McKenzie and Bowin, 1976) by
G(k ) - B(k )*
n n
n B(k ) - B(k )*
n n
where * indicates the complex conjugate. In this case the admittance is
the cross spectrum of gravity and bathymetry divided by the power spectrum of the bathymetry. In order to reduce the noise in this estimate of the admittance some form of spectral smoothing is required. In this study the smoothing has been accomplished by using many profiles over the same geo-logical feature. Each profile represents an independent estimate of the cross spectrum and power spectrum of gravity and bathymetry. These spectra are summed and the resulting averaged spectra used to obtain a single
admittance function for the feature. This admittance is based completely on the observed relationship between gravity and bathymetry and is not tied to any particular isostatic model. However, it can easily be compared with isostatic models based on different compensation mechanisms (McKenzie and Bowin, 1976).
The Ninetyeast Ridge and the Walvis Ridge were treated as separate data sets. Each gravity and bathymetry profile was projected normal to
the local trend of the ridge and interpolated at a 2.3 km interval. The
profiles extended 300 km on either side of the ridge axis; shorter profiles 0
were extended out to this length in order to be included in the study. Both mean and trend were removed and a cosine bell taper applied to the
52 transformed. These profiles were then used to calculate the complex ad-mittance Z(k ) for each ridge using the spectral smoothing techniques
outlined above.
The calculated admittance functions (amplitude and phase) are plot-ted against wavenumber in Figure 6 for the Ninetyeast Ridge and Figure 7
for the Walvis Ridge. Also plotted is the coherence y2(k
). The coherence
n
is a measure of that portion of the observed gravity that can be directly attributed to the bathymetry. An estimate of the coherence is given (Munk and Cartwright, 1966) by
y2 = (N(cc*/EGEB))-1)/(N-1) (3)
where c = c(k ) is the complex cross spectrum of gravity and bathymetry,
n
EG and EB are the power spectra of gravity and bathymetry respectively
and N is the total number of profiles. The coherence is high (y2
>0.5)
for wavelengths longer than about 20 km reflecting the fact that a significant portion of the energy in the observed gravity can be attributed to the
bathymetry.
The admittance phase, p(k ), is close to zero for X>20 km implying that the admittance at these wavelengths is real. The relative smoothness of the log1 0 admittance curve for X>20 km is evidence that the same signal
was present in each profile and that the smoothing procedure satisfactorily reduces noise. The logl0 admittance curve peaks at wavelengths of about 100 km and decreases linearly to wavelengths of 10-20 km. This reflects the increasing attenuation of the gravity signal from short wavelength topography. The decrease in the amplitude of the admittance at long wavelengths reflects the effects of isostatic compensation.
53
FIGURE 6
The coherence, logl0 admittance amplitude, admittance phase, and filter generated from the gravity and bathymetry profiles shown in Figures 2 and 3 from the Ninetyeast Ridge.
NINETYEAST RIDGE
PHASE
240
I
I
I
Oa 20 10COHERENCE
i.oI
0.5-I
5 Km AADMITTANCE
0 0
-120
-240
-1.0
-2.0
-3.0
I I I I 00 20 10 5 Km0.010
0.005
0
FILTER
I -200-300
-200
-100
KM
100 200 300 U)-z
w 0LL
LL W U-0-I
LL-4.0
O-J
-5.0
I
I
o 20 5KmI
'i ;;1
-1 IVLJIW[V-FIGURE 7
The coherence, logl0 admittance amplitude, admittance phase, and filter generated from the gravity and bathymetry profiles shown in Figure 4 and 5 from the Walvis Ridge.
WALVIS RIDGE
PHASE
240
I
I
I
o
20
10
COHERENCE
1.0
0.5
0
I
I
0O
20
I
5KmAADMITTANCE
FILTER
0.0101
LL LL Lli 01-[ i LL
0.005-
0--360
5Km
A
-200
-100
KM0
100 200 300120
-120
-240
1
5Kmh-1.0
-2.0
-3.0
o
-4.0
0
-5.0
-5.0 I .57 Also shown in Figures 6 and 7 are the filters obtained by inverse Fourier transforming the complex admittance. These filters can be
con-sidered as impulse response functions representing the gravity effect of
a line load. The negative side lobes, most obvious for the Walvis Ridge
filter (Figure 7), reflect the effects of isostatic compensation. The extent to which these filters can reproduce the observed gravity anomalies is shown in Figure 8 and 9. The "filtered topography" profiles in these figures were obtained by convolving the filter with the observed bathymetry. The "predicted" and observed gravity anomalies generally compare well.
The mean variance between predicted and observed anomalies is ±8.9 mgal for the fourteen Ninetyeast Ridge profiles and ±9.6 mgal for the twelve Walvis Ridge profiles.
The largest discrepancies between predicted and observed anomalies are associated with locally thick sediment accumulations masking the true base-ment relief on the ridge or in the adjacent ocean basins (for example,
90E-9 and WAL-5). The Ninetyeast Ridge filter is also unable to explain
completely the large amplitude free-air gravity anomalies associated with
rugged topography east of ridge between 120S and 260S (90E-10 through
90E-14). This topography is probably the trace of the old Ninetyeast
transform fault (Bowin, 1973) and unusual crustal mass distributions
associated with this fracture zone may be responsible for the large gravity anomalies. The Walvis Ridge filter does a generally good job of
pre-dicting the shape and amplitude of gravity anomalies across the ridge; however, it cannot explain the large amplitude anomaly associated with the seamount at the eastern end of profile WAL-1. This feature, known as Ewing seamount, is located about 150 km east of the main Walvis Ridge