HAL Id: hal-01213942
https://hal.archives-ouvertes.fr/hal-01213942
Submitted on 16 Oct 2015
HAL is a multi-disciplinary open access
archive for the deposit and dissemination of
sci-entific research documents, whether they are
pub-lished or not. The documents may come from
teaching and research institutions in France or
abroad, or from public or private research centers.
L’archive ouverte pluridisciplinaire HAL, est
destinée au dépôt et à la diffusion de documents
scientifiques de niveau recherche, publiés ou non,
émanant des établissements d’enseignement et de
recherche français ou étrangers, des laboratoires
publics ou privés.
To cite this version:
Patrick Ferrand, Marc Allain, Virginie Chamard. Ptychography in anisotropic media. Optics Letters,
Optical Society of America - OSA Publishing, 2015, 40 (22), pp.5144-5147. �10.1364/OL.40.005144�.
�hal-01213942�
Ptychography in anisotropic media
P
ATRICKF
ERRAND1*, M
ARCA
LLAIN1,
ANDV
IRGINIEC
HAMARD11Aix-Marseille Université, CNRS, Institut Fresnel, Centrale Marseille, UMR 7249, Institut Fresnel, F-13013 Marseille, France *Corresponding author: [email protected]
Compiled October 12, 2015
Ptychography is described in the context of polarized light probing anisotropic specimen, i.e., showing prop-erties of birefringence and/or diattenuation. We estab-lish an optimization strategy using a vectorial formal-ism. A measurement scheme using a set of linearly po-larized probes and linear polarization analyzers is pro-posed, allowing to retrieve the full anisotropy map of the specimen. © 2015 Optical Society of America
OCIS codes: 110.5405 Polarimetric imaging; 110.3010 Image re-construction techniques; 100.5070 Phase retrieval; 120.5410 Polarime-try; 260.5430 Polarization; 340.0340 X-ray optics
http://dx.doi.org/xxx
Ptychography is an imaging technique aiming at reconstruct-ing numerically the transmission properties of an object (ampli-tude, phase). It exploits a set of intensity diffraction patterns recorded for different positions of a spatially-structured illumina-tion probe on the object [1]. In the context of optical microscopy, it is becoming a new competitive method mostly thanks to its capability to image quantitatively the phase shift introduced by the sample. Beyond the possibility which is now offered to see transparent specimen, measuring the phase brings a valuable information, like e. g., in biology for the quantification of the mass of cells [2–4] or chromosomes [5]. In spite of this progress, ptychography has been only developed in a scalar formalism, an approximation that restricts its application to isotropic materials. Though, many systems, because of their structural molecular anisotropy, present strong optical birefringence properties, as it is the case for biological cell components (actine [6], micro-tubules [7]), biological tissues (collagen [8]), or biomineral sys-tems [9]. There is therefore a strong need for the development of a vectorial formalism, that would allow a complete optical char-acterization of these anisotropic materials. Moreover, addressing anisotropy is not limited to the optical waves. In electron [10] and x-ray [11–13] microscopy, where much progress in high reso-lution imaging has been accomplished with ptychography using a scalar formalism, exploiting the specific interaction between a polarized beam and materials showing anisotropic electronic properties such as dichroism [14] requires a generic vectorial formalism, too.
In this letter, we revisit the ptychography problem using a vectorial formalism and establish a criterium to be minimized, in order to reconstruct the anisotropy properties of the object. A
measurement scheme using a set of linearly polarized probes and polarization analyzers is proposed, allowing the retrieval of the full anisotropic properties of the specimen without indeter-mination.
Ptychography relies on the assumption that a probe interacts with a specimen in a multiplicative way [15]. For a full vectorial description, it is convenient to use the formalism introduced by Jones [16], so that the k-th probe pk, e.g., the k-th
polariza-tion state, centered at the j-th posipolariza-tion rj, must be written as a
complex vector pjk(r) =pk(r rj) = 2 4 pjk;x(r) pjk;y(r) 3 5 , (1)
where the two complex components pjk;x(r)and pjk;y(r)refer
to the x and y transverse directions, respectively. The specimen transmission properties have to be described at any position r by a so-called Jones complex matrix
O(r) = 2 4 rxx(r) ryx(r) rxy(r) ryy(r) 3 5 , (2)
where, in general ryx(r)6=rxy(r)[16]. With these notations, the vectorial exit field yjk(r)of the ptychography problem is simply given by the matrix multiplication
yjk(r) =O(r)pjk(r). (3)
Thus, solving the ptychography problem in an anisotropic medium aims at retrieving the 4-element Jones matrix O(r)at any point r or, equivalently, at retrieving the four maps rxx(r), ryx(r), rxy(r), and ryy(r). In the following, we will refer to this
four-map set as the Jones map of the object.
Now that the interaction between the probe and the specimen is formally established, the equations of the direct ptychography problem can be derived and the fitting strategies for reconstruct-ing the object can be formulated. For the convenience of these derivations, we will, temporarily and without loss of generality, adopt a different formalism, so that Eq.3becomes
yjk(r) =Pjk(r)r(r), (4)
where we have built up, out of O(r)and pjk(r), the two
quanti-ties Pjk(r) = 2 4 pjk;x(r) 0 pjk;y(r) 0 0 pjk;y(r) 0 pjk;x(r) 3 5 (5)
rxy(r)
The far field generated in the Fraunhoffer approximation by this exit-field reads Yjk(q) =F yjk(r), where q is the
reciprocal-space coordinate, with
F= 2 4 F 0 0 F 3 5 (7)
whereFis the 2D Fourier transform. After a polarization analy-sis, the vectorial field Yjkis reduced to a scalar complex ampli-tude to
xjkl(q) =hTl Yjk(q), (8)
where hl is the corresponding operator for the l-th analysis
filter, and T is the transpose operator. For instance, one can show easily that the operator corresponding to a linear polarizer oriented at a with respect to the x direction is
ha= 2 4 cos a sin a 3 5 .
Finally, the intensity yjkl(q)collected in the detection plane reads
(in average)
ujkl(q)⌘ hyjkl(q)i = |xjkl(q)|2+ekl(q), (9)
with eklthe expected contribution of the background component to the intensity.
Because Eq.9gives the formal relationship between the mea-surement yjkland the unknown object r, it gives us the
opportu-nity to define a least-square estimate of the unknown object via the minimization of the following criterion [17]
L(r) =
Â
jÂ
k,l y 1/2 jkl u1/2jkl 2 =Â
j Lj (r). (10)Following the same “spirit” as the well-known ptychographical iterative engine (PIE) algorithm established in a scalar formal-ism [18], the vectorial PIE (vPIE) needs to compute the four-component gradient ofLj, that reads
∂Lj ∂r =
Â
k,l ∂ujkl ∂r h y1/2jkl u1/2jkl iujkl1/2, (11) leading to ∂Lj ∂r = 2Â
k P † jkF†Â
l h? l(x0jkl xjkl), (12) where x0jklis the updated scalar far field, meaning that the
mod-ulus is replaced by the square root of the measured intensity,
x0jkl =qyjkl/ujklxjkl, and where?and † denote the ”complex
conjugate” and ”transposed complex conjugate” operators, re-spectively.
Finally, similarly to the scalar PIE, the optimization algorithm is now applied to the four-component guess of the object, i.e. to
diagonal matrix, with diagonal values given by Dj,1=Dj,4=
1/max r ⇣ Âk|pjk;x|2 ⌘ and Dj,2=Dj,3=1/maxr ⇣ Âk|pjk;y|2 ⌘ . x y
(b)
0 : x y(a)
-3 -2 -1 0 1 2 3;
xx(c)
;
yx;
xy;
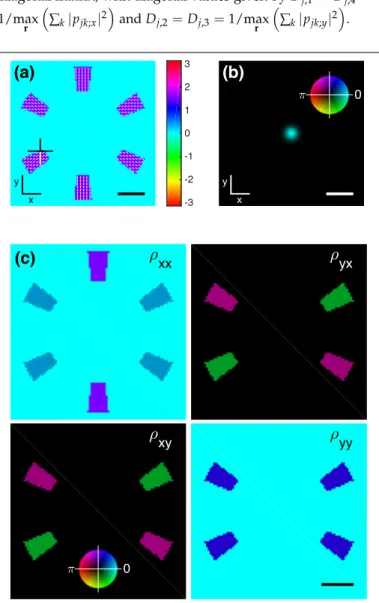
yy 0 :Fig. 1.(a) Simulated object. Colorscale indicates the retardance in radians. Superimposed white sticks show the orientation of the fast axis for birefringent area. (b) Complex amplitude of the probe. The inset shows the complex value color coding, with phase encoded as hue and modulus as brightness. (c) Jones map of the simulated object. All scale bars are 20 µm.
Retrieving the full anisotropy properties of any object O re-quires that the measurement involves the appropriate set of probes and analysis filters. A naive approach would consist in addressing independently each term of the Jones map, i.e., probe and analysis polarized along the x direction in order to address
rxx, probe along x and analysis along y to address rxy, etc.
How-ever, since each map of rxx, rxy, ryx, ryywill be retrieved, each
one with a constant phase indetermination, this method would fail in reconstructing the phase relationship between the four elements of the Jones map. Therefore we propose the following strategy for choosing the probes and analyzers. Concerning
k = 0 l = 0 l = 45 l = 90 k = 45 k = 90 0 1 2 3
Fig. 2.Nine intensity patterns (log of intensity) as recorded for all kl combinations, when the probe is centered at the point in-dicated by the cross in Fig.1a. Color scale refer to all patterns. Scale bar is 1 µm 1.
the probes and more specifically for linear polarization states, the sensitivity to the anisotropy properties requires that their polarization angle is chosen as far as possible from the directions defined by the neutral axes of the material. Without a priori knowledge of these axes in the investigated object, a common strategy to avoid pathological cases in polarimetry consists in using three different polarization angles [19]. Therefore, we pro-pose to use a set of three linearly-polarized probes Pjk, where
k2 {0, 45, 90}denotes the orientation in degrees of the linear polarization of the field in the xy plane. Concerning the po-larization analysis, without a priori knowledge of the kind of polarization state (linear, circular, etc.) to be analyzed, we also propose to use three linear analysis filters, for instance along the same directions, hl, with l2 {0, 45, 90}. Thus the vPIE exploits
a set of nine intensity patterns ujkl(q), corresponding to all the
combinations of probes and analyzers, such high number of mea-surements aiming at solving unambiguously the whole set of unknowns, namely the four complex components of O(r). With these sets of probes and analyzers, the update of O as proposed by Eq.13writes explicitly, for instance for the rxxcomponent,
r(j+1)xx = r(j)xx+ 2b max r ⇣ |pj,0,x|2+|pj,45,x|2 ⌘ ⇥ p⇤ j,0,x(Dyj,0,0+p12Dyj,0,45) +p⇤ j,45,x(Dyj,45,0+p1 2Dyj,45,45) , (14) with Dyjkl=F 1(x0jkl xjkl).
In order to test the validity of our approach, the vPIE has been run on a set of simulated data. We have considered a set of six distant birefringent objects of retardance p/2 regu-larly arranged on a ring, having their fast axis oriented radially (Fig.1a), surrounded by an isotropic medium, chosen so that the objects do not generate any phase step for an electric field polarized along the direction of the fast axis. Although differ-ent in terms of polarization oridiffer-entations, the three probes have the same two-dimensional gaussian profile (radius 3.5 µm) illus-trated in Fig.1b, and a wavelength of 0.5 µm. The corresponding
; xx ;yx ; xy ;yy 0 :
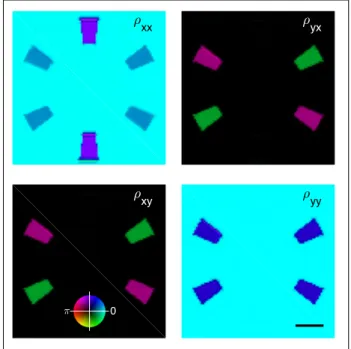
Fig. 3.Reconstructed Jones map of the object. The inset shows the complex value color coding, with phase encoded as hue and modulus as brightness. Scale bar is 20 µm.
Jones map of this object is presented in Fig.1c, showing clearly different values for the different areas, due to their different orientations. In addition, one can notice that ryx(r) = ryx(r),
which is the signature that the object is made of single-layer bire-fringent regions (in opposition to stacks) [16]. The probes were scanned over the object in steps of 2.5 µm, generating at 2,500 positions the nine intensity patterns as recorded by a 100⇥100 pixels (pixel size 8 mm) camera placed in the Fourier plane of a lens of focal length 20 mm. A Poisson random number gen-erator was used in order to mimic the shot noise of the signal. Total number of counts over a frame were typically 200,000. An example of set of intensity patterns is shown on Fig.2.
The vPIE was run using a random distribution of modulus and phase for all components of O(r) as starting guess. The Jones map of the object, as reconstructed after 100 full-scan
itera--3 -2 -1 0 1 2 3
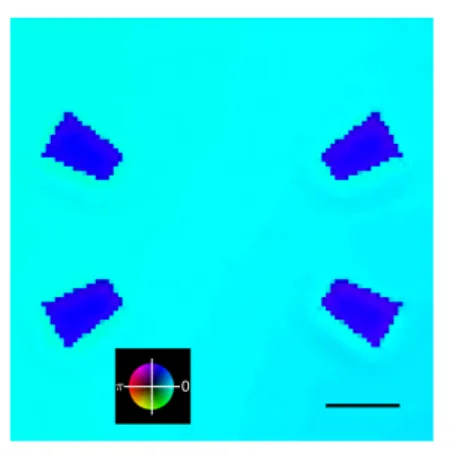
Fig. 4.Retrieved retardance j (colorscale in radians) and fast axis orientation q (represented by superimposed sticks). Scale bar is 20 µm.
0 :
Fig. 5.Complex amplitude of the object as retrieved from a scalar ptychography measurement. Scale bar is 20 µm.
tions with b=0.5, is shown in Fig.3, after subtraction of a global
phase offset to all four components of O(r), in order to ensure an arbitrary phase of zero for rxxin the surrounding medium.
This reconstructed Jones map is in excellent agreement with the simulated one of Fig.1c. The smoothing of the edges was found to be a consequence of the simulated shot noise, which operates a truncation of the highest q values in the intensity patterns (Fig.2) [17]. Since the specimen was made of single layer object, we could produce a more comprehensive picture of the object properties, by retrieving independently the values of retardance
j(r)and fast axis orientation q(r). Mathematically, this was done by solving at every point r the basic matrix equation
O=R( q)W(j)R(q), where R(q) = 2 4 cos q sin q sin q cos q 3 5 and W(j) = 2 41 0 0 exp(ij) 3 5 . The result is shown in Fig.4. The retrieved retardance value of
p/2 for all objects and the radial orientations reproduce very
well the initial model of Fig.1a.
For comparison purpose, the simulated dataset was also processed by the scalar PIE, where we considered as intensity patterns the sum uj,90,0+uj,90,90, which mimics a conventional
scalar measurements carried out using a linearly-polarized light source (here along the y direction) and no polarization analysis. The scalar object, as reconstructed using the same number of iterations and b value, is shown in Fig.5. Predictively, the two blocks located at the top and the bottom of the object are no longer visible, since they have been designed not to produce any phase step in the transmitted field for this polarization orienta-tion. Although the retrieved object looks similar to ryy(Fig.1c),
the obtained complex values are significantly different. For in-stance, within the upper-right block, the modulus is 0.8 vs. 1 for
ryyat the same point in Fig.5, and the phase is 1.27 vs. 1.15. In
addition, the reconstructed surrounding medium exhibits some ghost artefacts. These observations confirm the relevance of the vPIE, as soon as the sample possesses some birefringence properties.
We have run vPIE successfully on a large variety of anisotropic objects. Although only shown here in the case of birefringent objects, we have obtained excellent results for object showing properties of diattenuation, i.e., anisotropic absorbance.
using a vectorial formalism. A criterion has been derived and a measurement scheme using a set of linearly polarized probes and polarization analyzers has been proposed. Simulations show that the full anisotropic properties of the specimen can be effectively retrieved without indetermination. This work opens new perspectives for the exhaustive investigation of anisotropic materials by means of ptychography.
FUNDING INFORMATION
Agence Nationale de la Recherche (ANR) (ANR-11-BS10-0005).
ACKNOWLEDGMENTS
The authors acknowledge Julien Duboisset for fruitful discus-sions.
REFERENCES
1. H. M. L. Faulkner and J. M. Rodenburg, Phys. Rev. Lett. 93, 023903 (2004).
2. M. Mir, Z. Wang, Z. Shen, M. Bednarz, R. Bashir, I. Golding, S. G. Prasanth, and G. Popescu, Proc. Nat. Acad. Sci. 108, 13124–13129 (2011).
3. J. Marrison, L. Räty, P. Marriott, and P. O’Toole, Sci. Rep. 3, 2369 (2013).
4. T. A. Zangle and M. A. Teitell, Nat. Meth. 11, 1221–1228 (2014). 5. L. Shemilt, E. Verbanis, J. Schwenke, A. K. Estandarte, G. Xiong,
R. Harder, N. Parmar, M. Yusuf, F. Zhang, and I. K. Robinson, Biophys. J. 108, 706–713 (2015).
6. K. Katoh, G. Langford, K. Hammar, P. J. S. Smith, and R. Oldenbourg, Biol. Bull. 193, 219–220 (1997).
7. R. Oldenbourg, E. D. Salmon, and P. T. Tran, Biophys. J. 74, 645–654 (1998).
8. M. Wolman and F. H. Kasten, Histochem. 85, 41–49 (1986). 9. L. Beaufort, Micropaleontology 51, 289–297 (2005).
10. M. J. Humphry, B. Kraus, A. C. Hurst, A. M. Maiden, and J. M. Roden-burg, Nat. Commun. 3, 730 (2012).
11. J. M. Rodenburg, A. C. Hurst, A. G. Cullis, B. R. Dobson, F. Pfeiffer, O. Bunk, C. David, K. Jefimovs, and I. Johnson, Phys. Rev. Lett. 98, 034801 (2007).
12. M. Dierolf, A. Menzel, P. Thibault, P. Schneider, C. M. Kewish, R. Wepf, O. Bunk, and F. Pfeiffer, Nature 467, 436–439 (2010).
13. V. Chamard, M. Allain, P. Godard, A. Talneau, G. Patriarche, and M. Burghammer, Sci. Rep. 5, 9827 (2015).
14. A. Tripathi, J. Mohanty, S. H. Dietze, O. G. Shpyrko, E. Shipton, E. E. Fullerton, S. S. Kim, and I. McNulty, Proc. Nat. Acad. Sci. USA 108, 13393–13398 (2011).
15. J. M. Rodenburg and R. H. T. Bates, “The theory of super-resolution electron microscopy via Wigner-distribution deconvolution,” Philos. T. Roy. Soc. A 339, 521–553 (1992).
16. R. C. Jones, “A new calculus formalism for the treatment of optical systems. I. Description and discussion of the method,” J. Opt. Soc. Amer. 31, 488–493 (1941).
17. P. Godard, M. Allain, V. Chamard, and J. Rodenburg, “Noise models for low counting rate coherent diffraction imaging,” Opt. Express 20, 25914–25934 (2012).
18. J. M. Rodenburg and H. M. L. Faulkner, “A phase retrieval algorithm for shifting illumination,” Appl. Phys. Lett. 85, 4795 (2004).
19. E. Collett, Polarized light. Fundamentals and applications (Marcel Dekker, New York, 1993).