HAL Id: hal-01598497
https://hal.sorbonne-universite.fr/hal-01598497
Submitted on 29 Sep 2017HAL is a multi-disciplinary open access archive for the deposit and dissemination of sci-entific research documents, whether they are pub-lished or not. The documents may come from teaching and research institutions in France or abroad, or from public or private research centers.
L’archive ouverte pluridisciplinaire HAL, est destinée au dépôt et à la diffusion de documents scientifiques de niveau recherche, publiés ou non, émanant des établissements d’enseignement et de recherche français ou étrangers, des laboratoires publics ou privés.
Structural changes and picosecond to second dynamics
of cytochrome c in interaction with nitric oxide in
ferrous and ferric redox states
Sergei Kruglik, Byung-Kuk Yoo, Jean-Christophe Lambry, Jean-Louis Martin,
Michel Negrerie
To cite this version:
Sergei Kruglik, Byung-Kuk Yoo, Jean-Christophe Lambry, Jean-Louis Martin, Michel Negrerie. Struc-tural changes and picosecond to second dynamics of cytochrome c in interaction with nitric oxide in ferrous and ferric redox states. Physical Chemistry Chemical Physics, Royal Society of Chemistry, 2017, 19 (32), pp.21317-21334. �10.1039/C7CP02634J�. �hal-01598497�
Structural changes and picosecond to second dynamics of
cytochrome c in interaction with nitric oxide in ferrous and ferric
redox states
Sergei G. Kruglika,*, Byung-Kuk Yoob, Jean-Christophe Lambryb, Jean-Louis Martinb and Michel Negrerieb,*
aLaboratoire Jean Perrin, Sorbonne Universités, UPMC Univ. Paris 06, CNRS, 75005 Paris,
France. E-mail: sergei.kruglik@upmc.fr
bLaboratoire d'Optique et Biosciences, INSERM, Ecole Polytechnique, 91128 Palaiseau,
France. E-mail: michel.negrerie@polytechnique.fr
Electronic supplementary information.
Apart a role in electron transfer, mitochondrial cytochrome c acts in apoptosis and is subject to nitrosylation. The cleavage of the Fe–Met80 bond plays a role in several processes including release of Cyt c from mitochondria or increase of its peroxydase activity. Nitrosylation of Cyt c precludes the reformation of disrupted Fe–Met80 bond and was shown to occur during apoptosis. These physiological properties are associated with a conformational change of the heme center of Cyt c. Here, we demonstrate that NO binding induces pronounced heme conformational changes in the six-coordinate Cyt c–NO complex. Equilibrium and time-resolved Raman data reveal that the heme structural conformation depends on both the nature of the distal iron ligand (NO or Met80) and on the Fe2+ or Fe3+ heme redox state. Upon nitrosylation, the heme ruffling distortion is greatly enhanced for ferrous Cyt c. Contrastingly, the initial strong heme distortion in native ferric Cyt c almost disappears after NO binding. We measured the heme coordination dynamics in picosecond to second time range and identified Met80 and NO rebinding phases by time-resolved Raman and absorption spectroscopies. Dissociation of NO instantly produces 5-coordinate heme with domed structure which continues to rearrange within 15 ps, while the initial ruffling distortion disappears. The rates of Cyt c–NO complex formation measured by transient absorption are
kon = 1.81 × 10⁶ M–1·s–1 for ferric and 83 M–1·s–1 for ferrous Cyt c. After NO dissociation and
exit from the heme pocket, the rebinding of Met80 to the heme iron takes place 6 orders of magnitude slower (3 – 5 µs) than Met80 rebinding in the absence of NO (5 ps). Altogether, these data reveal structural and dynamic properties of Cyt c in interaction with nitric oxide relevant for molecular mechanism of apoptosis.
Introduction
Mitochondrial cytochrome c (Cyt c) acts as an universal electron carrier associated with an oxidase in mitochondria for the energetic process leading to ATP synthesis1, but this small heme protein possesses also other functions2. In particular, it is involved in the mitochondrial apoptosis pathway initiated by the transmembrane FAS receptor activation.3,4 Following caspases activation, the BAK protein triggers the release of Cyt c from mitochondria to cytoplasm through the outer mitochondrion membrane permeabilization.2 Then Cyt c binds to Apaf-1 (Apoptotis protease activating factor) to form the functional apoptosome complex with caspase-9.2,5 Within this apoptotic cascade, many structural mechanisms remain
unknown at molecular level. It has been demonstrated that Cyt c released from mitochondria during apoptosis is nitrosylated,6 the only case of nitric oxide (NO) binding to Cyt c in cell. Indeed, the activation of mitochondrial NO-synthase (NOS) triggers the release of Cyt c from mitochondria,7 wheareas its inhibition of NOS by L-NMA induces an inhibition of apoptosis but the addition of exogenous nitrosylated Cyt c increases caspase activation.6 This signaling event in the apoptotic pathway may be linked to the presence of NO-synthase in mitochondria.8,9 Thus, the diatomic ligand binding property of the heme is also involved in cell death, besides its redox properties involved in its ubiquitous role in electron transfer. NO appears as a messenger which activates apoptosis through its binding to Cyt c, in contrast to its role in inhibiting apoptosis through different signaling pathways.10,11,12
The nitrosylation of Cyt c during apoptosis leads to the hypothesis that protein's structural changes, induced by the replacement of Met80 with NO bound to the heme, promote Cyt c binding to Apaf-1. The redox state of nitrosylated Cyt c released in apoptotic cells is not known,6 but Cyt c may undergo conformational changes in both redox states. Conformational changes of Cyt c were evidenced through a different pathway involving the interaction with cardiolipin internally to mitochondria.13,14,15 In apoptotic cells, a conformational change of Cyt c associated with mitochondria membrane was detected16 whereas the binding of cardiolipin to Cyt c induces a strain leading to the cleavage of Fe−Met80 bond,17 and furthermore, shifts the distribution of conformers population which is linked to its peroxydase activity.14,18
Nitric oxide is the sole gaseous ligand that readily binds to native Cyt c. A structural change in nitrosylated Cyt c is reminiscent of gas-sensors experiencing a conformational
change as a consequence of the cleavage of the stabilizing iron-methionine bond induced by NO binding.19 In order to bind NO, the thermally driven cleavage of the iron-methionine bond must take place transiently in native Cyt c, an effect which was probed by absorption20 and EPR measurements.21 Thus, an equilibrium exists between the six-coordinated (6c-His-Met) and five-coordinated (5c-His) forms of the heme. Indeed, the breaking of Fe−Met bond is induced by a small pH increase with pKa in the range 8.7 − 8.5 and with transition
temperatures in the range 42 − 55 °C for ferric Cyt c from mammal species,20 corresponding to low dissociation energy of 4.18 − 4.85 kJ·mole−1, which is slightly larger for the ferrous state of the heme (> 10 kJ·mole−1).21 These properties rationalize the binding of NO to both redox states of Cyt c. We must also note that in controlled conditions (especially the pH), ferric Cyt c may catalyze the nitrite production from NO,22 but the reverse reaction also takes place from the ferrous nitrosylated form.23
Conformational changes are associated with physiological properties of Cyt c, depend on redox state of the heme and were demonstrated for Cyt c interacting with anionic lipids, with membrane, and upon precisely localized chemical modifications.24 Particularly, it experiences
the so-called alkaline transition (pKa = 9.3), the heme remaining six-coordinate from His-Fe-Met to His-Fe-Lys.1,24 Of particular importance, the binding of NO to horse Cyt c induces the decrease of the rate of electron transfer to thiols by factors of 102 to 104. due to both conformational reorganization and to change in electron pathway.25
Hence, besides its ubiquitous role in electron transfer, Cyt c can be considered as an endogenous heme-binding NO-receptor. In the "classical" NO-receptor soluble guanylate cyclase (sGC), the coordination state of the iron is crucial since the binding of NO triggers the enzymatic activity through the cleavage of the Fe-His bond. Contrary to five-coordinated sGC, the heme of Cyt c is six-coordinated in the resting state, with a proximal histidine (His18) and a distal methionine (Met80) being two axial internal ligands for the heme iron.1 The latter is crucial to maintain Cyt c redox potential.26 The reactivity of these enzymes depends upon the properties of the heme iron which are modulated by coordination with side-chains and by the surrounding protein architecture. NO binding to Cyt c has several consequences: firstly, it locks the distal heme pocket in a configuration imposed by the Fe−Met80 bond cleavage, precluding the Met80 rebinding; secondly, it inhibits the peroxydase activity.27 Furthermore, structural differences exist between the ferric and ferrous states.28
Here we investigate the conformational changes and the coordination dynamics of the heme of mitochondrial horse heart Cyt c upon interaction with NO, both in its ferrous and
ferric states. First we compared the equilibrium nitrosylated structures by Raman spectroscopy, then we probed the heme dynamics and reactivity upon NO photo-detachment by time-resolved resonance Raman spectroscopy (TR3) with subpicosecond resolution and by transient absorption spectroscopy in a time range from picosecond to second. The appearance of the photoinduced 5-coordinate species is followed by ultrafast NO geminate rebinding (ps), then by the rebinding of distal Met80 after the exit of remaining NO molecules from the heme pocket (µs) and then by NO bimolecular rebinding (ms to s). We found that the ferrous and ferric states of nitrosylated Cyt c have different dynamics and reactivity reflecting their structural differences within the heme and its environment. The heme structural distortions (first of all ruffling) appear as a major parameter controlling the properties of the nitrosylated Cyt c, in line with its role in the interaction with anionic lipids27,14 and in apoptosis.6
Experimental procedures
Samples preparationMitochondrial Cyt c (horse heart) was purchased from Sigma-Aldrich. Its purity was
verified by HPLC and it was used without further purification for transient absorption and non-resonance Raman measurements. For resonance Raman studies, Cyt c was further purified by gel filtration (isocratic elution with 100 mM TEA buffer, pH 7.4 on Sephadex G25 and Akta Purifier, GE-Healthcare). The fractions of the main eluted peak absorbing at 410 nm were concentrated by ultra-filtration (5 kDa cut-off membrane, Millipore).
For transient absorption studies, the solution of ferric Cyt c (100 µL, ~50 µM in 10 mM TEA buffer, pH 7.4) was put in a 1-mm optical path length quartz cell (Hellma) sealed with a rubber stopper and degassed by means of four successive cycles of vacuum and purging with pure argon. The ferrous heme was obtained by addition of 10 µL of degassed sodium ascorbate solution (2 mM final concentration). For preparing ferrous NO-liganded Cyt c, gas phase 100% NO (Air Liquide) was directly introduced into the spectroscopic cell (total pressure of 1.2 bar, yielding 2.4 mM of NO in the aqueous phase). For preparing both ferric NO-liganded Cyt c, gas phase 100% NO or 10% NO diluted in pure N2 (Air Liquide) was
used, yielding 2.4 mM and 0.24 mM of NO in the aqueous phase, respectively. Equilibrium spectra were recorded at each step for monitoring the evolution of heme iron coordination state via the Soret-band shift. The absorbance of the sample, measured with a UV-1700
Shimadzu spectrometer, was in the range 0.5–0.8 at the Soret maximum for 1-mm path length.
For steady-state Raman and TR3 measurements, the solution of Cyt c was prepared with 350-500 µM concentration in TEA buffer (10 mM; pH 7.5). The concentration was verified by measuring the absorbance at 530 mM (ε = 12 000 mole–1·L·cm–1) in a 1-mm optical path
length quartz cell (OD of ~0.35−0.5). The sample (1.2 mL) was placed in a large-volume cylindrical quartz cell (Hellma 540-135-QS) closed with a rubber stopper and degassed. Ferrous Cyt c was prepared by injecting the degassed sodium ascorbate (60 µL, 5 mM final concentration) directly into the cell. Nitrosylated complexes of both ferric and ferrous Cyt c were prepared by injection after vacuuming, of 100% NO (at 1.3 bar) into the cell through the stopper, yielding 2.4 mM NO in solution. For steady-state non-resonance Raman measurements, sample preparation procedure was the same, however the samples were placed in a standard rectangular 1-cm quartz cell with a magnetic stirrer for solution mixing. All experiments were performed at room temperature.
Steady-state resonance Raman spectra
Resonance Raman spectra with continuous wave excitation (CW-RR) were recorded using a He-Cd laser and the same Raman setup as for TR3 studies29 (see below). The excitation wavelength of 441.6 nm has been chosen specifically to closely match the probe beam wavelength (435 nm) in TR3 experiments. During the measurements, samples were contained in a spinning cylindrical quartz cell whose rotation speed was adjusted to produce a thin sample layer at the inner wall29 and to assure the absence of noticeable photoinduced changes in the spectra of nitrosylated complexes. Spectral resolution was estimated better than 5 cm−1.
Steady-state non-resonance Raman spectra
CW Raman spectra in non-resonant conditions were measured using a specially constructed NIR-Raman spectrometer30 with the 780-nm excitation provided by a cw Ti:Sapphire laser (Spectra Physics, model 3900S) pumped by an argon ion laser (Spectra Physics, model 2017) working in all-lines mode (pump power 4 W). Samples were contained in a spectrophotometric 1×1×4 cm3 quartz cell with a small magnetic stirrer for fast solution mixing. Raman signal was collected in backscattering geometry with respect to the excitation beam using a 10× objective (Olympus MA10, NA 0.25) and directed through a spectrometer (Acton SpectraPro 2500i) into a liquid-nitrogen cooled back-illuminated NIR-sensitive CCD detector (Princeton Instruments SPEC-10 400BR/LN). Raman frequency calibration was
performed using toluene lines with an absolute accuracy of ±2 cm−1 and relative accuracy of ±1 cm−1. Spectral resolution was 5 cm−1.
Time-resolved resonance Raman spectra
Time-resolved sub-picosecond Raman apparatus has been described in detail elsewhere.29 Briefly, it is based on a femtosecond Ti:Sapphire oscillator and a regenerative amplifier (output beam parameters are: wavelength 810 nm, pulse energy ~0.6 mJ, pulse duration 100 fs, repetition rate 1 kHz) and has 0.7-ps temporal resolution and 25-cm–1 spectral resolution. An optical parametric generator and two optical parametric amplifiers allowed to generate the photodissociating pump pulse (560-570 nm; 2 µJ; ~100 fs), whose delay was controlled by a translation stage, and the Raman probe pulse (435 nm; 25 nJ; 0.7 ps duration; 25 cm–1 spectral width). Both beams were collinearly overlapped by a dichroic mirror. Sample illumination and signal detection was performed in 90° geometry, with excitation coming from the bottom of the spinning cylindrical quartz cell. The detection was performed with a liquid-nitrogen cooled back-illuminated deep-depleted CCD (Princeton Instruments SPEC-10 100BR/LN) at the output of a 1-m focal length spectrometer (Jobin-Yvon HR1000). Raman frequency calibration was performed using Kr and Xe spectral lamps (Oriel) with an absolute accuracy of ±2 cm–1 and relative accuracy of ±1 cm–1. Raman intensity normalization was made using the 980 cm–1 line of ammonium sulfate added as a reference to buffer solution.
The procedure for obtaining the pure photoproduct spectra from raw TR3 data has already been described in detail elsewhere.29 All Raman spectra presented in Fig 1-8 were corrected on slowly changing background due to Rayleigh scattering and residual fluorescence using a cubic spline interpolation in Igor Pro software.
Picosecond transient absorption
Ultrafast transient absorption (TA) measurements were performed with the pump-probe laser system previously described.31 The photo-dissociation of NO was achieved by an excitation pulse centered at 564 nm, in the maximum of the Q0-0-band absorption, with
duration of ~40 fs and a repetition rate of 30 Hz. The broad-spectrum probe pulse was generated from a H2O-cell continuum and was used to monitor the transient absorption
changes within the Soret-band in the range 375–500 nm as a function of delay between pump and probe pulses. The optical path length of the cell was 1 mm. The sample was continuously moved perpendicularly to the laser beam and the temperature was 18 °C. Successive transient spectra as a function of time were recorded with a cooled CCD detector (EGG Princeton
Applied Research), forming a time-wavelength data matrix. Analysis of the data was performed by singular value decomposition (SVD)31,32 of the time-wavelength matrix such that all transient spectral components were identified in the time window 0.5 ps–5 ns. Up to 40 scans were recorded and averaged with a dwell time of 1 s at each individual transient spectrum. The SVD kinetic components associated with SVD spectral components were fitted to the sum of a minimum number of exponential components. Alternatively, kinetics were also extracted at particular wavelengths from the raw data matrix.
Nanosecond to millisecond transient absorption
For this extended time-range we have used a home-built spectrophotometer comprising two lasers which were electronically synchronized and delayed.33 The dissociating pulse of ~6 ns duration was provided by the second harmonic (532 nm) of a Continuum Nd:YAG laser. The probing pulses (6 ns FWHM) were provided by a tunable optical parametric oscillator
(Panther, Continuum) pumped by the third harmonic of a Nd:YAG laser (Brilliant, Quantel) with a repetition rate of 10 Hz. The spectrometer was working in dual-channel mode, with both reference and probe channels equiped with optical fibers for light illumination/collection and diodes as detectors. The sample cell compartments and light collection design allowed recording signal variations ΔOD/OD as low as 10–5. The kinetics of differential absorption
changes were probed at particular wavelengths (absorption bands maxima and isosbestic points) by tuning the OPO. Up to twelve scans were averaged for each kinetics at a particular wavelength. Time delay after the dissociating pulse was changed linearly from 1 to 30 ns; it then was changed with a logarithmic progression from 30 ns to 1 s. The kinetics were globally fitted by using the same time constants for all probe wavelengths.
Results and discussion
Equilibrium structuresResonance Raman spectra of equilibrium Cyt c species. The continuous wave
resonance Raman (CW-RR) spectra of Cyt c in both ferrous and ferric redox states were measured with excitation at 441.6 nm and the native (His–Fe–Met) species were compared to their respective nitrosylated forms (His-Fe-NO) (Fig. 1 and 2). The assignment of Raman bands was made according to Hu et al.34 and is given in Table 1. These spectra disclose numerous bands which are sensitive to the coordination, oxidation and spin states of the
heme34 and some of them are also indicative of the heme non-planarity and structural distortions.35
The CW-RR spectrum of native ferrous Cyt c (Fig. 1a) agrees well with published spectra,13,34,36 within the accuracy of absolute wavenumber calibration (±2 cm–1), and we focus here on the changes induced by NO binding (Fig. 1b). First of all, for nitrosylated ferrous Cyt c we note the appearance of photoinduced spectral changes caused even by very weak CW excitation of a few hundred of microwatts at 442 nm. Therefore the extreme care has been taken in both using microwatt laser powers and subtracting the minor residual photoinduced contribution of His–Fe(II)–Met species from the overall experimental spectrum, in order to characterize the pure nitrosylated His–Fe(II)–NO species.
For both native and nitrosylated ferrous Cyt c the prominent ν(Fe–His) stretching band around 220 cm–1 is not visible, since this mode is not resonantly enhanced for 6-coordinate hemes with the Fe atom located in the heme plan.37 The low intensity ν(Fe-S) stretching mode
has been detected at 351 cm–1 for the oxidized cytochrome P45038 and at 347 cm–1 for chloroperoxidase.39 For the native ferrous Cyt c (His–Fe(II)–Met) a sharp band centered at
345 cm–1 is present (Fig. 1a) while it transforms to a shoulder for the nitrosylated (His–Fe(II)–
NO) species (Fig. 1b). Normally this band is attributed to the porphyrin ν8 mode. Its
disappearance or shifting upon NO binding may be partially related to the Fe–S bond disruption; this assignment must however be verified in future isotopic substitution experiment.
Next, the complex multiband contour within 350–430 cm–1 does not change much its shape upon Cyt c interaction with NO, within the accuracy of our measurements. The most prominent change in the low-frequency range however is a substantial intensity increase of out-of-plane (oop) symmetric pyrrole folding mode γ21 at ~567 cm–1 with respect to other
adjacent modes and to this mode in the spectrum of native ferrous Cyt c. This band is known to be a ruffling distortion marker for c-type heme;33 its intensity is related to the complex non-planar heme distortions, with ruffling deformation being the dominant one,33,40 due to specific thioether linkages with Cys residues of the apoprotein structure. Hence, our Raman data indicate that sustantial heme ruffling is present in the native protein, being further enhanced in the nitrosylated ferrous Cyt c. Interestingly, the conformation of His–Fe(II)–Met80 species is partially determined by the distal link between Fe(II) and the protein via the methionine, so that the heme is expected to become less distorted upon the replacement of Met80 by NO, decoupling the heme from its distal constraint. However, this is not the case: our data reveal the increase of ruffling distortion upon nitrosylation of ferrous Cyt c.
Heme ruffling is a pyrrole-ring torsion with respect to the Fe-Npyr bond axis. It changes
the electron density in molecular orbitals and modulates the heme redox potential, as shown for Cyt c35 and bacterial heme-sensors,41 in line with a direct measurement of the change of redox potential of the heme upon NO binding.25 In ferrous Cyt c the change of heme distortion after NO binding is correlated with the ease of Fe–Met80 bond breaking which is facilitated by simultaneous binding of NO and anionic lipids such as cardiolipin.14,42
Fig. 1. CW-RR spectra of mitochondrial horse heart ferrous Cyt c (traces a) and its nitrosylated complex (traces b). Excitation wavelength 441.6 nm. Laser power was 2 mW for native Cyt c (accumulation time 5 min), and 50 – 400 µW for nitrosylated complex (accumulation time 20 min). Small photoinduced contribution of His–Fe(II)–Met species in the spectrum of His-Fe(II)-NO complex has been removed by weighted subtraction. Asterisks denote the residual ascorbate contribution. Assignments are given in Table 1.
In the high-frequency range (Fig. 1b), the prominent oxidation state and π-electron density marker band ν4 experiences large frequency upshift from 1361 to 1375 cm–1 upon NO
binding indicating rather large change in electronic distribution for a low-spin six-coordinate heme (His–Fe2+–NO). The frequencies of other marker bands43 ν2, ν3, ν11 and ν10 correspond
well to a small core size and low-spin state of the 6c heme iron, whatever the nature of the distal ligand, Met80 or NO. We note, however, that the bands ν3, ν11, and ν10 experience
variable upshifts upon Met80→NO exchange (1491→1497 cm–1, 1546→1564 cm–1, and 1621→1631 cm–1 respectively), while the band ν2 experiences small downshift (1592→1590
cm–1). A complicated interplay of electronic and structural perturbations of the ferrous heme upon NO binding could be a possible reason for such a contrasting behavior of high-frequency Raman markers.
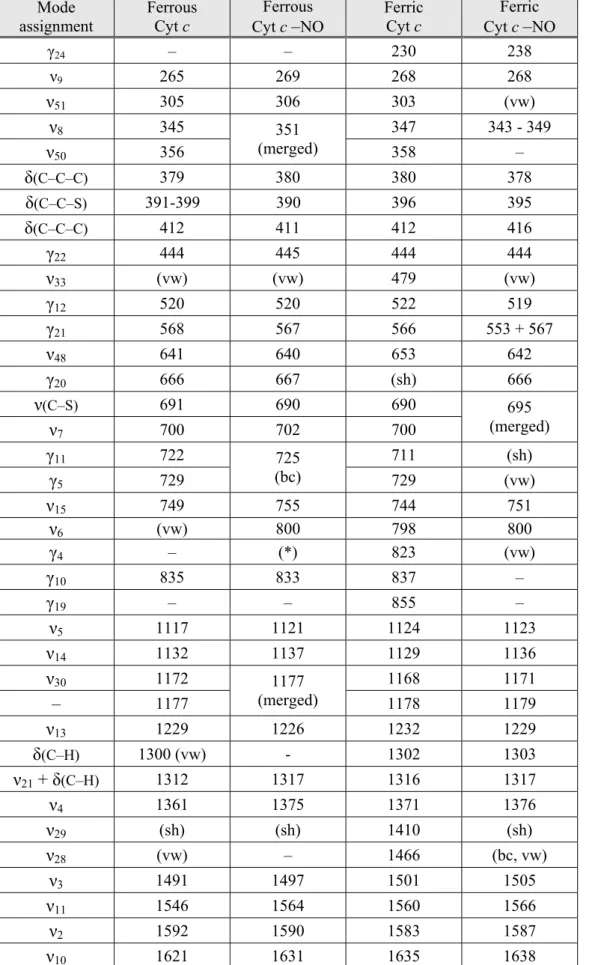
Table 1. Assignment and band frequencies (cm–1) in Raman spectra of ferrous and ferric Cyt c and
their nitrosylated complexes recorded with excitation at 441.6 nm (data from Fig. 1, 2 and 5). Mode assignment Ferrous Cyt c Ferrous Cyt c –NO Ferric Cyt c Ferric Cyt c –NO γ24 – – 230 238 ν9 265 269 268 268 ν51 305 306 303 (vw) ν8 345 347 343 - 349 ν50 356 351 (merged) 358 – δ(C–C–C) 379 380 380 378 δ(C–C–S) 391-399 390 396 395 δ(C–C–C) 412 411 412 416 γ22 444 445 444 444 ν33 (vw) (vw) 479 (vw) γ12 520 520 522 519 γ21 568 567 566 553 + 567 ν48 641 640 653 642 γ20 666 667 (sh) 666 ν(C–S) 691 690 690 ν7 700 702 700 695 (merged) γ11 722 711 (sh) γ5 729 725 (bc) 729 (vw) ν15 749 755 744 751 ν6 (vw) 800 798 800 γ4 – (*) 823 (vw) γ10 835 833 837 – γ19 – – 855 – ν5 1117 1121 1124 1123 ν14 1132 1137 1129 1136 ν30 1172 1168 1171 – 1177 1177 (merged) 1178 1179 ν13 1229 1226 1232 1229 δ(C–H) 1300 (vw) - 1302 1303 ν21 + δ(C–H) 1312 1317 1316 1317 ν4 1361 1375 1371 1376 ν29 (sh) (sh) 1410 (sh) ν28 (vw) – 1466 (bc, vw) ν3 1491 1497 1501 1505 ν11 1546 1564 1560 1566 ν2 1592 1590 1583 1587 ν10 1621 1631 1635 1638
In the CW-RR spectrum of native ferric Cyt c (Fig. 2a), the intense and sharp band located at 347 cm–1, assigned to ν8, is also present but weakened after NO binding (Fig. 2b),
again suggesting a possible contribution of the ν(Fe-S) stretching mode.38,39 The triplet pattern
at 380 – 412 cm–1, assigned to δ(C-C-C) and δ(C-C-S) deformations is not influenced by NO
binding. Remarkably, the oop rufling marker mode γ21 at 566 cm–1 appears sharp and intense
for native ferric Cyt c but becomes very weak upon binding of NO, in stark contrast to the case of ferrous heme. The behavior of γ21 implies very strong non-planar heme distortion in
native ferric Cyt c, larger than in the native ferrous state, in agreement with the heme ruffling deduced from low vibrational modes (40 – 300 cm–1).35,44 Such a stronger heme distortion in the native ferric form with respect to the ferrous one was also revealed in the iso-1-Cyt c by their compared X-ray structures.45
Fig. 2. The same as in Fig. 1, but for ferric Cyt c. Laser power was 2 mW for all spectra, photoinduced changes have not been observed. Accumulation time was 5 min in the high-frequency range and 10 min in the low-frequency range. Assignments are given in Table 1.
Concerning the nitrosylated ferric Cyt c, the mode ν33 at 479 cm–1, which corresponds to
in-plane pyrrole rotations, vanishes in the presence of NO, while many weak non-planar low-frequency Raman modes (γ22, γ12, γ21, γ20) are still discernible in Fig. 2b. These findings
suggest that the heme macrocycle in His–Fe(III)–NO configuration is much less distorted although still not planar as compared to the very distorted native His–Fe(III)–Met80 structure. The conclusion is further supported by Raman bands transformation in 650 – 900 cm–1 region (Fig. 2). Indeed, we observe a down-shift of the band ν7 from 700 to 695 cm–1 after NO
binding (becoming merged with the ν(C-S) mode from the thioether heme-protein bond at 690
cm–1), which is also sensitive to heme distortion.46 Furthermore, the binding of NO induces an intensity increase of the band ν15 (751 cm–1) together with its upshift and the remarkable
disappearance of the triplet at 823 – 855 cm–1, assigned to the Cm–H out-of-plane modes γ4,
γ10 and γ19 in the spectrum of native ferric Cyt c.
In the high-frequency range, the marker band ν4 experiences a small upshift from 1371
to 1376 cm–1 upon NO binding (Fig. 2) again indicative of a low-spin 6c-NO nature of the ferric heme. This conclusion is further supported by the behavior of other marker bands, ν2,
ν3, ν11 and ν10, all experiencing rather small frequency upshifts upon NO replacing Met80. Non-resonance Raman spectra of equilibrium Cyt c species. In an attempt to probe the
effects of NO binding on the overall protein structure, we have also recorded the non-resonant Raman spectra of native and nitrosylated Cyt c with near-infrared excitation at 780 nm (Fig. 3 and 4; Table 2).
We first note that many heme modes dominate the spectra despite the non-resonant excitation conditions, which therefore can be better characterized as "pre-resonant". Non-totally symmetric B1g modes (ν10 – ν15) are predominantly enhanced, while totally symmetric
A1g modes are generally absent, with the exception of the mode ν2 which is however rather
weak. The positions and shifts of the porphyrin Raman bands observed with resonance excitation (Fig. 1 and 2) are well reproduced in non-resonant conditions, for both Cyt c redox states. Most conspicuously, the modes ν10 (1621 – 1638 cm–1), ν11 (1546 – 1566 cm–1), and
ν15 (744 – 756 cm–1) behave exactly as in resonant conditions. Concerning the heme ruffling
distortion, the intensity changes of the oop marker γ21 in 565 – 568 cm–1 range, occurring in
opposite directions for ferrous and ferric heme species (Fig. 1 and 2), are also detected with a 780-nm excitation (Fig. 3 and 4), confirming the difference in structural impact of NO binding to the heme iron.
Several characteristic Raman bands of the protein structure are observed. The doublet 822/828–851 cm–1 (Fig 3 and 4) is assigned to the four Tyr side-chains47,48 being hidden in resonance conditions. Indeed, in the RR spectrum of ferric Cyt c, the triplet at 823–837–855 cm–1 due to γ4, γ10 and γ19, close to the Tyr bands, vanishes after NO binding and is absent in
the resonant spectra of its ferrous form independently of NO (Fig 1 and 2). Contrastingly, the 823–850 cm–1 doublet from Tyr is present in non-resonance Raman spectra of both native and nitrosylated Cyt c, in both redox states without any change, indicating that nitrosylation does not perturb neither the environment of the Tyr phenol, nor the hydrophilic/hydrophobic character of interactions in which Tyr are involved.48,49 In both oxidation states there is no
change for the Phe (1003 cm–1), the protein bending δ(C-H2) (1447 cm–1) and the Amide I
(1656 cm–1) bands assigned to helical structure without β-sheet. In the ferric state, the intensity of the band at 1284 cm–1 due to mode δ(CaH)2,4 increases after NO binding, showing
some localized conformational changes of the side-chains. The frequency of Amide I in our steady-state Raman data very well matches that measured by transient IR spectroscopy which revealed a slight increase of its intensity upon NO dissociation but no shift.50
Fig. 3. CW non-resonance Raman spectra with excitation at 780 nm of mitochondrial horse heart ferrous Cyt c (trace a) and its nitrosylated complex (trace b). Laser power 100 mW, total accumulation time 20 min for native Cyt c and 50 min for its nitrosylated complex. Photoinduced changes were not observed. Water buffer contribution is subtracted. Assignments are given in Table 2.
Fig. 4. The same as in Fig. 3, but for ferric Cyt c. Laser power 100 mW, total accumulation time 15 min for both spectra. Water buffer contribution is subtracted. Assignments are given in Table 2.
Overall, the non-resonance Raman spectra do not provide evidence of substantial changes of the secondary or tertiary apoprotein structure induced by heme nitrosylation in both oxidation states, while some rather weak changes localized to the heme and heme pocket have been observed. In the absence of NO, the native ferric and ferrous forms also differ only by the changes localized in the heme and its pocket, in agreement with the compared structures in both redox states of horse,28 tuna,51 and yeast45 Cyt c.
Table 2. Assignment and band frequencies (cm–1) in Raman spectra of ferrous and ferric Cyt c and their nitrosylated complexes recorded with excitation at 780 nm (data from Fig 3, 4 and 6).
Mode assignment Ferrous Cyt c Ferrous Cyt c –NO Ferric Cyt c Ferric Cyt c –NO γ21 568 565 (bc) 568 – Tyr + ν48 642 643 641 643 Thioether ν(Ca-S) +ν7 (bc) (bc) 701 (bc) 690 (bc) ν15 750 756 744 751 ν6 (vw) 800 798 (sh) Tyr 828 827 823 822 Tyr 851 851 851 851 ν46 937 (bc) 928 (bc) 932 (bc) 937 (bc) Backbone ν(Cα–C) 968 973 (bc) 973 973 Phe 1003 1003 1003 1003 νsym(NO3–) – 1048 – 1048 ν5 1118 – – – ν14 1131 1125 (bc) 1128 1125 (bc) Tyr + ν30 1172 1175 1169 1173 Phe + Tyr 1206 (vw, sh) 1206 1208 ν13 1229 1229 1233 1229 δ(CaH)2,4 – (vw, bc) – 1284 δ(CaH)2,4 1316 1319 1316 1319 (bc) ν12 1362 1368 1368 1368 Protein δ(CH2, CH3) 1448 1448 1448 1448 ν11 1546 1564 1560 1566 ν2 1592 1591 1583 1587 ν37 (sh) 1600 (sh) 1600 ν10 1621 1631 1635 1638 Amide I 1657 1657 1656 1656
Electronic and structural similarities and differences between redox states of nitrosylated Cyt c. Comparison of the porphyrin marker bands in the high frequency range for
nitrosylated Cyt c (Fig. 5 right panel and Fig. 6) illustrates the consequences of NO binding as a function of the redox state. Several factors influence the intensities and the frequency positions of these markers: porphyrin core size, Fe spin state, Fe coordination state, heme structure distortions, and π-electron density distribution. Remarkably, the frequencies of the modes ν4 and ν11 are very close for both redox states of nitrosylated Cyt c, while the mode ν2
and especially the modes ν3 and ν10 exhibit frequency differences beyond the accuracy of
measurements (3 ≤ Δν ≤ 8 cm–1). These frequency differences are however much less
pronounced than in the case of the two redox states of native Cyt c (Δν ≤ 14 cm–1) (Table 1,
columns 2 and 4). Such a behavior, especially of the electron density marker mode ν4,
indicates similar π-electron configurations of the porphyrin macrocycle for the heme–NO complex in both redox states.
Fig. 5. Comparison of CW-RR spectra in characteristic frequency ranges of ferrous (b, red curves) versus ferric (a, green curves) forms of nitrosylated Cyt c, with excitation at 442 nm. The spectra were normalized and arbitrary shifted along the Raman intensity axis for visual convenience of bands comparison. Bands assignment is shown on top of both panels.
The frequency of the mode ν4 is also the same for Fe(III)–NO and Fe(II)–NO in
myoglobin52,53 (Mb) and horse radish peroxydase51 (HRP) and close to that of native proteins
with ferric heme. We may conclude that the π-electron density of the porphyrin core is generally similar for ferric and ferrous nitrosylated hemes, both b- and c-types. However for Cyt c the pattern of modes ν3 – ν10 retains its relative intensity ratios, contrary to Mb and
The shift of ν4 frequency of the Fe(II)–NO Cyt c species (1375 cm–1) toward the value
characteristic for Fe(III) is explained by the iron dπ electron withdrawal from the porphyrin π*
orbitals,54 mimicking the Fe(III) d-electron configuration, in the process of competitive bonding with NO π* orbitals (so-called π-backbonding).54,55 At the same time, the σ-bonding between π* orbital of NO and dz2 orbital of low-spin Fe(II) which is orthogonal to the
macrocycle plane, does not perturb the porphyrin π-electronic system and consequently does not change the ν4 frequency. The exact electronic charge distribution for Fe(II)–NO versus
Fe(III)–NO bonds in Cyt c cannot be infered from our data. However, the direct measurement of the ν(NO) stretching frequency (1922 cm–1) for nitrosylated ferric Mb56 revealed slightly electron deficient NO ligand resulting in a resonant species Fe–N≡O+ and not the NO–
anion.57 The true electronic configuration has consequences on NO dissociation: as noted by Hunt and Lehnert,55 there could be an apparent contradiction between the very high dissociation energy barrier (~30 kcal·mol–1)58 and the fast rate of NO dissociation (koff) which
is larger than that for the ferrous species. However, in ferric heme model the resonant species Fe(II)–NO+ was shown to cross (within ~0.2 Å of the Fe–NO elongation) the two potential
energy surfaces of the LS and HS Fe(III)–NO states, the latter one being dissociative.58
Fig. 6. Comparison of CW Raman spectra of ferrous (red curve) versus ferric (green curve) of nitrosylated Cyt c, with non-resonance excitation at 780 nm. The spectra were normalized for the convenience of bands comparison.
Another remarkable feature is the prominent change in the heme structure induced by NO binding, namely the drastic intensity decrease of the ruffling marker band33 γ21
being strongly enhanced for the ferrous form (Fig. 5, left panel, and Fig. 6). The intensity of this band is directly proportional to the degree of ruffling distortion of the heme.33 Noticeably, this band disappears for the membrane-bound Cyt c, having more planar heme structure,35 suggesting a role in electron transfer for this conformational feature. This is exemplified by the peroxydase activity of Cyt c in the presence of anionic lipids correlated with the breaking of the Fe(II)–Met80 bond, in the absence or presence of NO.14 The conclusion that the nitrosylated ferrous Cyt c possesses much more ruffled structure than its ferric analogue is corroborated by the frequency downshifts of the marker bands ν3 and ν10 which are also
sensitive to ruffling distortion.42
Importantly, several other oop Raman bands, namely γ20 (anti-symmetric pyrroles
folding, 666 – 667 cm–1)34 and γ22 (pyrroles swivel, 444 – 445 cm–1)34 remain the same for
both redox states (Fig. 5, left panel) suggesting that the heme macrocycle distortions other than ruffling are still present for the nitrosylated ferric Cyt c. On the other hand, the relaxation of heme distortion induced by NO binding to the ferric Cyt c is sustained by the disappearance of the oop γ4, γ10, γ19 (823 – 855 cm–1) modes, a behavior not observed for
nitrosylated ferrous Cyt c. We thus infer a decrease of the heme ruffling distortion59 and a
more relaxed heme conformation upon NO binding to ferric Cyt c, in contrast with ferrous Cyt c, which exhibits very strong non-planar ruffled heme distortion, in spite of similar π-electron density distribution for both redox states. We conclude that the heme macrocycle ruffling distortion evolves in opposite ways in ferric and ferrous Cyt c upon binding of NO to the heme iron at the distal location, replacing Met80, but these conformational changes are not driven by the Met80 detachment.
Ultrafast structural changes
TR3 spectra of nitrosylated ferrous Cyt c. The TR3 study of vibrational relaxation of
native horse heart Cyt c in both oxidations states have already reported.31 Structural dynamics of nitrosylated ferrous Cyt c has also been reported with the emphasis on retardation of the iron motion following NO geminate rebinding, via the picosecond intensity evolution of Fe-His Raman stretching band.60 Here we report an extended TR3 data set for nitrosylated Cyt c with the main focus on ultrafast heme structural changes after the event of NO dissociation. TR3 spectra of nitrosylated ferrous Cyt c in the first 25 ps after NO photo-detachment are presented in Fig. 7 and the corresponding bands assignment is given in Table 3. We emphasize that the transient difference Raman spectra at positive time delays represent the pure photo-product species since the contribution of the non-excited molecules was
subtracted, as already described.29 These spectra disclose broader bands compared to CW-RR spectra due to the lower spectral resolution (25 cm–1) of the 0.7-ps probing pulse.
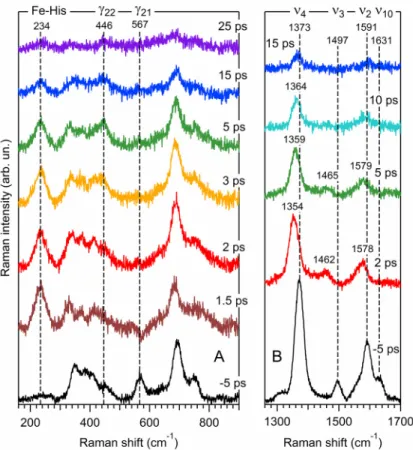
Fig. 7. TR3 Raman spectra of nitrosylated ferrous Cyt c, at different time delays between pump and
probe pulses. Traces at Δt = –5 ps correspond to measured spectra; traces at positive time delays are difference spectra representing the photoinduced transient species. The position of several characteristic Raman bands is outlined by vertical dashed lines. The assignments are given in Table 3.
In the high frequency range the ν4 band appears shifted at time delay Δt = +2 ps, from
1373 to 1354 cm–1, which is not its position for the native His–Fe(II)–Met 6-coordinate species (1361 cm–1; Fig. 1a) but corresponds to that of a 5c-HS transient species after NO dissociation. The subsequent upshift of the mode ν4 to 1364 cm–1 at +10 ps is due to heme
vibrational and structural relaxations.31 The mode ν3, very sensitive to the heme out-of-plane
distortions, is located at 1497 cm–1 in the ground state His–Fe(II)–NO (–5 ps) and experiences an immediate downshift to 1462 cm–1, a value corresponding to a 5c-HS ferrous heme, as observed after the dissociation of NO from myoglobin60 and hemoglobin61 whereas it appears at 1491 cm–1 for the native 6c-LS His–Fe(II)–Met80 (Fig. 1a). Similar frequency downshifts of the mode ν3 were also observed for other 5c-HS species like microperoxidase36 or a
fragment of ferrous Cyt c.62 Similarly, the mode ν2 at 1590 cm–1 shifts to 1578 cm–1 and
simultaneously decreases in intensity as observed for myoglobin.60 Lastly, the band ν10 at
dissociation. Thus, the photoproduct spectra in Fig. 7 correspond to the transient 5c-HS His– Fe(II) Cyt c and their overall decrease in intensity with time is due to the reformation of the ground-state 6c-LS species His–Fe(II)–NO in picoseconds, through NO geminate rebinding, and not Met80 rebinding, for the major part (~98%, see below) of the photo-dissociated molecules.
In the low frequency range, the spectral evolution of the ferrous Cyt c shows remarkable features (Fig. 7A). The appearance of the ν(Fe–His) stretching mode at 234 cm–1, which is resonantly enhanced only for a non-planar ferrous heme37,63 and appears transiently in Cyt c, reveals the heme doming induced by NO dissociation.60 The ruffling marker γ21 at 567 cm–1
vanishes immediately after NO dissociation, indicating a relaxation of ruffling distortion in the transient His-Fe(II). The in-plane mode ν8 downshifts from 345 to 335 cm–1, which is not
its frequency neither for His–Fe(II)–Met (Fig. 1a) nor for His–Fe(II)–NO (Fig. 1b) species. The modes δ(C-C-C) and δ(C-C-S) within the pattern at 360–420 cm–1 and more notably the
out-of-plane pyrroles swivel mode γ22 at 446 cm–1 change their relative intensities with the laps of
time from 1.5 to 25 ps. All together, these spectral changes reflect complicated heme macrocycle structural rearrangement after NO dissociation.
Table 3. Assignment and bands frequencies (cm–1) in TR3 spectra
of nitrosylated ferrous Cyt c, presented in Fig 7 and 8.
Ferrous
Cyt c –NO Cyt c (b) Ferrous Mode
assignment
Ground state Photoproductat 2 ps Photoproductat 2 ps
ν(Fe–His) – 234 216
ν8
ν50
345
(merged) (merged) 335 (merged) 333
δ(C–C–C) 370 374 δ(C–C–S) 400 – 372 δ(C–C–C) 412 414 411 γ22 450 446 (bc) – γ21 567 (vw) – ν(Ca–S) + ν7 694 688 685 ν15 750 751 (bc) 764 (bc) ν4 1373 1354 1345 ν3 1497 1462 1454 ν2 1591 1578 1571 ν10 1631 – –
(a) vw: very weak band; sh: shoulder; bc: broad contour. (b) from Ref. 31 and 64.
In the case of ferric nitrosylated Cyt c, the 5-coordinate species produced after NO photodissociation exhibits a Soret transient absorption maximum around 390 – 400 nm (see TA data below) and cannot be efficiently probed by TR3 with excitation at 435 nm. Indeed, the resulting transient Raman spectrum (data not shown) is dominated by vibrationally excited 6-coordinated nitrosylated ferric Cyt c, while the contribution from the five-coordinate species is impossible to separate due to lack of resonance enhancement. The photodissociation of NO from the ferric heme was nevertheless confirmed and probed by TA (see below).
Ultrafast dynamics of 5-coordinate heme structure after NO dissociation. The
transient 5c-HS species can be produced by photodissociation of either NO or Met80.31,64 First we note one important similarity between their respective transient spectra (Fig. 8): the disappearance of the ruffling marker band γ21 at 567 cm–1. This is an evidence of the
immediate structural rearrangement of the 5C-HS species following the detachment of the sixth distal ligand, which is dominated by the heme doming and results in suppression of ruffling distortion for both NO and Met80, the heme being decoupled from distal constraints, but not from cysteine links with apoprotein structure.
We discuss now the following interesting and unexpected finding concerning transient 5c ferrous Cyt c species. Despite the general similarity of TR3 spectra at Δt = +2 ps, several porphyrin marker band frequencies, together with the ν(Fe–His) band position and intensity of the 5c-HS His-Fe(II) species after NO photodissociation differ substantially from those of the same 5c-HS species but produced after Met80 photodissociation31 (Fig. 8, Table 3).
Fig. 8. Comparison of TR3 difference spectra at time delay Δt = 2 ps between pump and probe pulses,
for transient five-coordinate species obtained after NO photo-detachment from nitrosylated ferrous Cyt
Since at a few picosecond time delay the heme structure is not fully relaxed yet, we infer the following origins of the observed phenomenon. The initial equilibrium heme structures, nitrosylated His–Fe(II)–NO versus native His–Fe(II)–Met80, are subject to different non-planar distortions, the nitrosylated heme being more ruffled one (Fig. 1). Consequently, the non-equilibrium transient species produced immediately after the distal ligand detachment must also start from and evolve into different conformations. Moreover, the nearest environment in the heme pocket is also different for these two distal ligands. Thus, spectral differences are expected for Raman bands sensitive to oop heme macrocycle distortions in the range 300 – 650 cm–1. Time evolution (Fig. 7A) of the mode γ22 at ~446 cm–1, present only
for the nitrosylated Cyt c, is especially revealing, as it directly demonstrates the macrocycle structural rearrangement with time for 5C-HS heme. Supporting the equilibrium data, these transient spectra prove that the 6-coordinate species His–Fe(II)–NO and His–Fe(II)–Met80 do not possess similar heme conformation.
It is known that the frequency of iron-histidine stretch ν(Fe–His) decreases upon increase of the iron oop displacement.37 Hence, a large difference in ν(Fe–His), which is 234
cm–1 after NO dissociation and 216 cm–1 after Met80 dissociation (Fig. 8), reveals that the
central iron is displaced much further away from the heme plane towards proximal histidine in the case of methionine detachment. Since the total excitation energy is provided by the same photodissociative ~100-fs pulse at 565 nm in both cases, the effect may originate from the difference in energy required to break the distal Fe–Met80 bond as compared to Fe–NO bond. From the proximal side, the ν(Fe–His) position may also be influenced by the initial Fe-His bond strength of the equilibrium 6C-LS heme. Large ν(Fe–Fe-His) upshift of 18 cm–1 is indicative of a weaker Fe-His bond for nitrosylated ferrous Cyt c as compared to the native protein.
An analogous effect was reported for soluble guanylate cyclase and its isolated β1 heme
domain, which exhibit ν(Fe–His) at 204 and 213 cm–1 respectively, immediately after CO photodissociation,65 the latter structure of β1 heme domain being less constrainted.66
In the high-frequency range (Fig. 8, right panel), all Raman markers for the 5C-HS species of native protein at Δt = 2 ps are systematically downshifted with respect to the nitrosylated complex, a behavior due to structural differences in the initial equilibrium 6C structures (Fig. 1).
We studied the complete picture of heme coordination dynamics after the triggering event of NO photodissociation, from picosecond to second by time-resolved absorption. The structural events which occur in the picosecond to nanosecond time range differ from those occurring in the microsecond to second time range, we will describe successively the heme dynamics in these two time ranges, as they were recorded with two different TA techniques, for both redox states of nitrosylated Cyt c.
Ultrafast heme coordination dynamics in the picosecond time range. Ferrous Cyt c–
NO. The binding of NO to ferrous Cyt c induces only a small shift (–3.5 nm) of the Soret
maximum (Fig. 9A). The event of NO photodissociation is identified by the intense Soret-band bleaching which appears immediately at 412 nm accompanied by two induced absorption bands on each side (Fig. 9B). These spectral features decrease rapidly within the 500-ps time range. The time × wavelength matrix of induced absorptions (containing all transient spectra) was analyzed by singular value decomposition (SVD) yielding a main spectral transient component which is conspicuously different from the equilibrium difference between the spectra of native and nitrosylated Cyt c (Fig. 9C). The induced absorption band centered at 432 nm is characteristic of a ferrous five-coordinate heme and the induced band at 375 nm corresponds to the change of the δ band. Consequently, the decrease of this transient spectrum with time is due to geminate rebinding of photodissociated NO, with the kinetics being fitted by a multiexponential function (Fig. 9D). The fast initial phase (τex = 2.5 ps)
corresponds to the relaxation of vibrational excited states of the heme31 and will not be further discussed. The geminate rebinding of NO to the 5c-His heme occurs in two phases having well separated time constants (τG1 = 9.2 ps and τG2 = 55 ps) and contrasted relative amplitudes
(A1 = 92.7% and A2 = 5.7%). The time constant of NO geminate rebinding measured by IR
transient spectroscopy50 (7 ps) appears slightly faster than our value τG1, similarly to what is
observed in the case of myoglobin.67,60 The difference between the time constants from IR and TA experiments is explained by a delay between the Fe–NO interaction (probed by the NO stretch) and the subsequent stabilization of the electronic orbitals of the heme following NO binding (probed by transient absorption).60
Importantly, fitting over the entire 0.5-ns time range yielded a constant component (AC =
1.5%) which reveals the proportion of NO exiting from the heme pocket and the protein core. After 0.5 ns the induced absorption spectrum keeps the same shape and no other process is detected up to 5 ns. (previously,60 a shorter recorded time range did not allow to observe the 55-ps component with small amplitude).
500 520 540 560 580 600 0 0.025 0.05 0.075 0.1 550 564 520.5 541 380 400 420 440 460 480 500 Cyt c(II) Cyt c(II) + NO Difference -0.1 0 0.1 0.2 0.3 0.4 0.5 A b so rb an ce Wavelength (nm) 415.5 412 A 419 407 413 430 360 380 400 420 440 460 480 Cytc(II)-NO 1 ps 2 ps 3 ps 5 ps 8 ps 12 ps 16 ps 24 ps 40 ps 50 ps 200 ps 500 ps -0.08 -0.06 -0.04 -0.02 0 0.02 D iff e ren tial a b sor b an ce Wavelength (nm) 412 B 422 380 400 420 440 460 SVD spectrum Equil. spectrum N or m al iz ed d iff er e nt ial a bs o rb a nc e Wavelength (nm) 412 C 419 408 432 6c-NO 5c-His 6c-Met 6c-NO 0.1 1 10 100 log [time(ps)] τG1 = 9.2 ps τG2 = 55 ps τex = 2.5 ps 0 10 20 30 40 50 Am pl itud e o f S V D c o m p on e nt Time (ps) D
Fig. 9. (A) Equilibrium spectra of ferrous Cyt c with and without NO. (B) Differential transient spectra of ferrous Cyt c at various time delays after photodissociation of NO. (C) The main SVD spectral component globally extracted from all transient spectra is compared with the steady-state difference. The coordination states of the heme are indicated. (D) Fitted kinetics of the SVD spectral component with the position of time-constants displayed on a log scale.
Ferric Cyt c–NO. The Soret-band maximum of native ferric Cyt c (408.5 nm) is characteristic
of 6-coordinate ferric hemes and shifts to 416.5 nm upon the binding of NO (Fig. 10A) to give a 6c-NO heme. The photodissociation of NO is identified by the intense instantaneous bleaching at 416 nm, accompanied by a broad induced absorption band centered at 385 nm (Fig. 10B) characteristic of a ferric 5-coordinate heme.68 On the other side, only a largely spread absorption with very low intensity appeared, in contrast to ferrous Cyt c. The time ×
wavelength matrix of induced absorptions analyzed by SVD yielded a main spectral SVD
transient component which is conspicuously different from the equilibrium difference spectrum (Fig. 10C).
360 380 400 420 440 460 480 500 520 Cyt c(III) Cyt c(III) + NO Difference -0.4 -0.2 0 0.2 0.4 0.6 0.8 1 A bso rb a n ce Wavelength (nm) A 408.5 416.5 402 418 480 500 520 540 560 580 600 0 0.02 0.04 0.06 0.08 562 529 530 360 380 400 420 440 460 480 1 ps 2 ps 3 ps 5 ps 8 ps 13 ps 24 ps 40 ps 200 ps 500 ps -0.16 -0.12 -0.08 -0.04 0 0.04 Di ffer e n tia l ab so rb an ce Wavelength (nm) Cyt c(III) + NO B 416 429 403 360 380 400 420 440 460 480 Equil. difference SVD spectrum N o rm a liz e d di ffe re nt ia l ab so rb a nc e Wavelength (nm) C 6c-NO(His) 6c-Met(His) 5c-Met 0 20 40 60 80 100 Am pl itud e o f SVD c om pon en t Time (ps) D 0.1 1 10 100 log [time(ps)] τG1 = 10.3 ps τG2 = 54 ps τEX = 5.5 ps
Fig. 10. (A) Equilibrium spectra of ferric Cyt c with and without NO. (B) Differential transient spectra of ferric Cyt c at various time delays after photodissociation of NO. (C) The main SVD spectral component extracted from transient data is compared with the steady-state difference. The coordination states of the heme are indicated. (D) Fitted kinetics associated with the SVD spectral component. The position of time-constants are displayed on a log scale.
The kinetics of main spectral SVD component (Fig. 10D), due to geminate NO rebinding, were fitted with a multiexponential function. The fast initial phase (τex = 5.5 ps)
corresponds to the vibrational relaxation of the heme.31 The geminate rebinding of NO to the 5c-His ferric heme occurs in two phases having well separated time constants (τG1 = 10.3 ps
and τG2 = 54 ps) the first one having a relative amplitude (A1 = 88%) 10-fold larger than the
second one (A2 = 8.5%). Fitting the kinetics over the entire 500-ps range yielded a constant
component (AC = 3.5%) corresponding to the proportion of NO exiting from the heme pocket
and the protein core. When probed by IR transient absorption,69 the NO geminate rebinding was fitted with a stretched exponential function [exp(−(t/7 ps)0.7] which should include the second component that we measured.
Subsequent heme coordination dynamics in the nanosecond to second time range.
The yield of photodissociated NO molecules that do not geminately rebind to the heme and are going out of the heme pocket was found to be very low: 1.5% for ferrous and 3.5% for ferric Cyt c. Therefore, studying the subsequent slower stages of heme coordination dynamics requires a different approach. Fortunately, it is possible to increase the proportion of NO molecules exiting from the heme pocket and thus to enhance the TA signal at nanosecond and longer time delays by using a 6-ns pump pulse, which induces many cycles of NO photodissociation followed by geminate rebinding, hence increasing the yield of NO release per pulse.
Ferrous Cyt c–NO. The subsequent slower dynamics of heme coordination in ferrous
Cyt c after NO photodissociation was probed at five particular wavelengths (Fig. 11) and the transitions were identified by global analysis of the simultaneous evolution of the induced absorption and bleaching at the five wavelengths. First we note that the kinetics at 411 and 415 nm should start with a bleaching signal, according to the transient spectrum measured at 0.5 ns (Fig. 9). However all five kinetics start with a sharp decrease of the transient absorption with two successive time constants τ1 = 6 ns and τ2 = 0.5 µs that can neither be assigned to
Met80 nor to NO geminate rebinding because of the decrease of positive amplitude at 411 and 415 nm instead of an increase from bleaching. We therefore interpret this signal as a photoreaction of the 5c His-Fe(II) heme repeatedly excited by the intense 6-ns dissociating pulse with a possible charge transfer with relaxation time constants τ1 = 6 ns and τ2 = 0.5 µs.
This hypothesis originates from the absence of such phenomenon in the case of ferric Cyt c (see below). Thus, for ferrous Cyt c, the heme coordination dunamics was analyzed starting from ~1 µs after NO photo-dissociation.
Two transitions present the same evolution (Fig. 11): an absorbance increase at 411, 415 and 418 nm (formation of the 6c His–Fe2+–Met80) with a simultaneous absorbance decrease at 425 – 430 nm (disappearance of the 5c–His–Fe2+). This behavior is the signature of the Met80 rebinding which thus occurs with two phases with time constants τ3 = 5 µs and τ4 =
200 µs. Indeed, these transitions cannot be attributed to NO rebinding which would instead lead to a decrease at 415 and 418 nm, as observed for the slow 5-s transition, unambiguously assigned to NO bimolecular rebinding from the solution. The amplitude is veryy low at 430 nm, this wavelength being very close to the isosbestic point for Met80 rebinding. The two constants suggest the presence of two conformations for the 5c ferrous state having different energy barriers for Met80 recombination.
After the Met80 rebinding, the observed amplitude of NO bimolecular rebinding is low due to the very close Soret maxima of native (411 nm) and nitrosylated (415 nm) forms, yielding a very small absorption difference. It occurs with a time constant of 5 s in the presence of [NO] = 2.4 mM, yielding an association rate constant kon = 83 M–1·s–1. This slow
association rate is due to the need for Met80 to dissociate before NO can approach the heme iron in the distal pocket and explains the accumulation of some dissociated ferrous species during the steady-state Raman measurement, even at low power.
10-8 10-7 10-6 10-5 10-4 10-3 10-2 10-1 100 101 411 nm 415 nm 418 nm -1 0 1 2 3 Time (s) τ3 = 5 µs τ2 = 0.5 µs τ4 = 0.2 ms Cyt c (II) + NO 2 mM τ5 = 5 s τ1 = 6 ns D iffere ntia l ab sorb a nc e ( X 10 3) 10-8 10-7 10-6 10-5 10-4 10-3 10-2 10-1 100 101 430 nm 425 nm 0 1 2 3 4 Time (s) τ3 = 5 µs τ2 = 0.5 µs τ4 = 0.2 ms Cyt c (II) + NO 2 mM τ1 = 6 ns Diff e re ntia l ab so rb anc e (X 10 3)
Fig. 11. Kinetics of the heme coordination in ferrous Cyt c after photodissociation of NO recorded at five particular wavelengths from 1 ns to 5 s with concentration [NO] = 2.4 mM. For the choice of the wavelegnths, see the differential spectrum at equilibrium in Fig. 8A. The kinetics are not normalized and the amplitude represents the differential absorption. The curves are fits to a function of five exponential components whose time constants are indicated by the red vertical lines. The transition τ3
is not observed at 411 nm, whereas the transition τ4 is within the noise at 430 nm.
Ferric Cyt c–NO. The TA kinetics after NO photodissociation from ferric nitrosylated
Cyt c was similarly recorded at eight particular wavelengths (Fig. 12). The Met80 rebinding is identified by an absorbance decrease at 392 nm which corresponds to the disappearance of 5c His–Fe3+ (Fig. 12A), accompanied by an absorption increase at 406 – 408 nm, wavelengths close to the maximum of the Soret band of 6c His–Fe3+–Met80 species (Fig. 12B). There are two such transitions, occurring with successive time constants τ1 = 40 ns and τ2 = 3.3 µs, the
latter one having a larger amplitude. The rebinding of the distal Met80 with two different time constants again suggests the existence of two different configurations of the ferric Cyt c.
The bimolecular NO rebinding corresponds to a simultaneous decrease of the differential amplitude, absorption or bleaching, at all wavelengths. It is readily identified by
changing the NO concentration by a factor of 10, which shifted the observed transition by one decade, from 0.23 ms to 2.2 ms, for respectively 2.4 mM and 0.24 mM of NO (Fig. 12C and D). This yields an association rate constant kon = 1.8 × 10⁶ M–1·s–1. A second transition
occurred at τ4 = 88 ms ([NO] = 2.4 mM) and ~300 ms ([NO] = 0.24 mM) with similar spectral
signature, which is thus also assigned to bimolecular rebinding (the transition τ4 does not
appear shifted by a decade probably because of the loosely defined baseline after 0.3 s). Again, the presence of two transitions, both assigned to bimolecular rebinding, suggests the existence of two different conformations of ferric Cyt c, a hypothesis supported by the fact that after the first NO rebinding (τ3) the differential amplitude kinetics at 407–408 nm became
positive (at ~0.5 ms) implying that the two conformations of ferric Cyt c do not have exactly the same Soret maximum. No transitions other than Met80 and NO rebinding were identified.
A C D 10-9 10-8 10-7 10-6 10-5 10-4 10-3 10-2 10-1 100 392 nm 404 nm 406 mn 407 nm 408 nm 410 nm 418 nm 424 nm -8 -6 -4 -2 0 2 4 6 D iff er enti al a bsor bance (X 10 3) Time (s) τ4= 88 ms τ3= 0.23 ms τ1= 40 ns τ2= 3.3 µs 10-9 10-8 10-7 10-6 10-5 10-4 10-3 10-2 10-1 100 392 nm 406 mn 407 mn 409 nm 418 nm 424 nm -8 -6 -4 -2 0 2 4 6 Time (s) τ2= 3.2 µs τ1= 55 ns τ3= 2.2 ms τ4= 300 ms D iff er enti al a bsor bance (X 10 3) 10-9 10-8 10-7 10-6 10-5 10-4 10-3 10-2 10-1 100 406 mn 407 nm 408 nm -2.0 -1.6 -1.2 -0.8 -0.4 0 0.4 0.8 Time (s) τ2= 3.3 µs τ1= 40 ns τ3= 0.23 ms τ4= 88 ms B 10-9 10-8 10-7 10-6 10-5 10-4 10-3 10-2 10-1 100 406 mn 407 mn 409 nm -3 -2 -1 0 Time (s) τ4= 300 ms τ3= 2.2 ms τ2= 3.2 µs τ1= 55 ns
Fig. 12. Kinetics of the heme coordination in ferric Cyt c after photodissociation of NO recorded from 1 ns to 1 s at two different NO concentrations. (A) Kinetics at eight particular wavelengths, not normalized, for [NO] = 2.4 mM. (B) The kinetics at wavelengths close to the isobestic point of Met80 rebinding (see Fig. 7) are enlarged for [NO] = 2.4 mM. (C) Kinetics at six particular wavelengths for
[NO] = 0.24 mM. (D) Enlarged kinetics close to the isobestic point of Met80 rebinding for [NO] = 0.24 mM. The curves are fits of the data points to a function comprising four exponential components whose time constants are indicated by the red vertical lines.
These observations imply that the interconversion between both ferric Cyt c conformations must be slower. We cannot deduce the interconversion rate from our data. However, since the association rate kon is strongly influenced, the conformations at the heme
level should be markedly different between both populations, consistent with a rather high energy barrier which should favor a slow interconversion.
Dynamics of NO rebinding. The main component of NO geminate rebinding to both
ferrous and ferric Cyt c is very fast (9.2 and 10.3 ps) with large amplitude. It is the faster rebinding measured among 5c-His heme proteins (Tables 4 and S1) being however slightly slower than that observed for NO rebinding to the 4-coordinate heme proteins (7.5 ps) whose bond between iron and the proximal His is cleaved after NO ligation.66,70,71 In the latter case, the very fast NO back ligation is due to the high reactivity of the 4c-heme whereas for 5c-His Cyt c the very fast NO rebinding is due to steric factors which increase the energy barrier preventing the exit of NO from the heme pocket, most probably due to the distal methionine which did not yet rebind to the iron after 0.5 ns. Although the geminate yield is as large as that measured for 4c-hemes (98.5%) it differentiates from these proteins by the presence of two geminate components, as observed for myoglobin72 and for the L16A mutant of the
bacterial NO-carrier cytochrome c’ from Alcaligenes xylosoxidans.73 In both redox states NO geminate rebinding occurs with a second phase having same time constant (55 ps) and a small proportion of NO exiting the heme pocket (1.5 – 3.5%). Thus the second component τG2 does
not depend on the redox state of the heme and we assign it to a protein structural feature. Since the transition τ3 depends upon [NO] we calculated kon = 1.8 × 10⁶ M–1·s–1 for
ferric Cyt c–NO formation, based on τ3 = 0.23 ms in the presence of 2.4 mM NO (at 20 °C).
This is much larger than the estimated value (7.2 × 10² M–1·s–1) from an early flash-photolysis study74 which assigned the transition at 0.2 ms to a structural rearrangement rather than to NO bimolecular rebinding.74 The ferric Cyt c–NO association rate thus appears of the same order of magnitude as other ferric heme proteins75 and especially is the same as in ferric nitrophorin but ten times faster than in ferric Mb. In the presence of cardiolipin bound to the ferric Cyt c two bimolecular rebinding components were observed,42 one yielding exactly the same kon
(1.8 × 10⁶ M–1·s–1) as we measured (the other component yielded 0.55 × 10⁶ M–1·s–1). This suggests that one of these species in the presence of cardiolipin keeps the native conformation of ferric Cyt c.
Table 4. Time constants and amplitudes of the transitions in the time range 1 ps – 5 s.
Transition 2.4 mM NO Ferric Cyt c 0.24 mM NO Ferric Cyt c Ferrous Cyt c 2.4 mM NO
NO geminate rebinding τG1 τG2 constant – 10.3 ± 0.5 ps (88) a 54 ± 7 ps (8.5) (3.5) 9.2 ± 0.5 ps (92.7) 55 ± 8 ps (5.7) (1.5) τM1 40 ± 20 ns (30)a 55 ± 20 ns (40) 5 ± 1 µs (70) Met80 rebinding τ M2 3.3 ± 0.5 µs (70) 3.2 ± 0.7 µs (60) 200 ± 100 µs (30) τ3 0.23 ± 0.02 ms (95) 2.2 ± 0.1 ms (85) – τ4 88 ± 20 ms (5) 300 ± 50 ms (15) 5 ± 1 s NO bimolecular rebinding kon (b) 1.8 × 10⁶ M–1·s–1 1.8 × 10 6 M–1·s–1 83 M–1·s–1
(a) Relative amplitudes (%) of the components. The vibrational relaxation is not included, only the heme coordination changes.
(b) For the ferric form kon corresponds to the major transition τ3, but to the unique τ measured for the
ferrous form.
The faster kon for ferric compared to ferrous Cyt c originates from the low energy of
thermal breaking of the Fe–Met bond which is already broken at 59 °C,76 (but this bond cannot be photolyzed in the ferric state,31 and the cleavage occurrs through a different process). Contrastingly, the Fe–Met in ferrous Cyt c bond is stable even at 80 °C,77 and should break only transiently at very slow rate so that it decreases the NO association rate kon
as low as 83 M–1·s–1.
Comparison with other Heme Proteins. The interaction of NO and other diatomics with
various heme proteins sensors which are 5-coordinated in native state has been rationalized using a "sliding scale rule".78 The behavior of Cyt c (which does not bind CO and O
2) appears
clearly determined by its 6th heme ligand Met80 and cannot be described by this rule, likewise
the sensor Dos which discloses similarly low association rates (1.1 – 2.6 × 10³ M–1s–1)79 and does not discriminate the three diatomics NO, O2 and CO.
Dynamics of methionine rebinding. The cleavage of the Fe–Met80 bond plays a role in
processes such as the cardiolipin-Cyt c interaction14 and Cyt c release from mitochondria during apoptosis.80 Here, we identified and separated the Met80 and NO rebinding based on their spectral signatures. The kinetics in the 1 ns – 1 s time range demonstrate that for both ferric and ferrous nitrosylated Cyt c the distal ligand Met80 recombines much slower than NO geminate rebinding, but much faster than NO bimolecular rebinding. Two distinct rates of Met80 recombination are observed (Table 4), revealing two conformations: the major (70%) conformation has same rate in both oxidation states (3.3 – 5 µs), whereas the minor