tonsumer Analysis to Evaluate R&D Projects
John R.
Hauser
WP #1245-81
September 1980
F---Consumer need is the dominant force in successful technological innovation. This paper presents a consumer analysis methodology that provides R&D management with diagnostic information to evaluate and improve new technology. Consumer theory, measurement, model estimation, diagnostic output, and managerial actions are all illustrated by application to telecommunications innovation.
Acknowledgement
This research was funded by a grant from the National Science Foundation contract number DS176-09479, Stuart Meyer principal investigator. I wish to thank Bobby Calder, Joni Hersch, Sidney Levy, Diana Marek, Nabuo Matuski, Leon Moses, Steven Shugan, Paul Shuldiner, and Alice Tybout who were involved in
various stages of the NSF project. In particular, Pat Lyon has been extremely helpful in tne statistical analyses and in the model development.
I
~1''"11"`-"~x"""I-"---·-In order to survive firms must innovate and innovation means new products, new technology, and new production techniques. For example, in 1978 alone
private industry spent over 20.5 billion dollars on research and development (R&D) (Business Week, 7/2/79). But new technology is not sufficient for profitability. Profits come from sales and sales come from products that fill consumer needs. Utterback (1974), in a review of studies spanning over 2,000 products and 100 industries, indicates that 60-80% of the successful innovations come from an identification of a consumer need. Meadows (1969) presents evidence that
innovations based on consumer need are more likely to produce incremental sales for the innovating firm than innovations based purely on new technology. Finally, a series of studies by von Hipple (1976, 1977 a,b,c) suggest that the user plays a dominant role i the success of R&D.
Thus, to facilitate the effectiveness of R&D spending, marketing must provide diagnostic information on consumer needs. This does not mean that marketing directs R&D but rather that marketing provides key inputs to enhance the creativity of R&D and to focus problem solving on those technologies that
fulfill consumer needs. For example, in Allen's (1966, 1978) working model of the R&D problem solving process, some of the key steps are to generate
critical dimensions, rank these dimensions on the level of importance, and evaluate alternatives with respect to these dimensions. In another example, von Hipple (1976) suggests that successful technology fulfills consumer's
"dimensions of merit." Identifying these dimensions, establishing the
importance of these dimensions, and evaluating technologies relative to these dimensions are all marketing tasks that can be accomplished by the analysis of
consumer perceptions and preferences.
This paper formalizes the consumer input to R&D with marketing theory and measurement methodology.; We draw on consumer theory such as Brunswik's
(1952) Lens model and models of new product concept evaluation (Shocker and Srinivasan 1978) to illustrate how R&D-can be improved with marketing analysis. We present,the analysis through an application to the development of new
telecommunication technology. (Over 990 million dollars was spent on tele-communications R&D in 1978. Business Week 7/2/79.)
The specific case is a study funded by the National Science Foundation to develop telecommunication technology to enhance communication within government research centers and to lead to decreased travel and its inherent cost and energy usage. The particular technology is slow-scan televideo equipment which can transmit still pictures over ordinary telephone lines. This technology can not transmit motion such as transmitted with closed circuit
telephone or with AT&T's Picturephone, but t is significantly less expensive to install and use than these technologies. The target group is scientists, engineers, and managers at one of the scientific laboratories funded by the U.S. Department of Energy. This laboratory, Los Alamos Scientific Laboratories, has component groups in New Mexico, Nevada, California, and Washington, D.C. Although the basic underlying slow-scan technological capability exists, the
(applied) R&D task is to refine the technology to increase consumer acceptance. Possible improvements include increased resolution, faster transmission, hard
copy availability, reduced size of unit, and other design improvements. Since each improvement requires research effort and ultimately increases the production cost of the units, marketing's task is to direct the development along those dimensions most likely to increase consumer acceptance.
We begin by briefly reviewing the model. We then present the detailed analysis and resulting managerial actions.
III
-3-Consumer Analysis Model
We select our analysis procedure based on the needs of the R&D team. In particular we want to identify the consumer benefits that the technology is to provide if it is to satisfy an, as yet unfulfilled, market need.
Since R&D is early in the design of the technology we focus first on perceived needs. By focusing on perceived needs rather than physical
features we identify what consumers want but we do not limit the options of the R&D team. R&D can focus on known physical characteristics or adapt, adopt, or invent new physical characteristics in order to deliver the consumer benefits. Once R&D develops the physical characteristics that can deliver consumer
benefits, followup marketing research will fodus on selecting those physical characteristics that best deliver the perceived benefits.
Consumwner ModeZ
Brunswik's Lens model (1952) is a widely accepted conceptual model of consumer behavior that isolates physical and perceptual dimensions of merit and shows their impact on behavior. By doing our marketing analyses within
such a conceptual framework we insure that we identify those needs that affect ultimate sales and profitability.
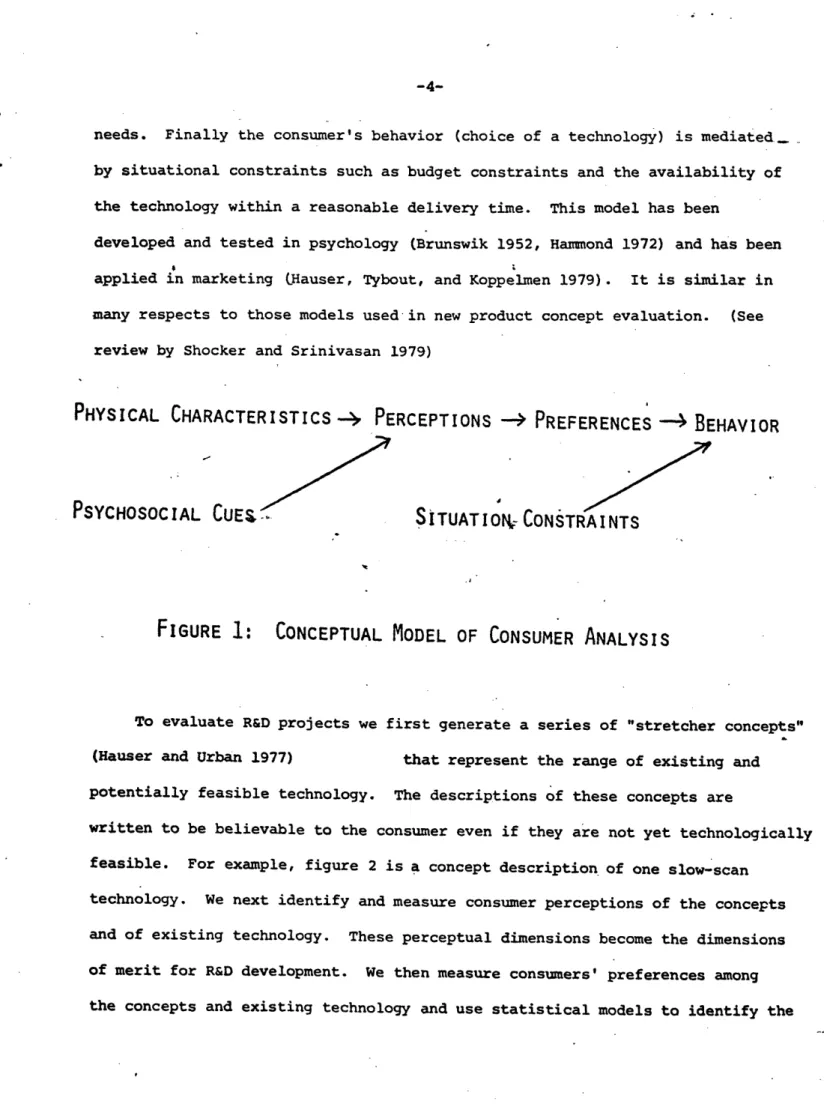
The conceptual model is given in figure 1. The R&D task is to improve the physical characteristics, but physical characteristics (proximal cues) are influ-enced by psychosocial cues such as advertising (a marketing function) and
mediated by consumers' abstraction of the benefits of the technology into percep-tions. The consumer forms his preferences for specific technologies by evaluating technologies with respect to his perceptions'of all available technologies that may fulfill his
needs. Finally the consumer's behavior (choice of a technology) is mediated _ by situational constraints such as budget constraints and the availability of the technology within a reasonable delivery time. This model has been
developed and tested in psychology (Brunswik 1952, Hammond 1972) and has been applied in marketing Hauser, Tybout, and Koppelmen 1979). It is similar in many respects to those models used in new product concept evaluation. (See
review by Shocker and Srinivasan 1979)
PHYSICAL CHARACTERISTICS -- PERCEPTIONS -- PREFERENCES -4 BEHAVIOR
PSYCHOSOCIAL CUE
SITUATION CONSTRAINTS
FIGURE
1:
CONCEPTUAL MODEL OF CONSUMER ANALYSIS
To evaluate R&D projects we first generate a series of "stretcher concepts" (Hauser and Urban 1977) that represent the range of existing and potentially feasible technology. The descriptions of these concepts are
written to be believable to the consumer even if they are not yet technologically feasible. For example, figure 2 is a concept description of one slow-scan
technology. We next identify and measure consumer perceptions of the concepts and of existing technology. These perceptual dimensions become the dimensions of merit for R&D development. We then measure consumers' preferences among the concepts and existing technology and use statistical models to identify the
I
III
-5-relative importances of the dimensions of merit. These -5-relative importances
plus consumer's perceptions of existing technology identify market gaps where--R&D can achieve a competitive advantage for the innovating firm. Finally, we model the impact of preference and situational constraints on choice by estimating a forecasting model that can predict how many consumers will choose a particular technology if one is developed to fill the market gap. This last step enables R&D to evaluate whether ultimate sales is sufficient to pursue the development of technology to meet the market needs. (For the telecommunications case, the National Science Foundation was interested in usage rather than sales, thus in our analyses we focus on use rather than purchase.)
Figure 2
RROW-BA D VIDEO TELEPHONE (NBYT)
h IUrre-lsad Videf Teloehone (:%'VT) talowi the user to transmlt eitt pictures of himself, dtrslas. drbimls, written material. on eqelipment over cdinorJ tlephone grade lines. Input is vii a TV caarsa4
ilsplay is oen standard TV set. he ability of YVT to repreu.:e detail and shades of gray is similar to
that of ordJnary ItV. In essence. ';T s i11 transmitting viewgraphs, such as ne eight use with an over-head projector, over teleyhone lines. HIwver, with SYr the user can moke ptctures on the spot and edit
these pictures efoe translitting them.
so tf. catiO of oth teleh.la natw cor 1is rTMired. Units osa be placei at any elephon 'ocst on Ming either an acoustic rcoupler or peranent Jack. This rskes NiYT portable, resdily available, and allows Lndviduals to use it in their oa offices. Furthernore, because .lYt traisits over ordinary tele-phow lines there are no additional costs associated with its se once the basic qlprcrt has been
purchased.
While WVT can be used with only one telephone line, ordir.rily an additional line is dedicated to voice transaisson. Aything .hic% can be viewed by a re cacrs asay be sent, but it takes 30 seconds to
transfer a or.letely new picture. C::e a picture is rrc:eive, it is stored in Mrory and can be displaye indefinitely on a TV sonitor. In 'Jitio, because t systen is naro-band, bo-h audio and video trans-mssion can be recorded on the stcrcc tracks of an crJ.-~-*y c-', caesete. rith the cassette systen it Is possible to call and receive cJlls froa an unttended ter.iral.
A variety of additional featurc arr possible -ith NST. These are stza-ri:ed below. · voice-grade crypto units can provide st;.re tr;ns.assion when refuired
* conferacing features of the uJlio tel;-ho,e network
hAigher resolution ani color
malts ae svailable which can display rsre than one stared picture simultaeously (n to unitors) or switch fren cne stored picture to another nsatanansly
toe showid assume that at least ene SVTY unit will be aailible in wver building on 3 ninues ote. Assume that special units with the dditiena features listed above will be available on ·a
Measurement
Our analysis is based on the psychometric measurement described in Hauser and Urban (1977), but modified to take explicit account of the conceptual
model. For related models see Green and Wind (1973) and Shocker and Srinivasan (1979). onsumers evaluate concepts and existing technology on 20-25 five-point agree-disagree scales developed from focus groups and previous analyses. These are factor analysed to identify the 2-6 dimensions of merit. Preferences
are measured by having consumers rank order the concepts and existing techno-logies. A monotonic maximum likelihood statistical analysis called logit analysis (McFadden 1970) is used to estimate the relative importances of the perceptual dimensions. (The dependent measure is first preference and the explanatory variables are the factor scores forethe perceptual dimensions.
The estimated s-weights are interpreted as the relative-importances.) Preference and situation constraints then become explanatory variables in a logit analysis that uses observed choice among existing alternatives as the dependent measure. This last analysis enables us to forecast sales and usage.
In addition to statistical estimation of perception, preference, and choice models we examine the data in light of the conceptual model. If the conceptual model is an adequate description of consumer behavior, then physical charac-teristics should correlate highly with at least one perceptual dimension. perceptions should correlate with preference, and preference should correlate with choice. Also perceptions should correlate more highly with preference than do physical characteristics and preference should correlate more highly with choice than do the perceptual dimensions. Besides providing a test of
1-1^11-
1 _
__
I
i
I
-7-the consistency of -7-the conceptual model with- the data,-this correlational analysis identifies which physical characteristics are related to which perceptual dimensions and hence helps identify some of the physical features R&D can consider improving.
Details of the data collection and the statistical models are contained in the next section.
Consumer Identification
The potential technology may not serve, or need to serve, all consumers in the market. Many markets are sufficiently large that a new technology can succeed if it serves well only a segment of the market. Thus we search for and test subgroups of the potential market to identify whether varying preferences allow us to target a particular group of consumers.
In addition we identify which consumers most favor the new technology. These 'innovators" play a special role in R&D since they are the target market for introduction of the technology. Since sales or usage grow over time as the technology penetrates the market, innovators may be necessary to maintain sales in the early years of introduction.
Sales can later decline if replacement sales do not
grow to match the drop in first time sales that occurs as the market becomes saturated. For example see Bass (1969) and Midgley (1976).
Analysis of Telecommunications Technology
Data Collection
The data was collected by a questionnaire mailed to 800 scientists, engineers, and managers chosen randomly from the staff directory at Los Alamos Scientific Laboratory. Questionnaires were developed through focus groups (Calder 1977) and multiple pretests on samples of the target
popula-tion. The response rate was 53.6%, or a total of 429 returned questionnaires. Respondents were asked to rate personal visit, telephone, and three
stretcher concepts: Narrow Band Video Telephone (NBVT), Closed Circuit Television (CCTV), and either Facsimile Transfer Device (FAX) or Teletype
(TTY). (NBVT is given in figure 1, FAX transmits hard copy only, and TTY is similar to a computer terminal.) Respondents also indicated which technology they now use and what their preferences are for the five technologies they rated. To achieve a random distribution across usage we asked respondents to rate and evaluate the technologies with respect to their "most recent
interaction with a colleague, or a vendor, etc." Finally we asked respondents to describe their most recent interaction and to give their demographic
profile so that we could segment consumers and/or identify innovators.
To test consumer reaction to the availability of NBVT we randomly varied the NBVT concept that consumers received. Fifty percent received the concept in figure 2, fifty percent received a description that was identical except they ere told to assume every office had an NBVT. There was no significant difference (.05 level) in response rate or demographic variables among
-9-Perceptions
The twenty-five attribute scales were factor analyzed (common factor
analysis to identify dimensions then principal components factor analysis
to verify the structure - see Rummel 1970). For telecommunications we selected to factor dimensions based on interpretability and statistical
criterion (elbow and eigenvalue rules - see Rummel 1970). The dimensions were labeled effectiveness and ease of use based on the factor loadings in table 1.
Table 1
Factor Analysts of Perceptual Measures Effectiveness exchange scientific and
technical information .58
find and reach right person .14
saves time -.07
do not need -u4sual aids .12
takes little time -.20
eliminates paperwork .24
can persuade people .63
personalities do not interfere -.20 convey all forms of information .55
no hassle to use -. 13
avoid negative impression .09
security is no problcn .12
no need to plan far in advance .07
elimirates red tape .23
monitors people, operations,
experiments .61
high level of human interaction .78
solve problems .59
express feelings .54
dlfficult to misinterpret informatten .50
good for group discussion .66 inexpensive way to interact -.19 quick response in crisis .12 enhance idea development ,66
get commitment .48
maintain contact with my field .45
Ease of Use -.12 .23 .65 -.08 .63 .48 -.18 -.06 o.17 .66 o.04 -.02 .62 .49 .15S -. 02 -.36 .17 ..01 -.05 .60 .17 .30 .40 2
We first standardize the scales by individual to remove scale bias and minimize halo effects.
-Support for ConceptuaZ Model
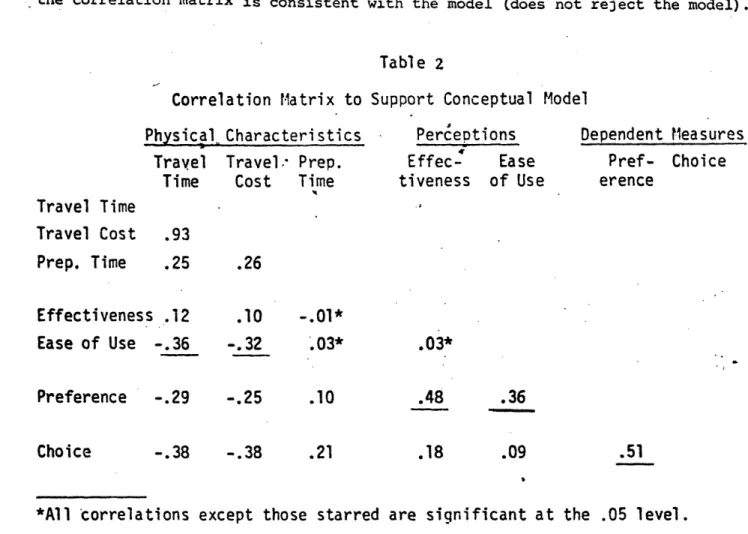
-Before we estimate the preference and choice models we examine whether the correlations among variables support the conceptual behavioral model in figure 1. Basically we expect physical characteristics such as travel time, travel cost, and preparation time to be highly orrelated with at least one
perceptual variable. Perceptual variables should correlate with preference
and preference should be highly correlated with choice. As shown in table 2, the correlation matrix is consistent with the model (does not reject the model).
Correlation Matrix to
Physical Characteristics
Travel Travel. Prep.
Time
Cost
Time
Table
Support Conceptual I
PerceDtions
Effec-
Ease
tiveness of Use
'odel
Dependent Measures
Pref- Choice
erence
Travel Time
Travel Cost
Prep. Time
.93
.25
Effectiveness .12
Ease of Use -.36
Preference
-.29
Choice
-.38
-.25
-.38
.10
.21
.48
.36
_ _.18
.09
.51
*All correlations except those starred are significant at the .05 level.
.26
.10
-.32
-. 01
*.03*
.03*
.-III
-11-Preference Ana Zysis
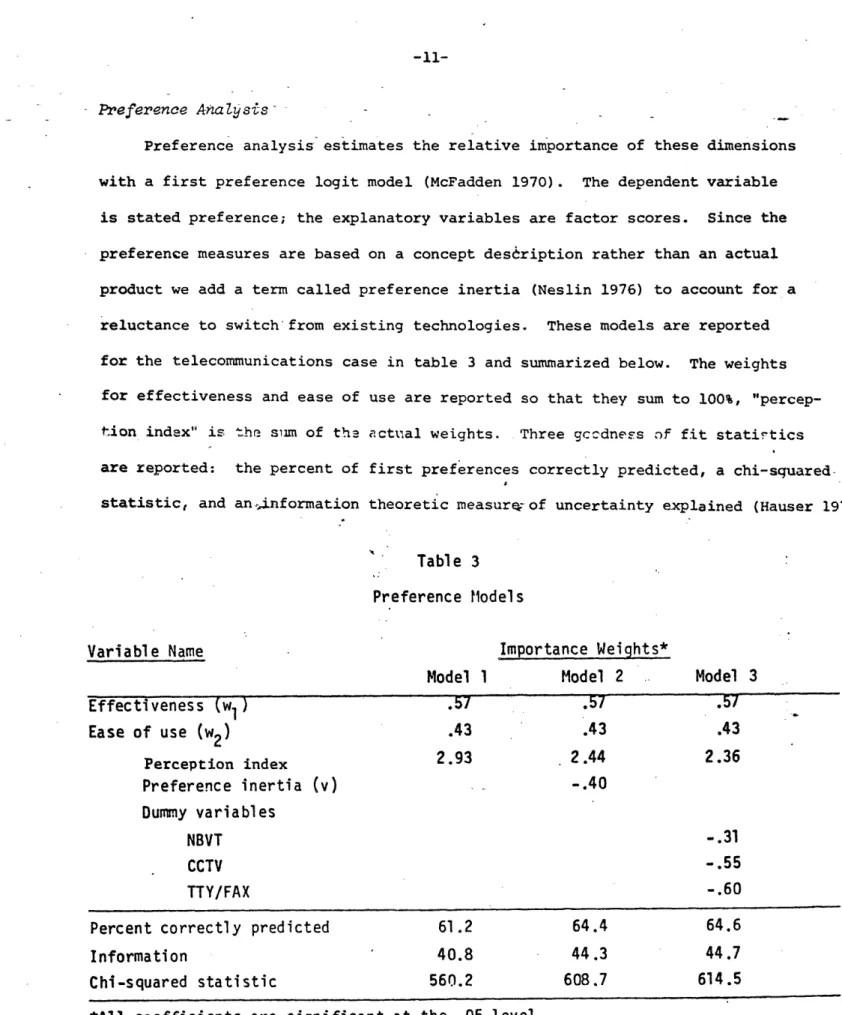
-Preference analysis estimates the relative importance of these dimensions with a first preference logit model (McFadden 1970). The dependent variable is stated preference; the explanatory variables are factor scores. Since the preference measures are based on a concept description rather than an actual product we add a term called preference inertia (Neslin 1976) to account for a reluctance to switch from existing technologies. These models are reported for the telecommunications case in table 3 and summarized below. The weights
for effectiveness and ease of use are reported so that they sum to 100%, "percep-tion index" is the sun of the actual weights. Three gccdness of fit statistics are reported: the percent of first preferences correctly predicted, a
chi-squared-statistic, and an-.information theoretic measure-of uncertainty explained (Hauser 1978.
Table 3
Preference Model s
Variable Name
Impor
Model 1
Effectiveness (w
i)
.57
Ease of use (w
2)
.43
Perception index 2.93Preference inertia
(v)
Dummy variables
NBVT
CCTV
TTY/FAX
Percent correctly predicted
61.2
Information
40.8
Chi-squared statistic
560.2
*All coefficients are significant at the .05 level.
tance Weights*
Model 2
.57
.43
2.44
-.40
64.4
44.3
608.7
3
Model
.57
.43
2.36
-.31 - .55 -.6064.6
44.7
614.5
.-In model 1, the factor scores alone are used to predict preference. Effectiveness is shown to be somewhat more important than ease of use. In model 2, the preference inertia component is shown to add significant (.05 level) explanatory power. The negative sign for v indicates a true inertia effect. inally model 3 shows that there is nonsignificant variation (.05
level) in preference inertia by concept statement. Based on this analysis model 2 was selected.
In general the models do quite well in explaining preference. Model 2 correctly predicts 64.4% of the preferences and explains 44.3% of the
urcertainty. These predictions are significantly better (.01 level) than an equally likely model (20%, 0%). In each of the models effectiveness accounts for 57% Pothe importance while ease of use accounts for 43%.
Choice Prediction Model
To predict the impact of changes in perception and preference we link preference to choice. No situational constraints are included in the model ·
since none were measured for the existing technologies - telephone and personal visit. The model is the multinomial logit model with last choice among
existing alternatives as the dependent variable and the.preference index (weighted sum of factor scores since preference inertia is identically zero for existing alternatives) and any surrogates for situational constraints as explanatory variables. The models are reported in table 4. In general the information and chi-squared statistics are smaller because two rather than five technologies are involved and because the shares of telephone and personal visit are nearly equal. All predictions are significantly better (.01 level) than an equally likely model.
-13-Table 4
Choice Models
Variable Name
Importance Weights
A. Preference
B. Modified
C. Revealed
Index " Preference Index Preference
Effectiveness (w
1)
.57
.57
.55
Ease of Use (w
2)
.43
.43
.45
Preference index
1.00
1.38
1.38
Surrogate variable - -.
43
-.37*
Percent correctly predicted
62.7
70.4
70.4
Information
9.3
11
.3
11.3
Chi-squared statistic
40.0
48.8
48.3
*All coefficients except those starred are significant at the .05 level.
In model A, the preference index alone is used to predict choice. In model B, an alternative specific dummy variable is added to account for any unmeasured situational constraints .nfluencing choice. The significant improvement (.05 level) indicates the presence of some unobserved effects. Finally model C tests the hypothesis that the preference index can be used to
predict choice. Table 12 indicates that no significant improvement (.05 level) can b attained by allowing the importance weights to vary freely. This result is
important for prediction because it allows us to use a preference index which includes inertia effects when predicting choice of NBVT.
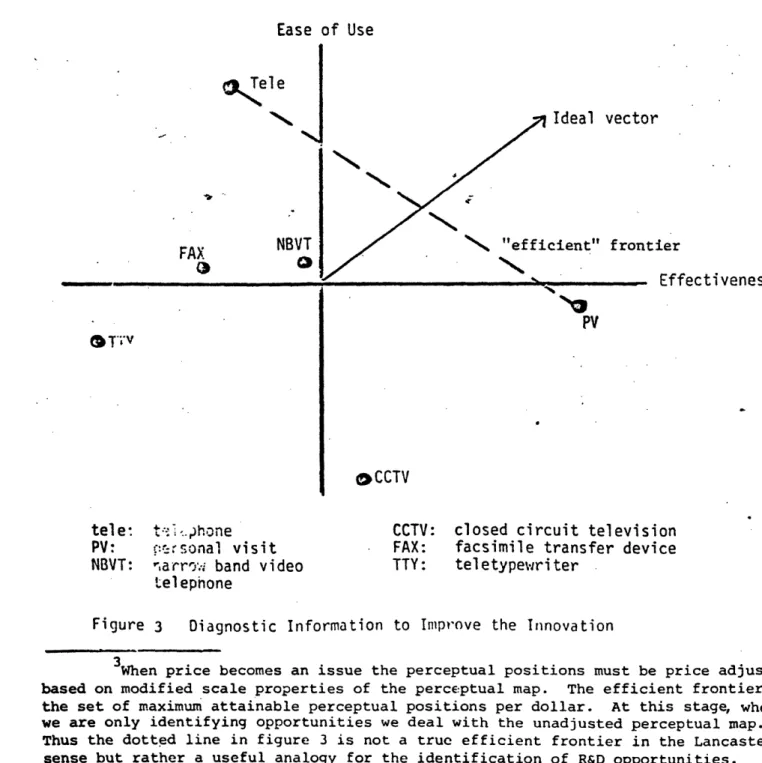
Diagnostic Information from Perception, Preference, and Choice Analysis
Figure 3 summarizes the diagnostic information based on the consumer model. The points in the perceptual map are average factor scores and indicate how
consumers perceive the innovation relative to existing technologies and
alternative innovations. The slope of the ideal vector is the ratio of the importance weights in the preference model and represents consumer tradeoffs among the perceptual dimensions. The further a technology moves parallel to the ideal vector the more preferred that technology is likely to be. The analogy t the efficient frontier (Lancaster 1971) is the northeast boundary
(convex cover) of the set of perceived positions.3 If the innovation is to
Ease of Use le
N
FAX Q)NBVT
a
* TT''vN
N
'N
tier EffectivenessPV
OCCTV tele: t --.,hone PV: :f- sonal visit NBVT: narrowi. band videotelephone
CCTV: FAX: TTY:
closed circuit television
facsimile transfer device
tel etypewri ter
Figure 3 Diagnostic Information to Improve the Innovation
3When price becomes an issue the perceptual positions must be price adjusted
based on modified scale properties of the perceptual map. The efficient frontier is the set of maximum attainable perceptual positions per dollar. At this stage, when we are only identifying opportunities we deal with the unadjusted perceptual map. Thus the dotted line in figure 3 is not a true efficient frontier in the Lancasterian sense but rather a useful analogy for the identification of R&D opportunities.
_P11__________1_1_ll___
-15-be successful it should -15-be on or -15-beyond the 'efficient" frontier. For example, it is clear from figure 3 that NBVT does not fill the perceptual gap between telephone and personal visit. If NBVT can be improved sufficiently to move
it past the dotted line connecting telephone and personal visit, then NBVT will be efficient in the sense that, on average, consumers can achieve some perceptual positions better with NBVT than with a combination of personal visit and telephone.
Before we analyze how to improve NBVT along the ideal vector we examine whether figure 3 represents the best strategy or whether we should have a set of strategies each directed at a specific segment of the consumer
population.
Benefit Segmentation
Managerially we are interested in those groups that have different relative importance weights for effectiveness and ease of use. For example, if half the population feels very strongly about effectiveness and the other half feels very strongly about ease of use, R&D would be better advised to
develop either a very effective or a very easy to use technology rather than -developing a technology that is moderately effective and moderately easy to use. In the telecommunications application we are interested in usage of NBVT rather than sales of NBVT, thus our benefit segments will include usage
segments. In other applications the segments will be based primarily on consumer characteristics rather than including usage characteristics.
To investigate such preference differences we first segment the sample population based on characteristics that describe their most recent interaction and based on demographic characteristics. Separate preference models are then estimated for each segment and compared to the model reported in table 3. The criteria of segmentation is significantly different relative importance weights
and significantly improved predictive ability. The statistical test is a chi-squared statistic based on the likelihood ratio comparing the segmented models to the overall model (Mood and Greybill, 1963).
Significant effects (.05 level) were identified for three situational and no demographic variables. These potential segmentation variables were (1) number of people participating, (2) need for visuals, and (3) preparation time. Table 5 illustrates the tests for segmentation based on the need for visuals.
- F
Variable Name
Effectiveness
Ease of use
"PerceptionPreference
Sample size
Percent correctl
Information
Chi-squared stal
Table
5Preference Segmentation on Need for Visuals
Importance
t!eichts*
Overall
No Visuals
None Used,
Needed
but Needed
.57
.49
.56
.43
.51
.45
index
';
2.43
3.10
2.26
inertia
-.40
-.45
.09
410
162
53
ly predicted
65.4
72.2
53.8
71.1
44.5
55.2
22.3
48.4
tistic
587.4
282.5
38.1
X6 for .';1lt ,ti.I
- (282.5 + 3.1 +Significant at the .05 level
*All coefficients are significant at the .05 level.
None
Used
.75
.26
i .87
-. 65
195
74.9
,
50.8
318.6
318.6) - 587.4
=
51.8
---· 1- __
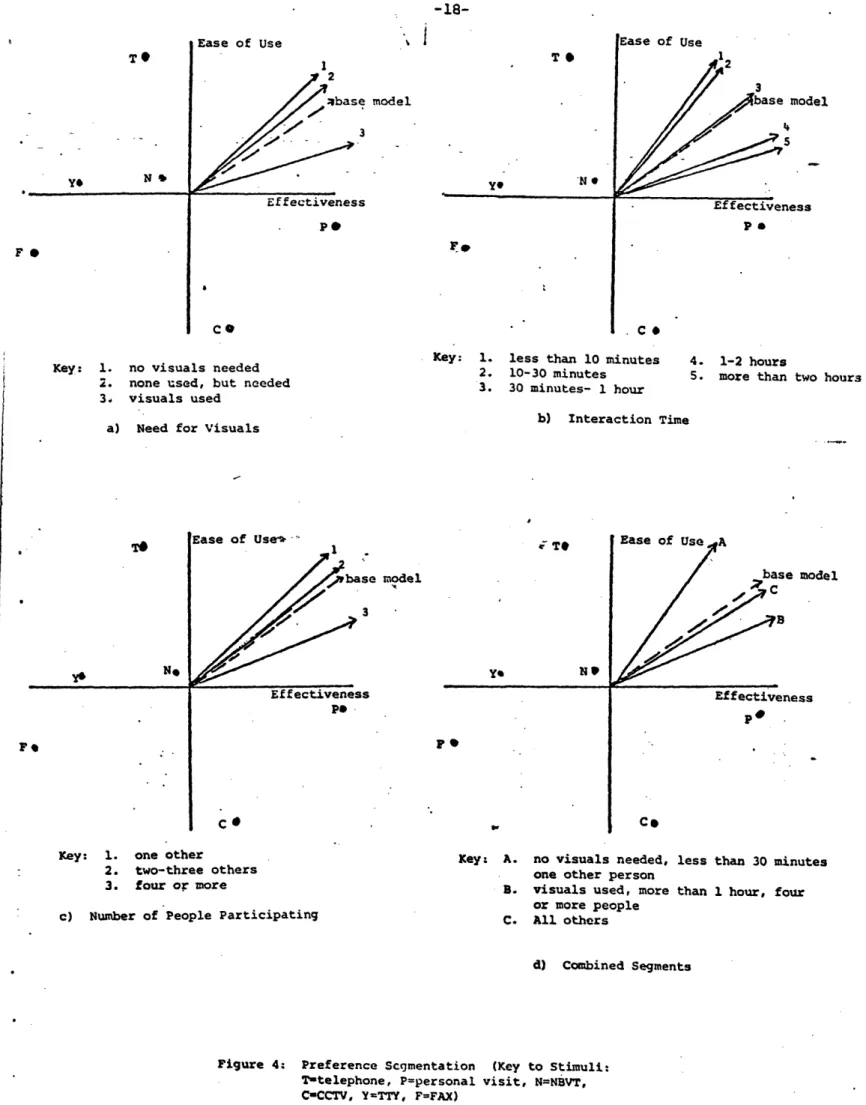
-17-We then grouped segments with similar importance weights to obtain three com-bined segments, Segment A (interactions that are less than 30 minutes with one other person involved, and visuals not required) places importance on ease of use. Segment B (interactions of more than n hour, involving a group of four or more people, and visuals required) places importance on effectiveness. Segment C (all other interactions) places roughly equal importance on both dimensions. The
combined segments accounted for 4%, 11%, and 85% of the interactions respectively. This segmentation was also significant at the 05 level.
To interpret these tests it is convenient to represent the segmentations visually by superimposing te segmented ideal vectors. See figure 4. Figure 4d is for the combined segments. Based on figure 4d
it appears that thtw ' majority segment, segment C - 85% of the inter-actions, has preferences similar to the base model in figure 3. To reach the most users, R&D should improve' NBVT by placing roughly equal emphasis on effectiveness and ease of use. This type of improvement in NBVT will
attract those consumers whose interactions have characteristics such as medium length, a few people involved, or a potential for improvement with visuals. If simultaneous improvement along both dimensions is not possible, an alternative' strategy for R&D is to concentrate on either extremely effective communication
(segment B - - l% of the interactions) or extremely easy to use communication (segment A - 4% of the interactions). However each of these strategies goes head on against an existing technology - personal visit or telephone.4
4If the goal is to substitute NBVT for personal visits then a very effective NBVT addressed at segment B may be a reasonable R&D strategy.
T Ye 1 2 model ye CO no visuals needed none used, but needed visuals used
Key: 1. less than 10 minutes 2. 10-30 minutes 3. 30 minutes- 1 hour of Use ,1K2 [el C. 4. 1-2 hours
5. more than two hours
a) Need for Visuals
of Use' -. ., b) Interaction Time Te model 3 ye Pe F C . W model ass p. Co
Key: 1. one other
2. two-three others 3. four or more
c) Number of People Participating
Key: A. no visuals needed, one other person B. visuals used, more
or more people C. All others
less than 30 minutes
than 1 hour, four
d) Combined Segments
Figure 4: Preference Segmentation T-telephone, P=personal C-CCTV, YmTTY, F=FAX) (Key to Stimuli: visit, N=NBVT, Key: 1. 2. 3.
I ____I_C
I _
_^ _
I 3 .
-19-Identification of Innovators
- As a final guide-for R&D we identify those users who most prefer NBVT. and are most likely to try it should it be introduced. This information provides some creative insight into the potential NBVT users and provides marketing with some initial introduction strategies.
Therehave been numerous attempts to find general characteristics of
innovators. (Rogers and Shoemaker [1971] review many of these studies.) The results suggest that although some general characteristics may exist, it is more likely
that the characteristics of innovators are specific to the innovation. (See Midgley and Dowling [1978] for a critical appraisal of this literature.) Following Midgley nd Dowlinq we define innovators as those consumers
significantly more likely to prefer or try the innovation given that they are aware of the innovation. (We force awareness with the concept statement.)
To implement this definition, two regression equations are estimated with preference and intent as the dependent variables. Intent is a categoriacal scale measuring the likelihood that a consumer would have chosen NBVT had it been available for his most recent interaction. The potential explanatory
variables are situational and demographic variables identified based on previous theory and experience as potential indicators of innovators for the new products The explanatory variables are categorical as measured in the questionnaire.
The potential variables for NBVT are shown in table 6. Since the technolo-gical advantage of NBVT is a visual component, a priori, we expect at least the need for visuals to be significant. The other situational variables were
selected based on focus groups and discussions with experts in telecommunication. The demographic variables try to uncover any predisposition based on personal experience of the respondent. To obtain greater power in the estimates, questionnaire type (30 minutes vs. every office) was controlled for by a main effects model.
Table 6
Situational and Demographic Variables Likely to Identify Innovators SITUATIONAL VARIABLES
Need for visuals
Number of people participating Place of interaction
Relationship to other participants Frequency of interaction
Purpose of interaction
Preparation time
Travel time opotential travel time Travel cost or potential travel cost Interaction time
Need for security
DEMOGRAPHIC VARIABLES Years at LASL Education Discipline of training Discipline of work Role in laboratory
Percentage of time allocated to various tasks
Age sex
Marital status
Need for visuals and interaction time were the only variables found to be significant at the .05 level. Alternative analysis with subsets of the
variables were consistent in that these two variables alone were consistently _ significant. Although we can expect one significant variable by chance out of twenty when testing at the .05 level, we believe the two identified variables are true effects since their significance levels are well below the .05 level
and since similar results are obtained for both preference and intent. The
regressions with only these variables are shown in table 7. Selected interactions were tried and found to be insignificant. The final model was found to be not significantly different from the full model (all variables) at the .05 level. (F(54,252)= 1.13 for preference, F(54,173)= .88 for intent.]
-21-Variable
Tabl e
7Regressions to Identify Innovators
(ns
=
non-significant, then dropped from model)
PREFERENCE RANK (Best value 1.0):
INTENT (Best value 5.0)
Coefficient
Significance
Coefficient
Significance
Every office
30 minutes
Visuals not used
-Visuals not used
but needed
Visuals used
Interaction time
0-10 min.
10-30 min.
30 min.-1 hr.
1 hr. or longer
Constant
R
2F
.25
-. 82
-. 38
-.
33
ns ns 3.20.09
7.31
.04
.00
.00
.03
ns ns.00
.00
ns.75
. 46
.49
.45
ns2.36
,11
7.20
.00
.00
.01
" .01
ns.00
.00
Based on table 6 we posit that NBVT is most likely to be used for (1) interactions that required visuals but for which none was available and (2) interactions requiring moderate (10-30 minutes) interaction time. This represents about 4.3% of the interactions.
R&D Strategies, Forecasts, and Managerial Actions
To get an indication of how R&D might improve NBVT we return to the twenty-five attribute scales. These are qualitative perceptual scales, but they are
_ _· __ __ __
more rich in their representation than the two-dimensional-map and hence provide useful insights. Figure 5 is a perceptual plot based on these
(standardized) scales. Negatively worded scales have been reversed so that movement to the right indicates improvement and the scales have been reordered
& L
so that the effectiveness and ease of use scales appear together.
Figure
Average Attribute Ratings Of Three Comnunicatlons Alternatives
-1.00
16H LENEL OF INtERCTILN I
COW fM ROLP OISCUSSEt I
IMTEWRTVE tGER 3EVELeOENT I
EFFECTIVELY IcXTOR PEPLE.ETC.
CRN OL.VE PRCLEM - I
EUfECTIVELY DECHCGE INFO I CR1 CEY ALL FMNS OF IN4FO I
CRN W'S f&LINGS I
DOFFI.Lt TO MISINTEPRET tFO I
UOlMS IELL FOR C.ITENT
PERMITS E TO MAI:;TlN .NrACTr I
ELINIMRTES R LOT F PRt I
ELIMItNTES RED rPE I
INWCXO tVE I
QUICK IPONSC N R QICSIS I
N NEE TO PU FR IN VFICE I
1AS LTTLE TInE TO USE I
SWES TInE I
INOT A ImSLE TO UE I
CAN FrDO rHC 1IGnT rS I
PEstRSOtAtrES OeMT INTrFLERE I
00 NOT NEED VISUL. AD105
SECURITY NC PR3LEM I
CAN AVOIO NEGATIVE [WRESSCN I -t .OO Jo 00 C TLPHONE P VISIT N5VT --- I *a--a _ I
By carefully examining figure 5 we see that NBVT is perceived poorly relative to personal visit on all effectiveness scales. This indicates a need for overall improvement along all effectiveness dimensions. Perhaps the greatest improvement is needed in the ability of NBVT to "monitor people, operations,, and experiments" and "convey all forms of information." NBVT needs the least improvement for "persuasion, "expressing feelings," and
"solving problems." Similarly telephone dominates on all ease of use scales. Relative to telephone, NBVT needs the most improvement on "need to plan in advance," "get a quick response," and "expense."
Before beginning extensive R&D we make preliminary forecasts to determine the magnitude of usage achievable with these improvements. We use decision calculus (Little 19 Qi to make preliminary estimates of the impacts of changes on the attribute scales in figure 5. The statistical models (factor score
coefficients and the preference and choice odels) are then used to forecast the resulting change in usage. For complete equations, procedures to enhance judgment, and applications to urban transportation, see Hauser, Tybout, and Koppelman (1979). Predictions are automated with an interactive computer information system so that the R&D team can quickly and easily get forecasts based on their judgments.
For example, table 8 shows estimates of.the effects of three improvements in NBVT. Strategy 1 improves the effectiveness of monitoring experiments and the ability to convey all forms of information. Strategy 2 improves the
availability of NBVT (plan in advance and quick response). Strategy 3 combines strategy 1 and strategy 2. In each case the effect is simulated as a movement of one-half the distance to the best rated current technology. The results are
the percentage change-in the ultimate usage share of the various technologies. Based on table 8 it is clear that these strategies are useful but have only a minor impact on share. Further simulations reveal that this type of change can only lead to improvements in the range of 5-10%. Since this is not
sufficient,for managerial goals, major R&D is needed. For example, if major R&D were able to move NBVT to the efficient frontier along the ideal vector, the share of NBVT would be improved by 110%.
Table 8
Forecasts for Improvements in the Innovation (% change in share)
_· .NBVT Personal Visit Telephone
Strategy 1 6.7 - .5 - .7
Strategy 2 1.9 - .2 - .2.
Strategy 3 8.8 - .8 - .8
Major R&D 110.0 -8.8 -10.6
iii i ·i, .i. j i · ii
~~~~~~~~~~~~~~~~~~~~~~~~~~~.
Based on these forecasts R&D management is faced with a
decision to introduce the modified innovation (GO), return to R&D (ON), or abort the investment in the innovation (NO GO). In this case it is clear that NBVT is not yet ready for introduction, but with major R&D it can become a viable force in the market for telecommunications.
The managerial action was ON. Implementation of the NBVT technology described in figure 2 was postponed and the technology was returned to R&D
for major improvement. Based on figure 3 and technical judgment, the R&D team chose to focus on improved resolution, hard copy availability, reduced
----
-25-transmission time, and increased accessibility of the technology. As a further guide, a conjoint study (Hauser and Simmie 1979) was undertaken to determine the impact of these physical changes on perceptions of effectiveness and ease of use. Accessibility had the largest impact on ease of use. The availability of hard copy had the greatest impact on effectiveness. Resolution had no
significant effect on either dimension. One potential profile (increased
accessibility, hard copy, and 10 second transmission time) would be "efficient" in figure 3, but a less expensive profile (30 minutes notice on accessibility, hard copy, and 10 second transmission time) was near the "efficient" frontier. This second profile was selected as a guide to the best initial strategy
for R&D. R&D is now in the process of investigating these and potentially other methods to improve NBVT.
Conclusion
This paper demonstrates how consumer theory, marketing resuarch, and quantitive analysis can improve the effectiveness of R&D. The methodology presented is feasible and provides managerially relevant diagnostic information to the R&D team. Although the methodology has been illustrated through
application to telecommunications technology, it is more general. It is now being applied to transportation technology and to the design of disposable
hospital gowns. We feel it can be applied to a variety of problems such as new computer technology, home heating technology, scientific instruments, construction equipment, or word processing systems.
Allen, T.J., "Studies of the Problem-Solving Process in Engineering Design," IEEE Transactions on Engineering Management, Vol. EM-13, No. 2
(June 1966), pp. 72-83.
, Managing the Flow of Technology, (Cambridge, MA:M.I.T. Press, 1978).
Bass, F.M., "A New Product Growth Model for Consumer Durables," Management Science, Vol. 15, No. 5 (January 1969), pp. 215-227.
Brunswik, E., The Conceptual Framework of Psychology, (Chicago:University of Chicago Press, 1952).
Business Week, "R&D Spending at 683 Companies: Another Record Year," (New York:McGraw-Hill) July 2, 1979, pp. 52-72.
Calder, B.J., "Focus Groups nd the Nature of Qualitative Marketing'Research," Journal of Marketing Research, Vol. 14 (August 1977), pp. 353-364. Green, P.E., and Y. Wind, Multiattribute Decisions in Marketing, (Hinsdale, IL:
The Dryden Press, 1973).
Hammond, K.R., "Inductive Knowing," in The Psychology of Knowing, J.R. Royce
JVF.A T., TAT ' D. 1JJ i.. t .3 V*, 1l. ' L UL OL- U 1 ' 1 Cr17
i
Lou n · nut:SuQ Lw. , ::u:* ,.3 %L4W 1VL.;JcQr.uuA a1nU J0Jt~asrec, Oa 1
Hauser, J.R., "Testing and Accuracy, Usefulness, and Significance of
Probabilistic Models: An Information Theoretic Approach," Operations Research, Vol. 26, No. 3 (May-June 1978), pp. 406-421.
, and P. Simmie, "Product Realization: Selection of Physical Features and Price to Achieve a Profit Maximizing Perceptual Position," working paper, Graduate School of Management, Northwestern University, Evanston,
IL (revised August 1979).
, A.M. Tybout, and F.S. Koppelman, "Consumer-Oriented Transportation Service Planning: Consumer Analysis and Strategies," in Applications of Management Science, ed. R. Schultz, (JAI Press, 1979).
, and G.L. Urban, "A Normative Methodology for Modeling Consumer Response to Innovation," Operations Research, Vol. 25, No. 4 (July-August 1977), pp. 579-619.
Lancaster, K., Consumer Demand: A New Approach, (New York:Columbia University Press, 1971).
III
R2
Little, J.D.C., "Models and-Managers: The Concept of a Decision-Calculus,"-Management Science, Vol. 16, No. 8 (April 1970), pp. 466-485.
McFadden, D., "Conditional Logit Analysis of Qualitative Choice Behavior," in Frontiers in Econometrics, ed. P. Zarembka, pp. 105-142, (New York;Academic Press, 1970).
Meadows, D.L., "Estimate Accuracy and Project Selection Models in Industrial Research," Industrial Management Review, Vol. 9, No. 3 (Spring 1968), pp. 105-119.
Midgley, D.F., "A Simple Mathematical Theory of Innovative Behavior," Journal of Consumer Research, Vol. 3 (June 1976), pp. 31-41.
, and G.R. Dowling, "Innovativeness: The Concept and its Measurement," Journal of Consumer Research, Vol. 4, No. 4 (March 1978).
Mood, A.M., and F.A. Graybill, Introduction to the Theory of Statistics, (New York:McGraw-Hill, 1963).
Neslin, S., 'Analyzing Consumer Response to Innovation: The Concept of Preference Inertia," Working Paper 877-76, Sloan School of Management, M.I.T., October 1976.
Rogers, E.M., and F.F. Shoemaker,,Communications of Innovations: A Cross-Cultural Approach, (New York:The Free Press, 1971).
Rummel, R.oJo., Applied Factor Analysis, (Evanston, IL:Northwestern University Press, 1970).
Shocker, A.D., and V. Srinivasan, "Multiattribute Approaches to Product Concept Evaluation and Generation: A Critical Review," Journal of Marketing Research, Vol. 16 (May 1979), pp. 159-180.
Utterback, J.M., "Innovation in Industry and the Diffusion of Technology," Science, Vol. 183 (February 15, 1974), pp. 620-626.
von Hippel, E.,.... "Has a Customer Already Developed Your Next Product?," Slo-r Management Review, Vol. 18, No. 2 (Winter 1977), pp. 63-75.
"The Dominant Role of the User in Semiconductor and Electronic Subassembly Process Innovation," IEEE Transactions on Engineering Management (May 1977).
, "The Dominant Role of Users in the Scientific Instrument Innovation Process," Research Policy, Vol. 5 (July 1976), pp. 212-239.
, "Transferring Process Equipment Inncvations from User-Innovators to Equipment Manufacturing Firms," R&D Management (October 1977).