Coupled Inline-Cross Flow VIV
Hydrodynamic Coefficients Database
The MIT Faculty has made this article openly available.
Please share
how this access benefits you. Your story matters.
Citation
Zheng, Haining, Jason M. Dahl, Yahya Modarres-Sadeghi,
and Michael S. Triantafyllou. “Coupled Inline-Cross Flow
VIV Hydrodynamic Coefficients Database.” ASME 2014 33rd
International Conference on Ocean, Offshore and Arctic Engineering,
8-13 June, 2014, San Francisco, California, USA, ASME, 2014. ©
2014 by ASME
As Published
http://dx.doi.org/10.1115/OMAE2014-24659
Publisher
ASME International
Version
Final published version
Citable link
http://hdl.handle.net/1721.1/120781
Terms of Use
Article is made available in accordance with the publisher's
policy and may be subject to US copyright law. Please refer to the
publisher's site for terms of use.
COUPLED INLINE-CROSS FLOW VIV HYDRODYNAMIC COEFFICIENTS
DATABASE
Haining Zheng
MIT Cambridge, MA, USA
Jason M. Dahl
University of Rhode Island Narragansett, RI, USA
Yahya Modarres-Sadeghi
University of Massachusetts Amherst, MA, USA
Jason Dahl MIT/URI
Cambridge, MA/ Narragansett, RI, USA
Michael S. Triantafyllou
MIT Cambridge, MA, USA
ABSTRACT
Vortex Induced Vibrations (VIV) cause major fatigue damage to long slender bodies and have been extensively studied in the past decades. While most of the past research focused on the cross flow direction, it was recently shown that the inline motion in the direction of the flow has a major impact on the fatigue life damage due to its higher frequency (second harmonic) and more importantly, its coupling with the crossflow motion, which triggers a third harmonic stress component in the cross flow direction. In this paper, the coupled inline-crossflow VIV problem is addressed from semi-empirical modeling of fluid forces. Extensive fine grid forced inline-crossflow VIV experiments were designed and carried out in the MIT towing tank. An inline-crossflow VIV hydrodynamics coefficients database was newly constructed using the experimental results and it is expected to be useful for other semi empirical programs predicting coupled inline-crossflow VIV in the field. Several key hydrodynamic coefficients in the database, including lift force coefficients, drag force coefficients and added mass coefficients, were systematically analyzed. The coefficients in the crossflow and the inline directions were found to have strong dependency on the phase between the inline and crossflow motions.
INTRODUCTION
Vortex-induced vibrations (VIV) result in material fatigue of long cylindrical structures such as risers and mooring lines. Semi-empirical software packages, such as Vortex-Induced Vibration Analysis (VIVA) [1], have been widely used in
numerous academic and industrial applications to predict VIV. Although VIV has been an intensively studied field in the past 30 years [2][3], the significant influence of the inline motion and more importantly, its coupling with the crossflow motion, has long been ignored due to low observed inline amplitudes, until recently [4][5][6][7].
The free vibration of an elastically mounted rigid cylinder exhibits a response that can be divided into three regions [7][8]: (i) the inline motion dominant region at reduced velocity less than 4; (ii) the crossflow motion dominant region at reduced velocity larger than 8, and (iii) the inline-crossflow coupling region at reduced velocity between 4 and 8. Thus it is reasonable to use separate hydrodynamic databases to predict VIV motion depending on the reduced velocity, namely pure inline database, pure crossflow database, and inline-crossflow coupled database, corresponding to the regions discussed above.
The original pure crossflow database used in VIVA was developed in the MIT Towing Tank [9]. Aronsen studied pure inline rigid cylinder forced vibration experiments [10] and reported hydrodynamic coefficients at a Reynolds number 24,000. Zheng et al [7] reported hydrodynamic coefficients from pure inline rigid cylinder forced vibration experiments at a lower Reynolds number 7,600. An experimental database is necessary to extend the capabilities of VIV prediction in VIVA to allow prediction of coupled 2D inline-crossflow response.
HIGH RESOLUTION 2D FORCED VIV MOTION EXPERIMENT DESIGN
Proceedings of the ASME 2014 33rd International Conference on Ocean, Offshore and Arctic Engineering OMAE2014 June 8-13, 2014, San Francisco, California, USA
OMAE2014-24659
One challenge with extending the prediction to combined inline and crossflow motions is that the number of parameters increases, which results in a large number of experiments necessary to define the hydrodynamic coefficients governing the problem. The lift coefficients and the added mass coefficients in the pure crossflow and inline databases are functions of reduced velocity and amplitude of response in either inline or crossflow direction. However, theses hydrodynamic force coefficients in the coupled inline-crossflow database are functions of reduced velocity, amplitude of response in both inline and crossflow directions and phase difference between the inline and crossflow motions. Thus, the dimension of the database increases from 3 to 5.
The experiment described in [11] was an initial successful attempt to characterize the force coefficients. While this set of experiments provides useful information on the forces exerted on a rigid cylinder undergoing combined crossflow and inline motion, this series of experiments resulted in a very sparse representation of the hydrodynamic forces. In order to be able to use it as a hydrodynamic database in semi-empirical programs, it is necessary to increase the resolution of the experimental grid.
The crossflow and inline motions are defined as follows: 𝑦 = 𝐴𝑦𝑠𝑖𝑛(𝑤𝑡)
𝑥 = 𝐴𝑥𝑠𝑖𝑛(2𝑤𝑡 + 𝜃)
where y is the crossflow motion, x is the inline motion, Ay is the
amplitude in the crossflow direction, Ax is the amplitude in the inline direction, ѡ is the circular frequency (2πf), and θ is the phase difference between the inline and crossflow motions.
The reduced velocity Ur is defined as U/fD, thus it is inversely proportional to the response frequency f. The reduced velocity Ur, the response amplitude in the crossflow direction
Ay, the response amplitude in the inline direction Ax, and the phase difference between the inline and crossflow motions θ are the four important parameters in the database. The reduced velocity was set from 4 to 8 since the inline and crossflow motions are both significant in this region observed from the free vibration experiments [8][12], with a minor extension compared with 2007 experiment in [11] (4.5 to 8).
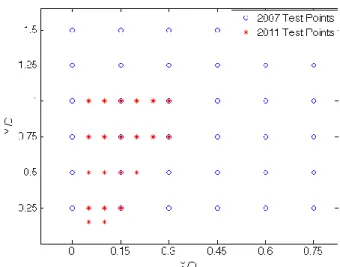
The ratios of the inline to crossflow amplitude in the experiments are set to less than 1/3 in order to constraint the number of experiments necessary to expand the resolution of the experimental database without an explosion of experiment runs. This is based on the observations in Dahl et al [12] free vibration experiments. The 2007 and 2011 experiment matrices of inline and crossflow motion amplitudes are compared in Figure 1.
Figure 1: Experiment matrix of inline and crossflow amplitude. The x-axis is the inline motion amplitude nondimensioned by the diameter of the cylinder and the y-axis is the crossflow motion amplitude nondimensioned by the diameter of the cylinder. The 2011 experiment is marked as red star while the 2007 experiment is marked as blue circle.
One important new parameter in the 2D VIV hydrodynamic coefficients database is the phase θ between the inline and crossflow motions. The orbit shapes for various phases between inline and crossflow motions are plotted in Figure 2. Counter-clockwise motion is defined for the orbits shape with phases in [-90, 90], while clockwise motion is defined for the orbits shape with phases in [-180 -90] and [90 180] [11] [13]. The phases between the inline and crossflow motions play a significant role for the hydrodynamic force coefficients in the database.
Figure 2: Orbits shape for various phases btw inline and crossflow motion
It was observed by Jauvtis and Williamson [8] and Dahl et al [14] that for the free vibration of cylinders with two degrees of freedom, the phase between the inline and crossflow motion can vary greatly, from -180 to 180 degrees, especially if the nominal natural frequency ratio between inline and crossflow motions is variable (as may exist on a long riser), Since the entire range of phases is shown to exist for freely vibrating rigid cylinders, 18 phases are chosen from -180 to 180 degrees in increments of 15 degrees or 22.5 degrees to expand the phase
resolution of the database, which previously only included data for 8 phases as shown in Figure 3.
Figure 3: Phase range of 2011 vs 2007 experiments. The 2011 experiment is marked as red cross while the 2007 experiment is marked as green circle.
In summary, a total of 3402 experimental runs were newly carried out covering 6 in-line amplitudes, from 0.05 to 0.3 in increments of 0.05; 5 transverse amplitudes, from 0.15 to 1. (0.15, 0.25, 0.5, 0.75, 1); 18 phases, from -180 to 180 degrees in increments of 15 degrees or 22.5 degrees, and 9 reduced velocities, from 4 to 8 in increments of 0.5. These data points are chosen in order to expand the existing database of values from [11], including some overlapping points in order to verify previous results.
‘2DMIT’ 2D VIV FORCE COEFFICIENTS DATABASE ANALYSIS
With hydrodynamic force coefficients extracted from the above forced vibration VIV experiments and combined with Dahl’s 2007 [11] experiments, the “2DMIT” two degree of freedom (inline and crossflow) VIV hydrodynamics coefficients database was constructed at MIT. It is named after the research team under the supervision of Professor Triantafyllou at MIT towing tank.
Some of the key hydrodynamic force coefficients in the database are listed below:
– CLv – Lift coefficients in phase with velocity
– CDv - Fluctuating drag coefficients in phase with velocity
– Cmy - Added mass coefficients in the crossflow direction
– Cmx - Added mass coefficients in the inline direction
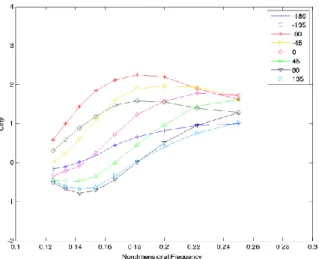
Lift Coefficients in Phase with Velocity
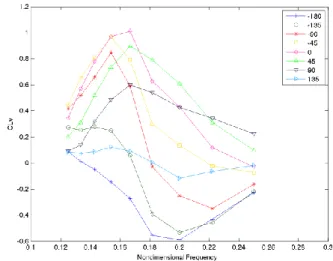
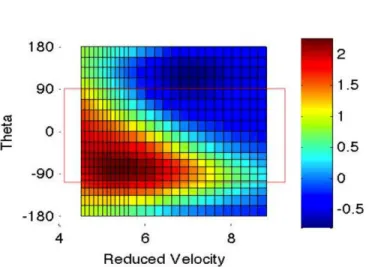
As discussed in the previous section, the lift coefficients in phase with velocity CLV is a function of four parameters: the
reduced velocity Ur, the response amplitude in the crossflow direction Ay, the response amplitude in the inline direction Ax, and the phase difference between the inline and crossflow motions θ. To better illustrate the characteristics of the lift coefficients in phase with velocity CLV, two parameters (the
response amplitude in crossflow direction Ay and the response amplitude in inline direction Ax) are fixed at first. The inline motion amplitude is equal to 0.05 times the diameter of the cylinder and the crossflow motion amplitude is equal to 0.15 times the diameter of the cylinder. The lift coefficients in phase with velocity CLV are subsequently plotted only as functions of
the reduced velocity and the phase difference between inline and crossflow motion in Figure 4 and in Figure 5. It can be observed that the lift coefficients in phase with velocity CLV are
mostly positive for the counter-clockwise motion while mostly negative in clockwise motion. This also validated the numerical simulation work in [13].
Figure 4 Lift coefficients in phase with velocity CLv with inline motion amplitude 0.05 and crossflow motion amplitude 0.15.
Figure 5: Lift coefficients in phase with velocity CLv with inline
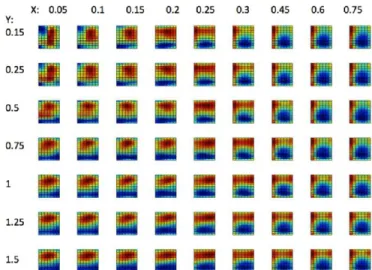
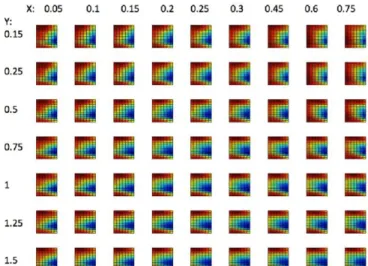
motion amplitude 0.05 and crossflow motion amplitude 0.15. Figure 6 shows CLv for all amplitudes of inline and
crossflow motions in the hydrodynamic coefficients database, ranging from 0.05 times the diameter of the cylinder to 0.75 times the diameter of the cylinder in the inline direction (0.05, 0.1, 0.15, 0.2, 0.25, 0.3, 0.45, 0.6, 0.75) and ranging from 0.15
times the diameter of the cylinder to 1.5 times the diameter of the cylinder in the crossflow direction (0.15, 0.25, 0.5, 0.75, 1, 1.25, 1.5).
Figure 6: Lift coefficients in phase with velocity CLv for all
amplitude of inline and crossflow motions. The x-axis is the nondimensional amplitude of inline motion 0.05, 0.1, 0.15, 0.2, 0.25, 0.3, 0.45, 0.6 and 0.75. The y-axis is the nondimensional amplitudes of crossflow motion: 0.15, 0.25, 0.5, 0.75, 1, 1.25 and 1.5.
From Figure 6, it can be observed that all lift coefficients CLv show the same trend as shown in Figure 4. The lift
coefficients CLv are larger for counter-clockwise motion than
that for clockwise motion for all combinations of inline and crossflow motion amplitudes.
The color map in Figure 6 is tailored to each individual subplot and thus the scale of lift coefficients CLv is different
from subplot to subplot. If the color map is unified as shown in Figure 7, the absolute value of the lift coefficient CLv are more
clearly shown and another important trend can be observed: as the inline or crossflow motion amplitude increases, the lift coefficient CLv quickly decreases below 0. When crossflow
motion amplitude is larger than 1.25 times the diameter of the cylinder, all CLv values become negative. A complete set of lift
coefficients in phase with velocity CLv with different
combination of inline and crossflow motion amplitudes can be found in [15].
Figure 7: Lift coefficients in phase with velocity CLv for all
amplitude of inline and crossflow motions with same colorbar. The x-axis is the nondimensional amplitude of inline motion 0.05, 0.1, 0.15, 0.2, 0.25, 0.3, 0.45, 0.6 and 0.75. The y-axis is the nondimensional amplitudes of crossflow motion: 0.15, 0.25, 0.5, 0.75, 1, 1.25 and 1.5.
Fluctuating Drag Coefficients in Phase with Velocity
Besides the lift coefficients in phase with velocity CLv, in
the crossflow direction, there are also fluctuating drag coefficients in phase with velocity CDv in the inline direction in
the new 2D VIV hydrodynamic coefficients database.
Fluctuating drag coefficients in phase with velocity CDv are
first plotted with the inline motion amplitude equal to 0.05 times the diameter of the cylinder and the crossflow motion amplitude equal to 0.15 times the diameter of the cylinder. CDv
are mostly positive in [-90, 180] (the whole counterclockwise motion region and half of Clock wise motion region), and mostly negative in [-180, -90](half of clockwise motion region) as shown in Figure 8 and Figure 9.
Figure 8: Fluctuating drag coefficient in phase with velocity CDv with inline motion amplitude 0.05 and crossflow motion
Figure 9: Fluctuating drag coefficient in phase with velocity CDv with inline motion amplitude 0.05 and crossflow motion
amplitude 0.15.
Figure 10 shows CDv for all amplitudes of inline and
crossflow motions in the hydrodynamic coefficients database, ranging from 0.05 times the diameter of the cylinder to 0.75 times the diameter of the cylinder in the inline direction (0.05, 0.1, 0.15, 0.2, 0.25, 0.3, 0.45, 0.6, 0.75) and ranging from 0.15 times the diameter of the cylinder to 1.5 times the diameter of the cylinder in the crossflow direction (0.15, 0.25, 0.5, 0.75, 1, 1.25, 1.5). From Figure 10, it can be observed that the fluctuating drag coefficients in phase with velocity CDv show
the same trend as shown in Figure 8. The fluctuating drag coefficients in phase with velocity CDv are mostly positive in
counter-clockwise motion while mostly negative in clockwise motion at all combinations of inline and crossflow motion amplitudes.
The color map in Figure 10 is tailored to each individual subplot and thus the scale of fluctuating drag coefficients in phase with velocity CDv is different from subplot to subplot. If
the color map is unified as shown in Figure 11, the absolute value of the fluctuating drag coefficients in phase with velocity CDv are more clearly shown and another important trend can be
observed: as the inline motion amplitude increases, the fluctuating drag coefficients in phase with velocity CDv quickly
decrease below 0. When inline motion amplitude is larger than 0.3 times the diameter of the cylinder, all CDv values become
negative.
A complete set of fluctuating drag coefficients in phase with velocity CDv with different combinations of inline and
crossflow motion amplitudes can be found in [15].
Figure 10: Fluctuating drag coefficient in phase with velocity CDv. The x-axis is the nondimensional amplitude of inline
motion 0.05, 0.1, 0.15, 0.2, 0.25, 0.3, 0.45, 0.6 and 0.75. The y-axis is the nondimensional amplitudes of crossflow motion: 0.15, 0.25, 0.5, 0.75, 1, 1.25 and 1.5.
Figure 11: Fluctuating drag coefficient in phase with velocity CDv with same colorbar. The x-axis is the
nondimensional amplitude of inline motion 0.05, 0.1, 0.15, 0.2, 0.25, 0.3, 0.45, 0.6 and 0.75. The y-axis is the nondimensional amplitudes of crossflow motion: 0.15, 0.25, 0.5, 0.75, 1, 1.25 and 1.5.
Added Mass Coefficients in the Crossflow Direction
The added mass coefficient in the crossflow direction Cmy
is a strong function of reduced velocity and is mostly larger for the counter-clockwise motion as shown in Figure 12 and Figure 13. Cmy are plotted with the inline motion amplitude equal to
0.05 times the diameter of the cylinder and the crossflow motion amplitude equal to 0.15 times the diameter of the cylinder.
Figure 12: Added mass coefficient in the crossflow direction Cmy with inline motion amplitude 0.05 and crossflow motion
amplitude 0.15.
Figure 13: Added mass coefficient in the crossflow direction Cmy with inline motion amplitude 0.05 and crossflow motion
amplitude 0.15.
Figure 14 shows Cmy for all amplitudes of inline and
crossflow motions in the hydrodynamic coefficients database, ranging from 0.05 times the diameter of the cylinder to 0.75 times the diameter of the cylinder in the inline direction (0.05, 0.1, 0.15, 0.2, 0.25, 0.3, 0.45, 0.6, 0.75) and ranging from 0.15 times the diameter of the cylinder to 1.5 times the diameter of the cylinder in the crossflow direction (0.15, 0.25, 0.5, 0.75, 1, 1.25, 1.5).
From Figure 14, it can be observed that the added mass coefficients in the crossflow direction Cmy show the same trend
as shown in Figure 12. The added mass coefficient in the crossflow direction Cmy is a strong function of reduced velocity
and is generally larger for the counter-clockwise motion.
Figure 14: Added mass coefficient in the crossflow direction Cmy. The x-axis is the nondimensional amplitude of inline
motion 0.05, 0.1, 0.15, 0.2, 0.25, 0.3, 0.45, 0.6 and 0.75. The y-axis is the nondimensional amplitudes of crossflow motion: 0.15, 0.25, 0.5, 0.75, 1, 1.25 and 1.5.
The color map in Figure 14 is tailored to each individual subplot and thus the scale of lift coefficients CLv is different
from subplot to subplot. If the color map is unified as shown in Figure 15, the absolute values of the lift coefficient Cmy is more
clearly shown and another important trend can be observed: as the inline motion amplitude increases, the added mass coefficient in the crossflow direction Cmy increases while as the
crossflow motion amplitude increases, the added mass coefficient in the crossflow direction Cmy decreases.
Figure 15: Added mass coefficient in the crossflow direction Cmy with same colorbar. The x-axis is the nondimensional
amplitude of inline motion 0.05, 0.1, 0.15, 0.2, 0.25, 0.3, 0.45, 0.6 and 0.75. The y-axis is the nondimensional amplitudes of crossflow motion: 0.15, 0.25, 0.5, 0.75, 1, 1.25 and 1.5.
The inline-crossflow amplitude ratio appears to have significant influence on the added mass coefficients. The ratio of the inline motion amplitude to the crossflow motion amplitude is 1:3 in Figure 13 with 0.05 times the diameter of the cylinder in the inline direction and 0.15 times the diameter of the cylinder in the crossflow direction. Figure 16 has an inline-crossflow amplitude ratio of 1:10. Figure 17 has an inline-crossflow amplitude ratio of 1:20. Figure 18 has an inline-crossflow amplitude ratio of 1:30. From these four figures, it can be observed that as the inline-crossflow amplitude ratio decreases, the phase influence decreases and the range of Cmy decreases.
Figure 16: Added mass coefficient in the crossflow direction Cmy with inline motion amplitude 0.05 and crossflow motion
amplitude 0.5.
Figure 17: Added mass coefficient in the crossflow direction Cmy with inline motion amplitude 0.05 and crossflow motion
amplitude 1.
Figure 18: Added mass coefficient in the crossflow direction Cmy with inline motion amplitude 0.05 and crossflow motion
amplitude 1.5.
Meanwhile, if the inline-crossflow amplitude ratio is the same, then the phase influence will be similar. Figure 19 has 0.15 times the diameter of the cylinder in the inline direction and 0.15 times the diameter of the cylinder in the crossflow direction. Figure 20 has 0.25 times the diameter of the cylinder in the inline direction and 0.25 times the diameter of the cylinder in the crossflow direction. They both have an inline-crossflow motion amplitude ratio of 1:1 and the shape of the added mass curve is very close.
Figure 19: Added mass coefficient in the crossflow direction Cmy with inline motion amplitude 0.15 and crossflow motion
Figure 20: Added mass coefficient in the crossflow direction Cmy with inline motion amplitude 0.25 and crossflow motion
amplitude 0.25.
Figure 21 has 0.15 times the diameter of the cylinder in the inline direction and 0.75 times the diameter of the cylinder in the crossflow direction. Figure 22 has 0.25 times the diameter of the cylinder in the inline direction and 1.25 times the diameter of the cylinder in the crossflow direction. They both have an inline-crossflow amplitude ratio of 1:5 and the shape of the added mass curve is very close. On the other hand, their shapes are wider compared with those in Figure 19 and Figure 20, which have an inline-crossflow amplitude ratio of 1:1.
Figure 21: Added mass coefficient in the crossflow direction Cmy with inline motion amplitude 0.15 and crossflow motion
amplitude 0.75.
Figure 22: Added mass coefficient in the crossflow direction Cmy with inline motion amplitude 0.25 and crossflow motion
amplitude 1.25.
It can be summarized from the above figures that the shapes of the added mass coefficient in the crossflow direction Cmy are consistent across different inline and crossflow motion
amplitudes. A complete set of the added mass coefficients in the crossflow direction Cmy with different combinations of inline
and crossflow motion amplitudes can be found in [15].
Added Mass Coefficients in the Inline Direction
Besides the added mass coefficients in the crossflow direction Cmy, there are also added mass coefficients in the
inline direction Cmx in the new 2D VIV hydrodynamic
coefficients database.
The added mass coefficient in the inline direction Cmx is a
strong function of reduced velocity and is mostly smaller in counter-clockwise motion as shown in Figure 23 and Figure 24. Cmx are plotted with the inline motion amplitude equal to 0.05
times the diameter of the cylinder and the crossflow motion amplitude equal to 0.15 times the diameter of the cylinder.
Figure 23: Added mass coefficient in the inline direction Cmx
with inline motion amplitude 0.05 and crossflow motion amplitude 0.15.
Figure 24: Added mass coefficient in the inline direction Cmx
with inline motion amplitude 0.05 and crossflow motion amplitude 0.15.
Figure 25 shows Cmx for all amplitude of inline and
crossflow motions in the hydrodynamic coefficients database, ranging from 0.05 times the diameter of the cylinder to 0.75 times the diameter of the cylinder in the inline direction (0.05, 0.1, 0.15, 0.2, 0.25, 0.3, 0.45, 0.6, 0.75) and ranging from 0.15 times the diameter of the cylinder to 1.5 times the diameter of the cylinder in the crossflow direction (0.15, 0.25, 0.5, 0.75, 1, 1.25, 1.5).
From Figure 25, it can be observed that the added mass coefficients in the inline direction Cmx show the same trend as
shown in Figure 24. The added mass coefficient in the inline direction Cmx is a strong function of reduced velocity and is
mostly smaller for counter-clockwise motion.
Figure 25: Added mass coefficient in the inline direction Cmx.
The x-axis is the nondimensional amplitude of inline motion 0.05, 0.1, 0.15, 0.2, 0.25, 0.3, 0.45, 0.6 and 0.75. The y-axis is the nondimensional amplitudes of crossflow motion: 0.15, 0.25, 0.5, 0.75, 1, 1.25 and 1.5.
The color map in Figure 25 is tailored to each individual subplot and thus the scale of lift coefficients CLv is different
from subplot to subplot. If the color map is unified as shown in Figure 26, the absolute value of the lift coefficient Cmx is more
clearly shown and another important trend can be observed: as the inline motion amplitude increases, the added mass coefficient in the inline direction Cmx increases while as the
crossflow motion amplitude decreases, the added mass coefficient in the inline direction Cmx increases.
Figure 26: Added mass coefficient in the inline direction Cmx
with same colorbar. The x-axis is the nondimensional amplitude of inline motion 0.05, 0.1, 0.15, 0.2, 0.25, 0.3, 0.45, 0.6 and 0.75. The y-axis is the nondimensional amplitudes of crossflow motion: 0.15, 0.25, 0.5, 0.75, 1, 1.25 and 1.5.
A complete set of the added mass coefficients in the inline direction Cmx with different combinations of inline and
crossflow motion amplitudes can be found in [15].
CONCLUSIONS
In this paper, we extend the hydrodynamic databases employed in semi-empirical software package from pure crossflow to combined inline and crossflow. We achieve this expansion of response prediction capabilities by conducting a series of fine-grid two-dimensional forced VIV experiments on a rigid cylinder. An inline-crossflow VIV hydrodynamics coefficients database '2DMIT' was newly constructed from the experimental results and it is expected to be useful for semi empirical programs predicting coupled inline-crossflow VIV in the field. Several key hydrodynamic coefficients in the database, including lift force coefficients, drag force coefficients and added mass coefficients, were systematically analyzed. The coefficients in the crossflow and inline directions were found to have strong dependency on the phase between inline and crossflow motion.
NOMENCLATURE
Ay Amplitude in the crossflow direction
Ax Amplitude in the inline direction
Cmy Added mass coefficient in the crossflow direction
Cmx Added mass coefficient in the inline direction
CDv Fluctuating drag coefficient in phase with velocity
CLv Lift coefficient in phase with velocity
D Cylinder diameter f Oscillation frequency U Flow velocity
Ur Response reduced velocity U/fD
x Inline motion y Crossflow motion
θ Phase difference between inline and crossflow motion ѡ Circular frequency, 2πf
ACKNOWLEDGMENTS
The authors acknowledge with gratitude the permission granted by the Norwegian Deepwater Programme (NDP) Riser and Mooring Project to use the Riser High Mode VIV tests. Financial support is provided by the BP-MIT Major Programs.
REFERENCES
[1] Triantafyllou, M., Triantafylou, G., Tein, Y., and Ambrose, B., 1999, Pragmatic Riser VIV Analysis. OTC 10931, Houston, Texas.
[2] Bearman, P., 1984. Vortex shedding from oscillating bluff bodies. Annu. Rev. Fluid Mech. 16:195–222
[3] Williamson, C. and Govardhan, R. Vortex induced vibrations. Annual Review of Fluid Mechanics, 36:413– 455, 2004.
[4] Modarres-Sadeghi, Y., Mukundan, H., Dahl, J., Hover, F., Triantafyllou, M., 2010. The Effect of Higher Harmonic
Forces on Fatigue Life of Marine Risers. Journal of Sound and Vibration, 329, 43-55.
[5] Price, R., Zheng, H., Modarres-Sadeghi, Y., and Triantafyllou, M., Effect of higher stress harmonics and spectral width on fatigue damage of marine risers. In Proceedings of the 30th International Conference on Offshore Mechanics and Arctic Engineering, 2011, (OMAE 2011), Rotterdam, The Netherlands, June 19-24, 2011.
[6] Zheng, H., Price R., Modarres-Sadeghi, Y., and Triantafyllou, M., “A Systematic Approach To Understanding The Influence Of High-Harmonic And Chaotic Vortex-Induced Vibrations On Fatigue Damage Of Flexible Risers”, Proceedings of the 22nd International
Offshore and Polar Engineering Conference (ISOPE2012), Rhodes, Greece, June 17−22, 2012.
[7] Zheng, H., Modarres-Sadeghi, Y., Dahl, J., and Triantafyllou, M., Inline-Crossflow Coupled Vortex Induced Vibrations of Long Flexible Cylinders, Proceedings of the 31st International Conference on Ocean, Offshore and Arctic Engineering (OMAE 2012), Rio de Janeiro, Brazil, July 1-6 2012.
[8] Jauvtis, N., and Williamson, C., 2004, The effect of two degrees of freedom on vortex-induced vibration at low mass and damping, J. Fluid Mech., 509, 23–62.
[9] Zheng, H., Price, R., Modarres-Sadeghi, Y., Triantafyllou, G., and Triantafyllou, M., "Vortex-Induced Vibration Analysis (VIVA) Based on Hydrodynamic Databases", Proceedings of the 30th International Conference on Ocean, Offshore and Arctic Engineering (OMAE 2011), Rotterdam, The Netherlands, June 19-24, 2011.
[10] Aronsen, K. and Larsen, C., Hydrodynamic coefficients for in-line vortex induced vibrations. In Proceedings of the 26th International Conference on Offshore Mechanics and Arctic Engineering OMAE, 2007.
[11] Dahl, J., 2008, Vortex-Induced Vibration of a Circular Cylinder with Combined In-line and Cross-flow Motion. Ph.D. thesis, Cambridge, MA: Massachusetts Institute of Technology.
[12] Dahl, J., Hover, F., and Triantafyllou, M., Two degree-of-freedom vortex induced vibrations using a force assisted apparatus. Journal of Fluids and Structures, vol. 22, n6-7, Aug/Oct. 2006, p 807-818
[13] Bourguet, B., Modarres-Sadeghi, Y., Karniadakis, G., and Triantafyllou, M., 2011, Wake-body resonance of long flexible structures is dominated by counter-clockwise orbits. Physical Review Letters, 107(134502).
[14] Dahl, J., Hover, F., Triantafyllou, M., and Oakley, O., 2010, Dual resonance in VIV at subcritical and supercritical Reynolds numbers, Journal of Fluid Mechanics, 643, 395-424.
[15] Zheng, H., 2014, The influence of high harmonic force on fatigue life and its prediction via coupled inline-crossflow VIV modeling. Ph.D. thesis, Cambridge, MA, USA: Massachusetts Institute of Technology.