Publisher’s version / Version de l'éditeur:
Technical Translation (National Research Council of Canada), 1953
READ THESE TERMS AND CONDITIONS CAREFULLY BEFORE USING THIS WEBSITE.
https://nrc-publications.canada.ca/eng/copyright
Vous avez des questions? Nous pouvons vous aider. Pour communiquer directement avec un auteur, consultez la
première page de la revue dans laquelle son article a été publié afin de trouver ses coordonnées. Si vous n’arrivez pas à les repérer, communiquez avec nous à PublicationsArchive-ArchivesPublications@nrc-cnrc.gc.ca.
Questions? Contact the NRC Publications Archive team at
PublicationsArchive-ArchivesPublications@nrc-cnrc.gc.ca. If you wish to email the authors directly, please see the first page of the publication for their contact information.
NRC Publications Archive
Archives des publications du CNRC
For the publisher’s version, please access the DOI link below./ Pour consulter la version de l’éditeur, utilisez le lien DOI ci-dessous.
https://doi.org/10.4224/20386770
Access and use of this website and the material on it are subject to the Terms and Conditions set forth at
Spectral Reflectance Properties of Natural Formations
Krinov, E. L.
https://publications-cnrc.canada.ca/fra/droits
L’accès à ce site Web et l’utilisation de son contenu sont assujettis aux conditions présentées dans le site LISEZ CES CONDITIONS ATTENTIVEMENT AVANT D’UTILISER CE SITE WEB.
NRC Publications Record / Notice d'Archives des publications de CNRC:
https://nrc-publications.canada.ca/eng/view/object/?id=8e981414-eadd-4cea-85c6-1579dd8f6181 https://publications-cnrc.canada.ca/fra/voir/objet/?id=8e981414-eadd-4cea-85c6-1579dd8f6181
Title:
Author: Referenoe:
Translator:
NATIONAL RESEARCH COUNCIL OF CANADA
Techn1ca1 Translation TT-439
Spectral reflectance properties of natural
0\
format1ons.
(Spektra1'naia otrazhatel'na1a sposobnost' prirodnykh obrazovanii).
E. L. Krinov.
Laboratorlla Aerometodov, Akad. Nauk SSSR. Mosoow, 1947. 271 P.
G. Be1kov.
The translation of th1s book is complete except for the Intro-duction and Part I of Chapter I.
CHAPTER II
APPARATUS AND MATERIAL
4.
SpectrographsIn the present セッイォL at various times eight different spectrographs were used. They can be subdivided into three categories. The first category in-cludes spectrographs of the usual laboratory type セィゥ」ィ セ・イ・ used in very ヲ・セ cases, specifically in studying standard surfaces. The second category in-cludes spectrographs of the field type equipped to セッイォ under field conditions. They are of comparatively light セ・ゥァィエ and can be mounted on light portable tripods0 To direct the 」ッャセゥュ。エッイ エッセ。イ、 the desired surface they are equipped
セゥエィ mounts adjustable in azimuth and altitudeo Furthermore, they have カゥ・セ finders or sightso the third category includes special aerial spectrographs adapted to operate from aircrafto In contrast セゥエィ the previous type, these
spectrographs have a simplified strong construction and can be mounted in airoraft like ordinary aerial cameras. All the spectrographs were equipped with the appropriate devices セィゥ」ィ made it possible to obtain photometric scales according to the method of stops described above.
Laboratory Spectrographs
10 The NoI.L o Laboratory Spectrograph - This spectrograph, belonging \0 the Po F. Lesgart State Natural Science Institute, was assembled in the
astrophysical division of the Institute from its various parts o It has glass lenses and a liquid prism consisting of a solution of ethyl cinnamate which fills the glass cavity inside the prism o The linear dispersion of the spectro-graph is 28 mm o 「・エセ・・ョ the C and H lineso The photometric device consists in a metal straight edge on which 10 circular diaphragms are located in lineo The
\
straight edge is placed between the lens or the collimator and the prismo This spectrograph was used in 19;4 to study the reflective properties of several rock samples o
2 0 A. Kh,ilger 9J:mrtz Sp.c:d!rograph (large ralodell - The spectrograph belongs to the Central Scientifio Research Institute of GeodesYD Aerophoto-graphy and CartoAerophoto-graphy (Tso N. I. I. Go Ao &Ko). It waa used in 1937 to study the spectral reflective properties of ウセ。ョ、。イ、 surfaces. To use the spectrograph for this study, circular diaphragms were prepared on separate metal plates which could be placed in sequence into a special frame located between the collimator lens and the prism.
30 Ko Zeiss Glass Spectrograph - This spectrograph, belonging to the Spectroscopic Laboratory of the Geological iョウエゥエオエ・セ Academy of Sciences, USSR (G.loN.), was in operation in Sverdlovsk during the evacuation (1942) at which time certain spectrophotometric studies were being completed. A metal straight edge with 10 diaphragms was made for this spectrograph. The straight edge is located in a special frame between the collimator lens and the prism.
.Field Spectrographs
4.
Ao kィゥャァ・セ Quartz Spectrograph (small model) セ This spectrograph,belonging to the Pull(ovo Astronomical Observatory, was the first to be used. It was used at the very beginning of the study between 1930 and 1932 when the method of research was being developed. The linear dispersion of
the
spectrograph is 12 mID. between the C and H 1ine60 On one spectrographic plate, 3 x
6t
em., 11 spectrograms 1 mID. wide can be placed at an interval of 1 rom. As a photometric device a pairor
nico16 placed in front of the collimator aperture was first used. However, because of the strongobsorption of ultraviolet and the partial absorption of the カゥッャ・エセ「ャオ・
portion of the spectrum the nicols were soon replaced by diaphragms. The diaphragms are located in line on a metal stroight edge which 1s placed in a tube in front of the collimator aperture and anyone of the 12 diaphragms on the straight edge can be placed in the path of the pencil of rays ー。ウウセ ing through the collimator aperture. The spectrograph has a flag shutter operated by a handle and located inside the camera. With this shutter p time exposures of 20 sec. and more were obtained with sufficient accuracy.
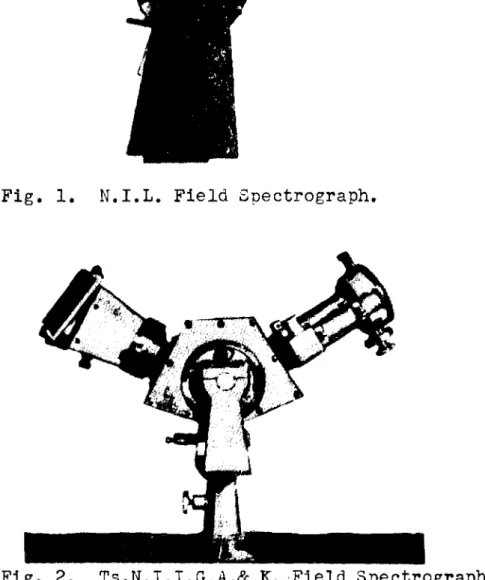
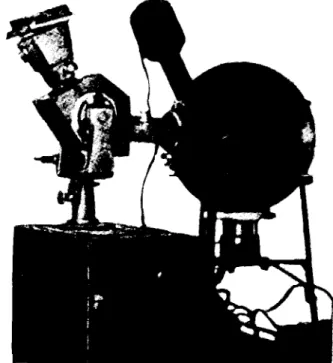
5. The N.I.L. Glass Spectrograph - The spectrographg belonging to the P. F. Lesgaft Institutepwas made in 1932 from an ordinary laboratory spectro-scope. Incidentally this spectroscope キ。セ first used as long ago as 1914 by Nikolai Aleksandrovich Morozov, subsequently a member of the Academyp to obtain spectrograms of the earth's surface from a balloon during the full eclipse of the SUD. Considerably laterg in 1929, this spectroscope was used
by V. A. Faas to obtain spectrograms of natural formations from an aircraft. In both cases the sighting tube of the spectroscope was replaced by a primi-tive cardboard camera. Regrettablyp it was not possible to obtain usable spectrograms in either case. For use in the present research the spectrograph was subjected to considerable remodelling (Fig. 1). A metal camera equipped with a flag shutter was made. Then a photometric device was made consisting of a disc with 10 diaphragms located in the collimator tube between the lens and the aperture. By rotating the disc any desired diaphragm can be placed in line with the light rays. Later g a view finder was added to the collim-ator. It consists in a tubeg at one end of which there is a small total-reflection prism located in front of the exit pupil. Initially the spectro-graph was placed on a wooden base which was attached to a photospectro-graphic tripod.
4
-In 1933 the セッッ、・ョ base was replaoed by a metal one, and azimuth and a ItituGfJ
circles vere added to the epectrographe The linear dispersion of the
spectro-graph is 15 mm. between the C and H lines, Bnd up to 11 spectrograms of the usual width (eee above) are plaeed on the photographio plate (; x 3 cme)e
The spectrograph was in use from the middle of 1932 to the end of 1935e A
large number of spectrograms were obtained with this speotrograph. In 1933
and 1934, this spectrograph was used by the author to obtain spectrograms of natural formations from an aircrarte
6. TSpNpI.IoGoA o
&
Kg Glass Spectrograph (field) - The intrinsic deficiencies of the foregoing spectrograph, constructed in a ウ・ュゥセュ・エィッ、ゥ」。ャmanner, frequently complicated the work o Moreover, the glass spectrograph (N.leLe) could only be had on short term loan which was at times inconvenient. Therefore, by the time field operations were started in 1935, a new
spectro-graph was made. It was constructed specially for operation under field cona
ditions e The spectrograph was designed by the author
Bnd
Yaa constructed atthe machine shop of the Astronomical Observatort, Leningrad UniversitYe The
spectrograph (Fige 2) has glass optics, consiating of two equal (in the colla imator and the camera) triple Steinheil (Munich) lenses having an aperture
セ
of 27 mm. and a focal length of 110 rome and the prisms were of Stein and
Reiter flint glass with a refractive angle of 60° and a baBe length of
54
romeThe linear dispersion of the spectrograph is
12
rome between the C and H lines.The spectrograph has a symmetrical slit
ot
the Wadsworth type (33), a simple*
The lenses, belonging to Professor G. A. Tikhov, were given by him to theInstitute specially for the oonstruction of the speetrograph intended for
.. 5
-view findor of the previous type ond separnte nzimuth and vertical circles located on a metal base which, along with the spectrograph, io mounted on a standard theodolite or photographic tripod. The virtue of the aboveeomentioned slit is that when the screw is turned in the direction to close the slit, after the flanges have come into contact, both flanges begin to be displaced. This prevents damage to the edges of the flanges. As a photometric device
the spectrograph has two replaceable discs with circular diaphragms. Each disc is enclosed in a metal holder and, along with the latter, can be placed in the prism container between the collimator lens and the prism, in turn.
On each disc there were several diaphragms and on both discs the entire
series of diaphragms are placed, from the smallest to the largest. The spectro-graph is equipped with six holders fOT plates having the dimensions 5 x 6 em.
Up to 17 spectrograms of standard size can be placed on one plato. The camera is equipped with a focussing device, as well as one for moving the plate-holder and the angle of the p18tee o h o l d e r part to obtain a sharp picture over
the entire spectrum and it is equipped with a standard flag shuttero
The spectrograph described was in operation trom the second half of 1935 until the end of the research (1938), and most of the spectrograms were ob= tained with it. The spectrograph was found to be satisfactory for the work.
One more important point should be noted. All the three field spectro= graphs described above, which were actually developed during this research» have almost equal dispersion. Therefore, the material obtained (spectrograms) can be considered comparable.
7. The Ts.N.I.I.G.A.& K. Double Prism Spectrograph for the Infrared Fegion of the Spectrum - The spectrograph was made in 1937 and was designed for a relatively detailed study of the spectral reflective properties in the
... 6
-infrared region of the spectrum. The author, together with Vo Ao FS8$,
compiled a list of the technical requirements which the new spectrograph
had to satisfy. The calculation of the optical system was made by scientists
of the Pulkovo Astonomica1 Observatory, G. G. Lengauer and K. A. Kirl110v
under the supervision of Professor G. A. Tikhov. Moreover, the calculation
was checked by the optician of the construction bureau of the nOosgeosamkan
plant, N. F. Kozyrev. The construction of the metal parts of the
spectro-graph was designed by Afanasev and sォカッイエbovセ The spectrograph was made in
tho shops of the above concenne.
The spectrograph has a non-symmetrical slit having a screw of 0.5 Mm.
pitch. The lens of the collimator has a focal length of 400
Mm.,
and thediameter of the effective slit is 38 Mm. The spectrograph is equipped with
two prisms made of the 23rd grade of glass (L.Z.O.S.).
The linear dispersion of the spectrograph 1s 16.3 rom. between the D
and
p
lines (AA=
589.3 セ and 939.0 セ respectively). The region ot thespectrum having a wavelength of approximately
A.
I!!l 1000 セ vas located in themiddle of the plate (45 x 55 mm.) and from the direction of the visible region the spectrum begins with a wavelength of about 525 セN
The photometric device, as in the previous spectrographs, consists of
rotating discs with diaphragms. The disco are placed in holders and can be
inserted in the prism box between the collimator lens and the first prism.
Between the second priSM and the camera lens there 10 S color tilter intended
to attenuate the rays in the visible region of the spectrum Bnd thus prevent strong aureoles. The camera is equipped with an ftlndustar" lens Bnd all the devices for adjustment.
- 7
-A cardboard cowl is fitted on the slit head to serve an Ii shutter. pイ。」セ
tice showed that because of tho low luminosity of the ウー・」エイッセイャャーィ and the
rel-atively low sensitiVity of the infrared photographic ーャ。エ・セ requiring long
ex-posures (up to 3 and more ュゥョオエ・ウIセ this shutter did not give any noticeable
decrease in the sharpness of the exposures and was completely satisfactory for the work.
The spectrograph was mounted on an angle bracket which Was attached to a
theodolite tripod. The azimuth circle was mounted on the bracket and the
ver-tical circle on the prism housing of the spectrograph. Because of the angular
form of the bracket the speotrograph could be directed towards the lowest
poss-ible point. However, this type of bracket required a counter balance. As a
result the total weight of the spectrograph was excessive and the spectrograph
was not convenient for field work. The spectrograph was used for one season
in 1937.
Aerial Spectrograph
8. The Ts.NoI.I.G.A.& K. Aerial Spectrograph セ The spectrograph was made
according to a design submitted by V. A. Faas in 1935. It was intended イセゥュ]
arily to study the spectral properties of atmospheric haze. In contrast with
ordinary spectrographs it was made strong and compact and without protruding
details (Fig. 3)0 All the optical parts of the spectrograph are perManently
fixedp being located in their proper position during the initial adjustment of
the instrument at the time of assembly. The slit of the spectrograph is fixed,
howeverp when necessary the slit width can be changed within small limits. The
fixed slit was chosen so that it could be replaced by a similar slit in case of
8
-standard disc with diaphragms ond uno located between the collimator lens and the priem. The spectrograph has a ウ・ュゥセ。オエッュ。エゥッ shutter. The 」ッャャゥセ
mator and the camera of the spectrograph are equipped with "Ortagoz" lenses with a relative stop of F 1:4.5 and a focal length of 135 Mm. The prism
o
was made of L.ZoOoS o 22=type glass and has 8 refractive angle of 55 0 The
linear dispersion of the spectrograph 1s 9 mm. between the C and II lines. The plate-holders of the spectrograph were made for a 3 x 60 5 em. plate and
up to 24 spectrograms could be placed on one plate. The spectrograph described above was used by the author to obtain spectrograms of natural formations from aD aircraft in the summer of 1935.
5. Calibration of the Spectrographs
As stated above the diaphragm method Vas used in this work to obtain spectrograms of the photometrio scale o !hereforep all tho spectrographs
were equipped with the appropriate devices. Tvo of the spectrographs g the aerial and field spectrographs made by TsoN.I.loG.A.& Kog were specially calibrated to check the applicability or the law of proportionality to the square of the diameters of the diaphragms whioh permit the passage of light rays.
The calibration of both spectrographs was achieved by the same method using a photometric bencho The spectrograph was mounted on one end of the
bench and the collimator was directed along the bencho The bench was placed in a dark room and was covered with & black cloth. An opal glassp
attached in a cardboard tube with dlaphragmsp waS placed in front of the slit. The inside surface of tne tube Was blackened to eliminate lateral
- 9
-reflections. The length of the tube WllS 257 rom. The free end of the tubop
located opposite the slit of the spectrograph, was aligned along the axis of the bench. An electric lamp of a projection type, 120 V.p 500 w., was placed
at the some end of the tube on the moving taThle of the bench. The filaments of the lamp were arranged in a plane perpendicular to the direction of the spectrograph. By moving the mobile table the lamp could be placed at any desired distance from the slit or, to oe more exact, from the opal glassp
within the limite, of course, of the bench (4 meters). Ordinary diaphragms of the photometric bench, which eliminated the reflections from the black cloth on the benchp were placed in the path of light passing from the lamp
to the tube. The lamp was powered by alternating current from th9 city power circuit and the power was kept constant with a rheostat and was controlled with an ammeter.
The essential point of the calibration consisted in comparing the ウー・」エイッセ
grams obtained from various diaphragms with those obtained by varying the dis-tance of the lamp from the opal glass. The distances in the latter case were selected in such a manner that the ratio of intensities of a pencil of light striking the photographic plate from various distances was approximately equal to the ratio of intensities obtained with various diaphragms. It is known that the illuminance E on the opal glass Mp coming from the lampp according to
the law of the inverse square, is proportional to E セ セrRー where R is the distance between the lamp and the opal glass. Therefore the series of spectro"" grams obtained with the same exposure and with the same diaphragm but at various distances from the lamp represents a photometric scale based on the law of in-verse squares of the distance.
」セ 10 ".,
Therefore t,he calibrntion consist.ed 1n obtaining first B scries of spectrograms at various distances between the lamp and the opal glass and then in ッ「エ。ゥョゥョァセ on the same photographic platep a series of spectrograms using various diaphragms but at the same 、Aウエヲャョ」セ trom the lamp" To obtain marks on the spectrograms indicating known wavelengths on the comtinuou9 unlined spectrum of the lampv a supplementary line spectrum of mercury vapor was superimposed on the spectrograms by light from a mercury arc before the exposure of the spectrograms" As a result p the following very bright and sharp lines of the mercury spectrum were obtained on the epectrograms3
AA
40407; 40708; 435 08, 49106, 51.6,,1 and UWWLLPセN These 11ne3 vere used to construct the dispersion curveo The spectrograms were measured on the Mollmicrophotometer andp as a resultv optical densities \lere obtained in the
regions of the spectrum every 20 セ from
A.
400 セ to("l
600 rtyJ" From the densities obtained from the scale of distances characteristic curves were plotted separately for each vavelength measured and trom the densities of the spectrograms of the diaphragm scale the ratios of intensitlas were finally foundp using the intensity of the smallest diaphragm as unitYo Table I showsthe average data obtained from all the
AA
measured vhere log I corresponds to the logarithms of the intensities calculated from the diameter of the dia-phragm, log i was obtained from the calibration and 6 log I from the deviation •An examination of the results of the calibration gave the folloving イ・セ suIts:
1) The deviation A log I rertlains within the limits of the standard accuracy of photographic spectrophotometry and in case of large diaphragms it vas generally insignificant.
11
-Thus the calibration showed that the law of the proportionality of
intensities to the squares of the diaphragm セ。ュ・エ・イX is correct, and
con-sequently the 、ゥ。イセイセpLュ method was completely satisfactory for
spectrophoto-metric research.
6. Microphotometers
In measuring the spectrograms the follo'oling fiva ;.:icrophotometers were used at various times:
1. A Qartmann visual ュゥ」イッーィッエッセーNエ・イ wnde by the firm ASKaniya Verk was
obtained by Ts.N.I.I.G.A.& K. セョ temporary ャッ。ョセ
2. A Martens densitometer belonging to the P. F. Lesgaft State NatUral
Science Institute.
3. AセQPQQ registering microphotometer belonging to Ts.N.I.I.G.A.&K.
4.
A Zigban registering microphotometer belonging to the Institute ofGeol-ogical Science, Academy of Sciences, USSR.
5. A K. Zeiss objective microphotometer with visual evaIua td.on of the dis=
placement of the galvanometer spot on a scale (simplified model), be-longing to the ubovl'> Institnte.
A detailed description of the miclophotometers listed is not given since
it can be found in the appropriate literatl1re (32g 33). Only certain specific
peculiarities of the first three instruments are given because they are of
some interest in this vork , By far the largest number of spectrograms'
(several thousand) were measured with the Holl microphotometer. This
instru-ment was very rapid and simple in operation and sufficiently accurate. The
Lセ 12
-graIns vcr e obtained and measured in a similar way. In all regions the spectrogram9 were rneaDured overy 10 ョセ and the blackening vas expressed as optical densities D.
Tho Gartmann visual microphotometer .. It is known that this instrument has a photometric wedge and a polar1zinr system. In this work the \ledge was used to measure the spectrograms. Because the manufacturer's wedge was easily
、。ュ。ァ・、セ and unsuitable for measuring, the authors made a new wedge from a photographic plate by the usual method. The wedge was calibrated for optical density. For this purpose, sensitometric strips \lere used which were ob-tained on a Sheiner sensitometer. The densities of the strips were measured with a セセイエ・ョウ densitometer.
Martens densitometer .. For this instrument a special carriage was made
having a micrometer screw with which it \las possible to measure spectrograms although, as is known, the densitometer was not intended tor this work. The carriage \las mounted in such a manner that the dividing line between the densitometer fields came across the spectrogram (Fig.
4).
Thus, by using the micrometer ウ」イ・|ャセ one could bring any portion of the spectrogram to thedividing line between the fie1dsu The measuroment itself consisted in making the dividing line disappear by rotating the analyser in that portion where the spectrogram appears. In this case, the optical density Dcan be found by the formula
D III 2(10g ctgOC
o
+ log tgo..)!lwhere OC
o
is tho reading of the analyser oircle when the negative is put on fog and セセ is the reading when it is put on the portion of the spectrogram to be measured. As a result the optical densities obtained for the ウー・」エセッセ13
-The Hartens densitometer is very convenient to use ond the accuracy
of measurement was in some coses h1ghcr than that obtained with the g。イエュセ。ョョ
microphotometer. Lorge densities (in the order of 2 - 3) were particularly
convenient to measure with the densitometer, whereas when they ore measured
on a Gurtmann microphotometer, as is known» large errors are obtained. With
registering microphotometers, e.g. the Moll microphotometer, densities
greater than 1.7 セ 1.8 generally cannot be measuredo
Moll registering microphotometer - The author had at his disposal one of the
latest models of this instrument which gave records in two scales: 1:7 and
1:50 at three different rates of motion of the spectrograms. In the present
research the spectrograms in the visible region of the ウー・」エイLセ were always
measured with the 1:7 scale and the infrared with the 1:50 scale o In both
c&ses the measurements were made at a moderate rateo By a preliminary check
of the instrument it was estoblished that at moderate rates the effect of the inertia of the instrument, noticeable when measuring spectral lines, was
not observed on the continuous portions of the spectrumo Initially, records
were obtained on photographic paper, later aerofilm was used. The latter
has the advantage that it is subject to very little deformation during pro-cessing (developing, fixing, washing), and any deformation of the record is of substantial importance since it can have a strong effect on the accuracy of measurement.
The essential point of measuring ,,,ith a Moll microphotometer consists
in measuring the amplitudes of the displacement of the galvanometer spot, whichg
as is known, is proportional to the thennoeleotric current and the latter is
'ft 14
.-portion of tho opoctrogrnm being moasured. Therefore g i t is easy to obt.ain tho optical density of thnt portion of the spectrogram. For this purpose , the ordinate IX of that point of the record which corresponds to the wavelength of the spectrum is measured from the zero line of the record. Thon" in the same abscissa the ordinate
p
of the fog is measured. Next the amplitude of theウーッエセ when recording the fog
P ,
is taken as the intensity of the bundle oflight strik1mg the negativep whereas the amplitudep when recording the given
portion of the spectrum ot is taken as the intensity of the bundle of light passing through this portion of the spectrogram. In this case, the ratio セo. corresponds to the coefficient of transparency of this portion of the ウー・」エイッセ
gram and the inverse
イ。エゥッセ
corresponds to the opacity, the logarithm of which corresponds to the optical density D.Thus the optical density is found by the formula:
D g log
,'3 -
log 0:.. ,where the value of Dg as in the previous caseg is corrected for the fog den-sitYo
7. standard Surfaces and Their Testing
Initially, when the method was being developed and tested, Professor G. A. Tikhov used the surface of pressed magnesium oxide powder as a standard. This surface was prepared anew for each new series of negatives. Obviously,
such a surface does not have the requirements of a standard. Therefore, the passage from separate experiments to a systematic study required a more per-fect surface as a standard, e.g. etched opal glass. Two samples of glass
15
-Observatory and the author uned a glass made by the Lesgaft Astonomicol
Division of the Institute. Soon this standard was replaced by another. The
esnontial deficiency of etched opal glass is that it is to some extent trans-parent and therefore its reflective property depends on the surface on which the glass is placed.
A test was made with the surface of baryte powder highly compressed in
a special metai container. Several such surfaces of so-called test plates
were made by the Photometric Laboratory of the All-Union Institute of
Met-rology and Standardization under the direction of Professor P. セQN Tikhodeev.
However, even these surfaces, regardless of their good photometric properties, were found to be unsuitable for field work because of their fragility; when shaken or turned over the baryte plate simply falls out of the container as
a powder. Moreover, cleaning the surface, which unavoidably becomes soiled
under field conditions, is almost impossible.
Continuing the testing of other standard surfacesg under the advice of
V. V. Sharonov, the author tested etched gypsum plates made of chemically
pure gypsum containing 10% magnesium oxide ーッキ、・イッセ The gypsum plate used in
the test had the dimensions 10 x 10 cm. and a thickness of 1 cm. The tests of
the gypsum plate (see below) showed that its surface js sufficiently ortho-tropic and does not have selective properties in a wide range of wavelengths;
at least, in the entire visible range of the spectrum and up to
A
1»000 セin the infrared zone. In addition, the gypsum plate was found to be stronger
R The gypsum plates were made by V. V. Sharonov who spent a great deal of time in selecting standard surfaces when he made visual and photographic measurements of the integral reflectances of a large number of natural
16
-than any of the other standarda and waB more easily cleaned. The gypsum plate could be clennod of foreign matter and the etching ret.ained by rubbing the plate with et.ched glass. From the end of 1932 the gypsum plat.e was used ・クセ elusively. However, after 1937, when it was accidentally broken, baryte paper placed under photographic bromosilver paper was used as a standard aurfacs.
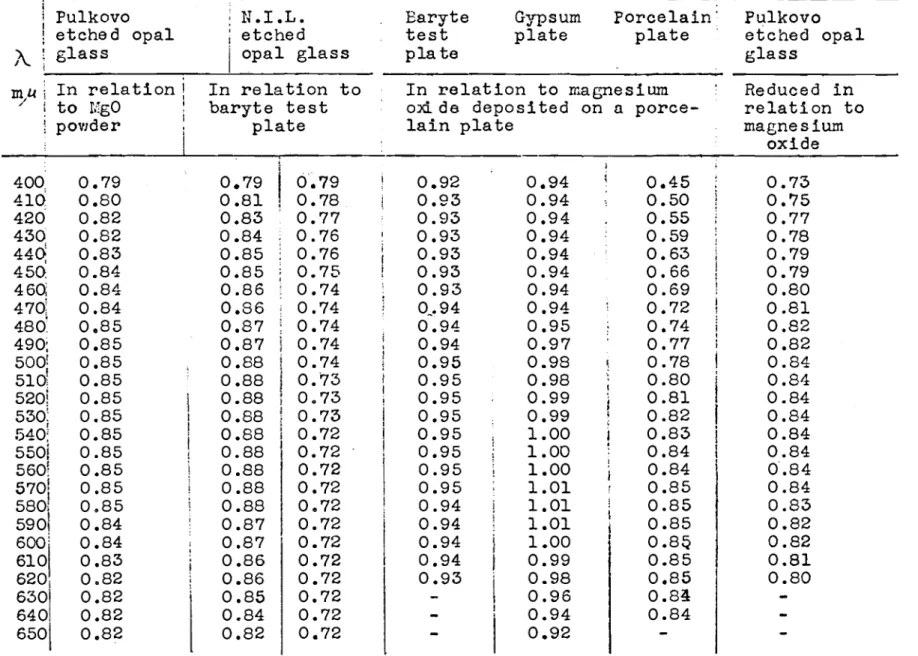
Thus t.he basic standard used to study the majority of natural formations was the gypsum plate. The spectral reflectances of the relatively smnll number of objects, initially obtained from the etched opal glass, were reduced in relation to the gypsum plate. It was possible to make the reduction after the spectral reflective properties of the gypsum plate, the etched opal glass and several ot.her standard surfaces had been compared.
The surfaces were compared by photographic spectrophotometry in the foll-owing manner:
I. Et.ched opal glass, Pulkovo sample
20 Etched opal glassll sample from the Lesgaft Institute
30 Baryte test plate
iセッ Gypsum plate 5. Porcelain plate
a) in relation to pressed magnesium oxide powder;
b) in relation to the baryte test plate
in relation to the baryte test plate
l
i n relation to magnesium oxide deposited on a poroelain plat.eThe magnesium oxide surface was deposited on the porcelain plate by burning me.gnesium powder under it. The thickness of the layer obtained in t.his manner was
1.5 -
2&0 mm.Table II gives the spectral reflectnnce obtained for each standard ウオイセ face in relation to the surface with which the comparison was made. The last oolumn of the table gives the reflectances of etohed opal glass obtained by
17
-reducinB the reflectancos obtained in relation to the baryte plate to those in relation to magnesium oxide. The BBmo glass vas, moreover, compared 、ゥイセ ectly with magnesium oxide in vhich case the reflectnnces are given in the first column of the table. The reflectances obtained from the' above tvo methods are in reasonably good agreement.
The data given in the table sliovs that none of the standard surfaces has any important selectivity. A certain decrease in reflective property toward the violet end of the spectrum is observed in almost all surfaces. A part-icularly sharp deorease is shpwn in the case of the porcelain plate vhich obViously causes the noticeably yellowish shade of the latter. On the other hand, a certain increase, caused obViously by the bluish tint of the glass, vas observed vith the etohed opal glass supplied by N.I. L. The most "neutralII
effect in r.elation to magnesium oxide was shown by the baryte test plate for vhioh, as in the oase of the gypsum plate, the highest reflectances were obtained.
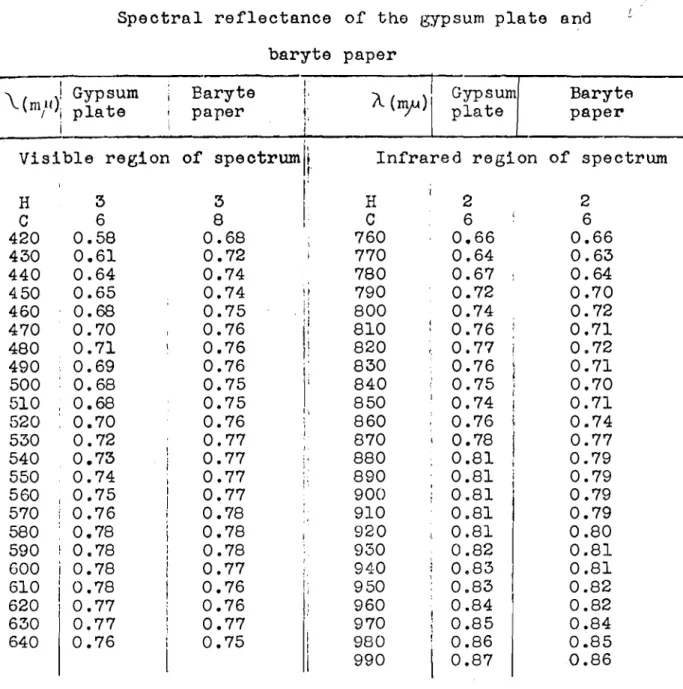
Other than the comparison of standard surfaces a measurement was made of the absolute refleotanoe of the gypsum plate and the baryte paper. The measurement was made by two different methods. however, in both oases, the Taylor sphere was used. It was obtained by the author on temporary loan from i
the All-Union Electrotechnical Institute (V.E.I.).
As is known, with the Taylor sphere it is possible to measure the
direct-diffuse reflectance
p,
i.e. the ratio of the light Fo reflected by a given surface in all direotions to F, the light falling on this surface, but not the liminance factor r. Keeping in mind that all the standard surfaces used vere sufficiently orthotropic the reflectancep
can be taken as the luminance factor r.- 18 '.
By the first method" the reflectance vas measured in the manner out.-lined beLovs
The surface to be measured (gypsmn plate) was placed under the lower opening of the sphere. A selenium cell was placed at the side opening
(Fig. 5). The gypsum plate and the internal surface of the sphere" whitened vith maenesium oxide" were illuminated alternately. In both cases9 the ァ。ャセ vanomater spot was read on the scale through a telescope.
The theory of the Taylor sphere states that the luminance factor of a gypsum plate
l'
g iswhsre El is equal to the illumination on the photocell when the gypsum plate is illuminated and E2 - when the sides of the sphere are illuminatedo
Suppose that the galvanometer spot セ is proportional to the luminance on the photocell" which is close to the actual value" then by moving the scale the required distance from the galvanometer it is easy to ヲセョ、ᄏ from the meas= urement of the reflection" the reflectance
P
g of the gypsum plate which is
obviously
where "rll is the deflection of the spot when the gypsum is illuminated and セR when the inner walls of the sphere are illuminated. The coefficients were measured with white light, then separately at several regions of the spectrum" in which case the appropriate color filters were placed in front of the photocell. The effective wavelength
'\'3
of each color filter Was obtained by taking into account the spectral transparency of the color filters and the spectral ウ・ョウゥエゥカゥエセ セヲ the photocell. Table III shows the reflective coefficients of the gypsum plate for white light and for each19
-region of the spectrum
A
セ•
The data obtained indicote the followings
1. Within the regfom of the spectrum measured, from ,\. 550 セ to ). 630 セ there was no indication thot the gypsum plate had any selective reflection. 2. The reflectance
fg'
on the average, was 0.89. It was equal to the aver-oge absolute value of the luminance factor r of the gypsum plate obtained in relation to magnesium oxide and recalculated with respeot to the absolute value. In fact, Table II shows that the average luminance faetor r of the gypsum plate is 0.97 in relation to magnesium oxide. If it is assumed that the absolute reflectance Pm of magnesium oxide is 0.92, the value obtained by Sharonov,0.89.
the absolute luminance coefficient r of the gypsum plate is
The spectral reflectance of the same gypsum plate and of the baryte paper were measured by the second method. The measurements were made in the following manner. In place of the photocell, a spectrograph (field spectro-graph Ts.N.I.I.G.A.& K.) was located in front of the side opening of the sphere, in which case the slit of the spectrograph was located on the cross-sectional plane of the sphere. Thus light rays reflected ヲイッセ the internal opposite wall of the sphere entered the spectrograph. The test surface, as in the first metn d, was placed under the lower opening of the sphere (Fig. 6). Later, the uBual method of. photographic spectrophotometry was used. For research in the visible region of the spectrum Ilford Soft Gradation Panchromatic Photographic Plates were used and for research in the infrared region Agfa Infrared 950. The photometric scale, conslsting of a series of spectrograms, attenuated in sequence with diaphragms of known relationship, was obtained by illuminating the interior surface of the sphere. Table IV
- 20
-gives the average spectral rofloctonceo. エセ A for oach surface measured. Tho upper lino of the table gives tho nunlber of negatives and the second line gives the number of spectrograms on these negatives used in calculating the reflcctances. The data given in the table permits tho following conclusions.
I. The spectral reflectanceof both surfaces is noticeably reduced in the direction of the violet end of the spectrum and the greater decrease occurs with the gypsum plate. The analogous decrease, it is true, was found to be somewhat weaker when the gypsum plate was compared with magnesium oxide (see 。「ッカ・Iセ
2. In the regions of the spectra near
AA
510, 780 and 810 m? of both surfaces, shallow minima are observed. However, the occurence of even these waves was not definitely established.3. Attention is drawn to the fact that the luminance factors of both surfaces were somewhat low and in comparison with the values obtained from the gypsum plate by the first method the difference is very large.
Thus the average reflectance of the gypsum plate, measured by the first method» is Ou89, whereas with the second method the average luminance factor of the same plate Was 00 7 1 . It is fully possible that there was some systemat=
Ie error in the second method of measurement. Regrettably, the author'could not repeat the measurements made by the second method because it was ョ・」・ウウセ
ary to return the Taylor sphere.
Of the three different measurements of the reflectance of the gypsum plate, two, namely the comparison with magnesium oxide and the measurement by the first method on the Taylor sphere, gave the same results. Therefore the values obtained with the Taylor sphere by the first method were taken as the final values of the spectral reflectance of the gypsum plate.
21
-Thus i t cnn be considered that the gypsum plato ond the baryte paper do
not have very selective properties and that the average absolute luminance
f3ctor of the gypsum plate is 0.89 vhich should be taken as the same for the
entire visible end infrareo regions of the spectrum. Moreover, considering
that the reflectance measured on the Taylor sphere by the second method vas
I
almost the same as theイ・ヲャ・」エセョ」・
of the gypsum plate and the baryte paper,\
:the some average luminance factor 0.89 can be taken for the baryte paper.
The average luminance factor obtained for the standard surfaces for
practical purposes is close to unity. The author, therefore, took all the
spectral luminance factors of natural formations measured directly in relat-ion to the gypsum plate or the baryte paper as being practically absolute.
8. Photographic Materials
In measuring the spectral reflectance in the visible region of the spectrum Ilford Soft Gradetion Panchromatic photographic plates and Ilford Special Papid Panchromatic, both vith an anti-halation layer (backed), vere
used. The spectrograms on these plates extended from
A
400 my to A6505"
with normal operation.
For studies in the infrared region of the spectrum Agfa infrared 730,
810, 850 and 950 vere used (the latter variety was used in 1937). All the types of infrared plates together covered the infrared region of the spectrum
,
",from 700 mu to ,"'. 900 - QPPPセN Thus, the spectral reflectance 1n the
region between ,\650 mu and ..:', 700 mu was not studied. Single cases using
photographic plates sensitized by the author to the light of the above indic-ated portion of the spectrum constitute an exception.
.. 22
-Th8 pF.lnchromatic photoGraphic plates usod in the work were of differing
deGrees of contrast. hッキ・カッイセ the infrared plate9 were sharp and had good
」ッョセイXウエN For this reoson mony セー・」エセッァイ。ュウ in the infrared light were ッカ・イセ
cxp;)sod in the region of maximum sensitivity and have very weak densities on
both sides of it. These spectrograms セッオャ、 be meanured only on relatively
small portions of the spectrum. To increase the spread of a portion of the
spectrlrn it was often necessary to obtain a new spectrogram at different ex=
posuTes. Depending on the optical density of the ウー・」エイッァイ。ュセ some ウー・」エイッセ
grams (shorter exposure) were measured in the region of maximum sensitivity
セィ・イ・。ウ others (longer exposure) were measured at the ends of the spectrum.
Other than spectrographing natural formationsg for the study of the
spectral reflectance p in some cases photographs were taken of these
form-ations with an ordinary camersg "Photokor"p in the light of specific regions
of the speetrum. In this coseg photographic plates having various spectral
sensitivities were used in combination with the corresponding color filter
made in the Ts.N.I.I.G.A.& K. laboratory and designed by V. A. Faas. The
designation of the color filters aTe given according to Faes. The expvsures
obtained were then used first as a control for the results obtained from
measuring the spectral イ・ヲャ・」エ。ョ」・ウセ then to check the rational selection of
photographic materials £01' the aerial photography of specific objects based
on the spectral reflectanceo
The photographs vere taken with the following combinations of films and
- 23
-Unsensitizod plates N.l.K.F.I. without color filters
Orthochromatic - cO;J;or filters Panchromatic - color filters Infrachromntic - color filters
A:,
=
410mp
FO-2;t
I,=
450 J'I9.l FO-4 aセ=
520 JJY1 FP-5 ,l,.-;)=
610 Ill)1 FP-8,..'-
:-,=
640 mu / FI-2 aセ-
-
810?1
A
e designates the effective wavelength of each combinationoThe spectral transparency of the color filters was measured by the author
"
with a Konig-Martens spectrophotometer.
Table V gives the spectral transmittance coefficients TA of the COIOT filters used and the relative spectral sensitivity SA of the plates. In the latter case, the maximum sensitivity is taken as unity for each type of plate. The data concerning the sensitivity was taken from the work of V. V. Sharonov
(34).
Fecently, an atlas of the spectral properties of present photogtaphic material was published by Yu. N. Gorokhovskii and O. D. Berteneva. The atlas gives the sensitivity of twenty different types of photographic materials (35)024 -CHAPTER III
OBTAINING tiQセ MATERIAL
9. Some Photometric Properties of Natural Formations
The spectral reflectance of natural formations was studied in the foll-owing regions of the U.S.S.R.I
i o Tundra, Kola Peninsula, Khibina (1).
ii. The northern fOTest belt, in the region of Leningrad (2)0
iii. The black earth region, Voronezh Province in the region of Ueman
(3).
iV. Forest-stepps zone, Uk. SoSoF., Poltava Province, near the villageof Getmanshchin
(4).
v. Steppes(a) Chkalov Province in the region of Sar, the Khalilov grain sovkhoz
(5).
(b) Cherkess autonomous province in the region of Cherkessk (6)0
via Deserts
(a) Turkmen SoS.R., in the region of セセイケ (Oasis) (7)0
(b) Kara-Kumy, 1n the region of Uch-Adzhi (8)0
viio Mountainous region, Northern Caucasus, in the region of Tebarda
(9).
The points listed are shown on the map (Fig. 7), the numbers in brackets correspond to the numbers on themapo
The areas selected were characteristic of specific types of landscapeso
On the other hand, attention was paid to accessibility and to the cost of trans-portation. The natural formations studied 1n each area comprised a complex of basic geographical elements of a speoific type of landscape o In the tundra, mosses and lichens, peat bogs and swamps, dwarf birch and juniper, etco, were studied0 In the northern forest belt various types of trees in different
25
-stnges of growth and phosca, many typos of gross-covered areosp various
field and garden crops, etc., were studied in detail. In deserts, sands, takyr (salt marshes), haloxylon, and other objects characteristic of des-erts, were studied. セュョケ objects characteristic of a given landscape were also studied in other regions if they occurred. On the other hand, some objects that are typical of a number of landscapes were studied only in one region. Thus, for example, forests that are widely distributed (pine, birch, aspen and others) growing in extensive areas of the European and Asiatic parts of the Soviet Union were studied only in the northern forest belt. Nevertheless, the data obtained on their spectral reflectance can be considered as characteristic of forests in other areas. The optical properties of natural formations of anyone species do not depend on the place in which they are found. However, large differenc9s were observed in the reflectance of individual examples found in one region.
All the natural formations studied can be divided into the following groups:
A. Forests and shrubs B. GrQss
C. Mosses and lichens
Do Field and garden crops E. Outcrops and soils F. セッ。、ウ
G. Water surfaces, water bodies and snow.
Moreover, some man-made objects were studied which comprise still another group:
H. Buildings and building material.
As a rule, the spectral reflectance of natural formations like for-ests, shrubs, grass-covered areas, and other vegetation, were studied in
26
-study of troes continuous growths of ono particular species and approximately tho same ago (Fig. 8) were aelected. Exceptions were made in the case of trees or other formations that are not widely distributed (Fig. 9). In the study of grass-covered areas, field ond garden crops, outcrops and soilsS! more or less even and rolatively large areas were selected (Fig. 10). Thus the data obtained refer basically to average natural backgrounds.
As regards forests it was first intended to obtain data for the basic races Hーゥョ・セ fir, birch and ospen) on young and fully developed trees, and in each cose during the folloving stages of developments young leaves,
fully developed leaves, late summer green, fall coloration, and winter state. The first two phases in the oase of coniferous races, the term "young leaves" referred to the appearance of new needles, not yet fully developed and "full leaf" セ fully developed young needles. Unfortunately, because of adverse weather conditions, it was not possible to obtain spectrograms in all of these periods.
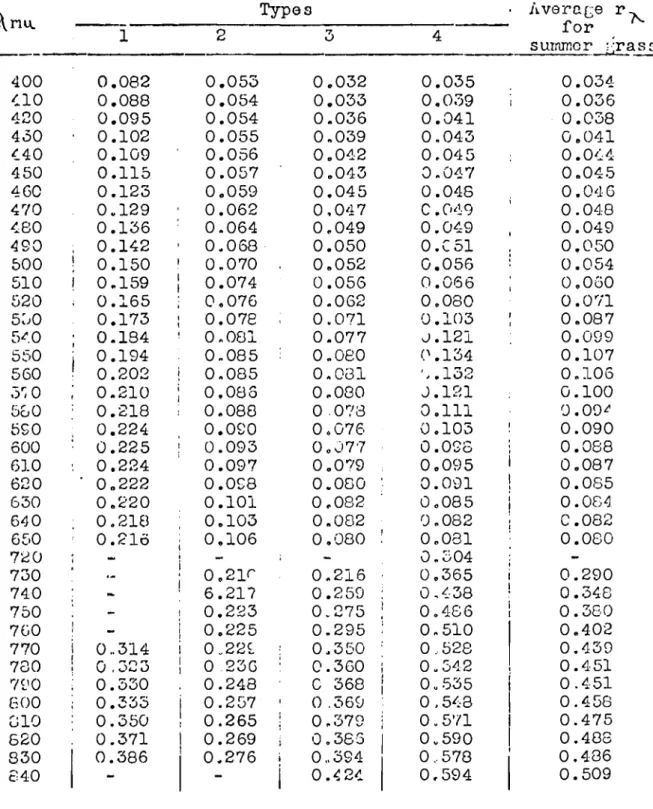
Grass was studied, firstly, at various stages of growth (young grass, flowering meadows, mowed meadows, etc.) and secondlyS! by type (dry valley grass, flooded meadow, pastures, alpine meadows, steppes, etc.). Some field ond garden crops, e.g. wheat, rye, and others, were also stUdied in various stages of growth. In somo cases the dependence of the spectral reflectance of grass on direction, height of the sun, state, etc., were studied.
Soils and earth roads were studied in almost all the regions listed above. In some cases the objects were studied Vセー。イ。エ・ャケ in the dryS! moist, and even wet states. Earth roads were studied near inhabited areas where they were made of the same soil as the surrounding areao Usually the roads
Snow 27 Snow
-covered nr'eus wore studied on Inrgc level fields. Unfortunatelyg adverse
'"enther conditions did not permit the study of snow in its various states
and in various directions. Holutivoly little datu wos obtained for "later
surfuces because of technicol difficulties arising from taking spectrograms
in the nadir direction. The study of water surfaces in other directions is
of little value because of the strong mirror effect.
Surface of natural formations is highly varied. In some casesg for
example, forests, shrubs, and to some extent other vegetationg the concept
of surface is arbitrary. In fact, the surface of the listed objects is
the sum of separate large or small elements of which the surface can be
convex, eog. roots of trees, or relatively flatg e.go grass-covered areas,
field crops, etc. The disposition of surfaces in relation to the
horizon-tal and the position of the sun is no less varied. All of these factors
had to be taken into account in taking the spectrograms, and in obtaining the spectrogram scales it was necessary to place the standard surface in
the same relative position as the natural surfaces. It must be stated that
in the literature there was hardly any mention of the method of field
spectrometry. Thus it was necessary to develop the method during the
re-search.
Natural formations were divided into three groups: horizontal, vertical
and inclined. The illumination of these groups is obviouslyvariedo
Horizon-tal surfaees are illuminated from direct rays of the sun and from rays
scattered by the entire hemisphere of the sky. The illumination of vertical
... 28
-10. Hethod of Obtn:tnlng SpoctrogrOlns
In the cane of horizontal surfv.ces the spectrograph wos placed on a tripod and directed at the surface vertically (in nadir) or at an angle of .450 and on azimuth of 900 from the sun. These conditions gave the minimum mirror effect. The azimuths were calculated in the following ュ。ョョ・イセ when the collimator was directed at an object located in the direction of the sun9 i.e. when rays reflected by the object in the direction away from the
sun entered the spectrograph, the azimuth was considered 00• The opposite
azimuthwBs considered as 180°. The intermediate azimuth, 90 and 270op
were taken counter-clockwise. The standard surface was placed horizontally and its position was checked with a circular level. The spectrograph was directed toward the standard surface at the same angle and at the same azimuth (Fig. 11) as used in studying the actual formation.
In obtaining spectrograms in the normal (nadir) direction the ヲッャャッセゥョァ
method was sometimes used. The spectrograph was held at arm's length and its collimator was directed downwards at the object. The shutter was open and the author walked over the object during the entire exposurep holding
the spectrograph in this position. Thus, in this casep the rays entering
the spectrograph were reflected by the object for a considerable time (up to 30 and more minutes). A speotrogram obtained in this manner can be 」ッョセ
sidered to be that of an average background. Thus the effect of specific spots of the object having various color shades can be excluded. The direction in which the spectrograph was moved was usually at an azimuth of 90 and 2700p i.e. it was directed at right angles to the sun and consequently
the shadow of the observer and the spectrograph did not interfere. This method could only be used on soils, roads, short grass, and some other form= stions.
- 29 n"
When the npcct.r-ogrnph \las mount ed on thn tr:tpod 8. fu:rthor method 1tro.c usods
the spectrograph wョセ[ directed t.owo rds tho object and "mn tightenod in such a manner that the spectrograph could rotate around the vert:l.cal axis but not in relation to the on61e of inclination. The shutter was then opened and the spectrograph Was 'rotated continuously to the right and to the left through an llzimuth of 5 to 100 during the exposure. This method was used in obtaining spectrograms of ohrubsg high gress and some field and garden crops.
With both methods the spectrogram of the standard surface was obtained with a fixed spectrograph. However» the spectrograph was directed at the same
o
angle as that used on the object» i.e. normal or at an angle of 45 and at an azimuth of 90° in relation to the stm. In studying the dependence of the re-flectunce on direction» the spectrograms were obtained usually in the following directions& norma1.0 15,0 30,0 45 p 60 and 75°,0 and at the following four azi-muths& 0ll 90 p 180 and 2700 in relation to the sun. The spectrograms of the standard surface were obtained either in the normal direction or at an angle of 45° and an azimuth of 900•
In taking the spectrograms of natural formations having vertical surfaces, such as trees,o high shrubs, some types of field and garden crops (corn, sun= flowers,o etc.),o vertical cliffs,o walls and othersg the spectrograph was placed
at a distance from the object (10 to 30 m. and in the case of forests 50 m. and more). The collimator was directed horizontallyp or slightly upwardg depending
on the height of the object. Moreover,o it was directed in such a itセョョ・イ that the reflection of the object entered the spectrograph at an azimuth of about l350p
o
or 225 in relation to t.he sun. In this 」。セ・ the sun was behind and some1-1hat to the side of the observer to give the greatest illRmination. During ・aセッウオイ・
- 30
-angle. The standard surface in this cane waa placed vertically and perpend-:
icularly to the spectrograph and was, thereforo, illuminated in the same manner as the object.
The arrangement of the spectrograph varied in the case of inclined ッ「セ jecta, depending on the nature of the object. The standard surface, as much as possible, waa placed in the same attitude as the object (Fig. 12).
As stated above, the illumination of the objeot and the standard surface must be the same. Thus the spectrograms were usually obtained セィ・ョ the sky was clear and seldom when the sky was clouded and then only when the clouds were low (cumulus, strato-cumulus, broken cumulus, etc.) and the total amount of cloud in the sky did not exceed 0.3; in this case exposures were made only when the sun broke through the clouds. In a few cases spectrograms were ob= tained when there was a continuous even cloud cover extending across the entire sky. Usually the spectrograms were taken near ュゥ、セ、。ケ beginning two hours before noon and ending two hours after noon.
Usually 10 - 15 spectrograms were taken on one photographic plate. Of these, 6 - 7 spectrograms formed a photometric scale and the rest were of the object under study; the latter were obtained either before exposures of the standard surface or after, but in either case both series of spectrograms were obtained continuously one after the other and under equal exposures. With ex-posures of 10 セ 30 seconds the total time of taking spectrograms on one platep including the time of changing the holder after each subsequent ウー・」エイッァイ。ュセ
changing the direction of the spectrograph, etc., did not exceed 10 セ 15 mln= utes. It is obvious that in this interval of time the illumination under tb3
conditions mentioned above remain practically constant and consequently the series of spectrograms of a standard surface form a calibration and a standard-ization of the negative.
31
-Each plat,o unuaLl.y Inc Iudod spectrograms of seve ra I objects, 2 --, 3 spect>
rogrnms of each formution with variouB diaphragms. If a spectrogram is
over-・クーッセ・、 with tho lnrge diaphragm tho spectrograms from tho other diaphragms
\oIill be of normal density. However, it frequently happened that all the
spectrograms of each formation were completely satisfactory for measurement. In order to increase the accuracy of the results spectrograms of the same
form-ation \oIere frequently obtained consecutively on several negativeso Thus in the
case of some formations 10 or more spectrograms were obtained o
In obtaining spectrograms with the less sensitive Agfa infrared plates
the exposures were at times as long as 40 - 80 seconds. Therefore, to decrease
the time of the total exposure on one plate the ョオュ「・セ of spectrograms per plate
was reduced to 6 - 8.
Because of the low aperture ratio of the special infrared spectrograph used in 1937 (Dee above), the exposures in obtaining each individual spectrogram on
infrared plates were 3 - 10 minutes. Therefore, the total time for obtaining
all the spectrograms on one plate was 1 -
It
hours. Therefore in order to ensureconstant illumination during this time the spectrograms were taken only with a cloudless sky and at mid-day.
The study of the spectral reflectance of natural formations from an air-craft was possible only for a small group of objects which had sufficiently
large and uniform surfaces. These included fir forests, pasture meadows9 fields,
ploughed and with green crops, and finally a cross-section of an area (fields,
buildings, roads). The flights were made from one of the airports near
Lenin-grad in an f-5 aircraft (with an open one-place cabin)0 The spectrograms '-lere
taken from an altitude of 300 m. and during the exposure the aircraft passed over the area at minimum speed and the spectrograph was directed with the
collimator pointine vertically downward. The time of exposure
for each separate spectroGram was 20 seconds. The low altitude
of the fliGhts excluded the effect of atmospheric haze. The
spectroGram of the standard surface was taken either before the
flight or ioonediately after. Each flight lasted from 20-30
minutes at approximately midday. The standard surface was
placed on the ground horizontally and the collimator of the spectrograph was directed vertically.
Table 6 shows the total number of spectrograms obtained during the entire study.
33 -CHAPTE:H IV
TREATV£NT OF MATERIAL
11. Development of Spectrograms
The photographic plates were usually developed with para-minophenolic developer according to the following standard formula (36):
Water to 1,000 cc.
Sulphite crystals 100 gm.
Paraminophenol 7.25 gm.
Soda crystals 135 gm.
The development of each individual plate took 8 minutes
at a temperature of l8-l90C. The above-mentioned formula,
adopted by international agreement for sensitometric tests, was the most satisfactory for developing spectrograms giving
soft passage from weak to dense optical densities; at the
same time it did not cause dense fog or halo. Nevertheless,
metol hyd roquinone developer according to the standard formula
was at times used. This was done when it was known earlier
that the spectrograms were underexposed and a more active
de-veloper was required. When the spectrogTams were over-exposed
the developing time was reduced. It should be noted that
inasmuch as spectrograms of the scale and of the object were taken on one plate the standard of developing was not
obliga-tory from the photometric point of view. Moreover, the use
of different developers had the advantage that it made it
34
-spectroGrams intended to be measured with a self-rocording
セッャャ microphotOTIillter wore of rolatively weak densities; on
tho other hand, those measured wit h a Martens dens i tometer or a Hartmann microphotometer were of greater density.
The developed spectrograms were fixed with either the
standard or acid fixer. After washine and drying the
nega-tives were covered wi th glass plates (on the side of the
light sensitive film). This protected the negative from
damage and soiling during measurement and in subsequent storage.
Only those negatives were selected for measuring which did not have extensive defects (side fog, halos, very dense
chemical fog, etc.). Rejections did not exceed 15%.
QRNセセイ・ュ・ョエ of Spectrograms and, Calculation of r・ヲャ・」エ。ョ」セ
The majority of the spectrograms were measured with a Moll
recording microphotometer. Measurements of the ordinates of the
records were .nade with squared transparent sheets. These were
made from graph paper pasted onto cardboard then reproduced on a
diapositive photographic plate. The first type of transparent
sheet was used in measuring records obtained from aero film. In
this case the records were placed on the sheet and the ordinate
was read through the transparent celluloid record. The second
type of sheet was used for measuring records obtained from
photo-graphic paper. In this case the transparent sheet on the plate
35
-0.1 nun. In order to increase the accuracy e. hand magnifier
was at times USEld. In measuring the ordina. te difficvlties
were often oncountered because of tho teeth appearing on the rocord, associated with the presence of lines on the
spectro-grams. In order to eliminate the teeth the negatives キ・セ・ at
times br-ought; out Of focus. When teeth were present on the
record, tlw ordinates, within known wave lengths, were measured
on all the records near the same teeth. This was done very
simply. Usually on each sheet of paper or film several records
were obtained, i.e. e1 ther from all the spe ctrograms of the
scale or from spectrograms of the object. However, since in
each series of this type the spectrograms were obtained with different diaphragms and were consequently of different ex-posure, the records, after measurement of the spectrograms of a given series, were placed one under the other respectively
(Fig. 13).. Under these conditions it is obvious that it was
not difficult to find the same teeth on the records.
On each separate sheet containing records the fog of the negative was recorded once and the fog was passed at the widest
interval between the spectrograms. The fog on the records
likewise had continuous teeth. However, these teeth have a
different cause, i.e. they are caused by the grain of the
light sensitive film 011 the photographic plate which has an
effect only with very small densities. In cases where the
fog is even the record is more or less parallel to the zero
... 36 ...
in opt i.c a 1 donsl.ty of tho for, from one s Ldo of the no ga ti ve to
the other. In readinG the ordinates of the fog a smooth ャゥセッ
was drawn first through tho record of the fog.. The line was
drawn symmetrically in relation to the teeth and the ordinates
were road in relation to this line. The ordinates of the fog
were measured against each measured point on the record of the
spectra. The mathematical mean was taken as the final value,
If several ウー・」セイッァイ。ュウ were obtained for one object,
they were all measured, if suitable, with the microphotometer. The arithmetic mean was taken as the final value of the
reflec-tance factor. It should be noted that the coloration of na tnn-aL
formations is highly varied and frequently not only different objects, for example, trees of the same species and age but
even different parts of one object have different shades. It
is therefore not surprising if in the processing of different spectrograns of the same object the reflectance factor varies
somewhat. The calculation of the average reflectances from
many spectrograms in some cases inorease the accuracy of the final value, but in other cases reduce them to an average background of the formation.
By measuring the individual spectrograms of a series of objects the average error in the reflectance factor was
deter-mined. It turned out that the averaee error obtained from each
individual spectrogram differed from the arithmetic mean of the reflectance factor by 6% but did not show any variation along the spectrum.
Sl'ECTHAL nEFLECTANCE OF NA'fUH1\L F'OHMATIONS paョセー II
CHAP'rEH V
GENERAL CHARAC'rEHIS'IIICS OF THE LANDSCAPES STUDIED
13. Regions of Field Work and 8. Short Description of tho
Natural Formations Tundra
The study of natural formations characteristic of tundra
landscapes was made in bhe central part of the Khibina mountain
range located on the Kola Peninsula. The Khibina mountain range,
consisting of igneous rocks of so-called nepheline syenite, oc-cupies an area of about 1,600 km. 2 and rises to an altitude of
1,250 m. above sea level. It forms a sharp break from the
sur-rounding marshy lowlands, the average height of which is
130-140 m. above sea level (37)9 The western depression
of
thecen-tral lowlands is surrounded by low hills and is one of the areas
typical of a tundra landscape. The surface of this area is
formed of turf hillocks about 3-4 m. high, held together by
per-mafrost. The basic vegetation found on the surface of the
hil-locks consists of creeping dwarf birch and heather which in
places form a continuous cover. At times one encounters almost
continuous lichen with individual turfs of green mosses. On
rare occasions one finds reindeer moss, juniper bushes, wild
rosemary and bog bilberry. Among the turfs one often meets
... 38
-at tlmcs occupy considerable areos. Along the slopes of the
surrounding hills, at times comprising wide belts rising to an ultitude of about 500 m. tbere are birch groves with
con-tinuous lichen cover, and European blueberry. Frequently one
ericount.er-s pine-birch and frequently pine forests with e. heavy undergrowth of juniper or dwarf birch and at times both in the
same area. These forests frequently occupy large areas and
are found up to an altitude of 350 m.
Field work in the above area took place in JUly 1937,
i.e. in the period of the most vigorous growth. All the tree
and bush vegetation was cover-ed with fully developed leaves or
needles on yoang shoots. Mosses and lichens had bright green
or reddish brown young shoots. The gra.ss-covered areas
con-sisted of young juicy stems and leaves having a bright green
colour. The heather was covered with continuous almost opened
buds of yellowish-red flowers. On all sides there were bright
rosy spots of flowering willow herb (Epilobium), which formed
a sharp contrast with the general green backgroundo The marshes
in most cases were bright green in colour.
Of the natural formations found in the tundra the following were studied:
1. Dwarf birch
2. Juniper
3. Birch groves on mountain slopes
4. Heather
- 39
-6. Turf hillocks coverod with grass
7. Turf hillocl{s, bore
8. European blueberry 9. Lichens 10. Moss, hypnum 11. Moss, sphagnum 12. Moss on crags 13. Moss on turf 14. Reindeer moss
15. Crags, bare, composed of outcrops of khibinite
16. Talus on mountain slopes
17. Surface of bare turf
18. Swampy podsol
In addition to the formations listed, the following were also studied:
19. Oats (bright green before the formation of spikes)
20. Roads, paved, cobblestone
21. Red tile.
Northern Forest Belt
Natural formations characteristic of the northern forest belt were, for the most part, studied in the territory and the surrounding area of the Lisinskii lespromkhoz (timber cutting
collective) located 60 km. south of Leningrad. The region of
field work, in ceneral, is covered by forests and abundant mdSt and dry meadows, and in the areas surrounding occasional inha-bited areas there are cultivated fields.
10
-Srnoo ヲッイョセエゥッョb and man-mado objects were also ntudied in
the pru-k of the PuLkovo AstronomIcal Observatory, 12 miles south
of LeninGrad and in the region of Slutsko, LenIngrad Province. The natural formations studied in this area are character-istic not only of the northern forest belt but a large number of them are widely distributed throughout the European portion
of tho U.S.S.R. and Siberia. Therefore, in this area 0. full and
systematic study was made of a large number of natural formations
extending over a number of years. In particular, studies were
made of forests of various types and ages and in their various
stages of 、・カ・ャッーュセョエN For this purpose areas were selected
within the territory of the lespromkhoz which met the above
re-quirements. In each of the points listed a 、・エ。ゥャセ、 study was
made of the dependenoe of spectral reflectance on direotion of some types of meadows, field crops and ploughed fields and also the ウーセ」エイ。ャ reflectance was studied from an aircraft.
Below a brief description of' the na tural formations is given. Fir, Y,O"ung forest, was studied in the "new" and "full leaf"
phases in the visible and infraned regions of the spectrum. In
the "young leaf" period the young shoots were 3-5 em. long and
were of a r-eddLah-cyeTl.ow colour at the time before the needles
had developed. In the following phase, i.e. "full leaf", the
needles on the young shoots were fully developed and had the
usual green shade from which the general background of the forest
took on a relatively greener colour. Mature forest was studied
- 41
-and "full leaf" phases -and in the infrared region in tho "young
leaf" phase. In tho "winter" phase the trees had their old
foliage (without snow). In the other phases the state of the
forest corresponded to that given for "young forest".
Pine, young forest was studied in the "winter", "young lenf", "full leaf" and "late summer-" phases in the visible region of the fpectrum and in the "young leaf" and "full leaf"
p ha s o s in the infrared region. In the "winter" phase the trees
had their old foliage (without snow). In the following phase
young shoots appeared on the trees up to 2-3 em. long in which the needles were beginning to show and had a bright green
(emerald) colour. In comparison to the "winter" phase the
general background was brighter and greener. In the next phase
the young trees were covered with new shoots with dense fully-developed needles, bright green in colour, and in the "late sur.uner" phase the young shoots were noticeably darker and were almost the same colour and luminescence as the old foliage. Mature forest was studied in the "winter", "young leaf", "full leaf", and "late summer" phases in the visible region of the spectrum and in the first two phases in the infrared region. The vegetative development of the mature forests did not vary from the young forest.
Birch, young forest was studied in the "winter", "young leaf", and "late summer" phases in the visible region of the spectrum and in the "lateswmner" phase in the infrared region.