HAL Id: hal-03166309
https://hal.archives-ouvertes.fr/hal-03166309
Submitted on 11 Mar 2021
HAL is a multi-disciplinary open access
archive for the deposit and dissemination of
sci-entific research documents, whether they are
pub-lished or not. The documents may come from
teaching and research institutions in France or
abroad, or from public or private research centers.
L’archive ouverte pluridisciplinaire HAL, est
destinée au dépôt et à la diffusion de documents
scientifiques de niveau recherche, publiés ou non,
émanant des établissements d’enseignement et de
recherche français ou étrangers, des laboratoires
publics ou privés.
A rotational and vibrational investigation of
phenylpropiolonitrile (C6H5C3N)
Zachary Buchanan, Kin Long Kelvin Lee, Olivia Chitarra, Michael Mccarthy,
Olivier Pirali, Marie-Aline Martin-Drumel
To cite this version:
Zachary Buchanan, Kin Long Kelvin Lee, Olivia Chitarra, Michael Mccarthy, Olivier Pirali, et al..
A rotational and vibrational investigation of phenylpropiolonitrile (C6H5C3N). Journal of Molecular
Spectroscopy, Elsevier, 2021, pp.111425. �10.1016/j.jms.2021.111425�. �hal-03166309�
A rotational and vibrational investigation of phenylpropiolonitrile
(C
6H
5C
3N)
Zachary Buchanana,b,∗, Kin Long Kelvin Leec, Olivia Chitarraa, Michael C. McCarthyc, Olivier Piralia,d, Marie-Aline Martin-Drumela
aUniversit´e Paris-Saclay, CNRS, Institut des Sciences Mol´eculaires d’Orsay, 91405 Orsay, France bDepartment of Chemistry, The University of California Davis, Davis, CA, USA
cCenter for Astrophysics | Harvard & Smithsonian, Cambridge, Massachusetts 02138, United States dSOLEIL Synchrotron, AILES beamline, l’Orme des Merisiers, Saint-Aubin, 91190 Gif-sur-Yvette, France
Abstract
The evidence for benzonitrile (C6H5CN) in the starless cloud core TMC–1 makes high-resolution studies of other aromatic nitriles and their ring-chain derivatives especially timely. One such species is phenylpro-piolonitrile (3-phenyl-2-propynenitrile, C6H5C3N), whose spectroscopic characterization is reported here for the first time. The low resolution (0.5 cm−1) vibrational spectrum of C6H5C3N has been recorded at far- and mid-infrared wavelengths (50–3500 cm−1) using a Fourier Transform interferometer, allowing for the assign-ment of band centers of 14 fundaassign-mental vibrational bands. The pure rotational spectrum of the species has been investigated using a chirped-pulse Fourier transform microwave (FTMW) spectrometer (6–18 GHz), a cavity enhanced FTMW instrument (6–20 GHz), and a millimeter-wave one (75–100 GHz, 140–214 GHz). Through the assignment of more than 6200 lines, accurate ground state spectroscopic constants (rotational, centrifugal distortion up to octics, and nuclear quadrupole hyperfine constants) have been derived from our measurements, with a plausible prediction of the weaker bands through calculations. Interstellar searches for this highly polar species can now be undertaken with confidence since the astronomically most interesting radio lines have either been measured or can be calculated to very high accuracy below 300 GHz.
Keywords: pure rotation, vibration, astrophysical species, PAH derivative, phenylpropiolonitrile
1. Introduction
The ubiquity of aromatic molecules is closely-correlated to their stability and lack of reactivity, with functionalized aromatics serving as a common motif in biological chemistry. Polycyclic aromatic hydrocarbons are a prominent class of aromatics; they are well-known constituents in the outflows of certain evolved carbon stars and common byprod-ucts in incomplete combustion processes [1, 2, 3]. From a purely spectroscopic viewpoint, a number of simple derivatives of benzene —the prototypical aromatic ring C6H6— have either not been charac-terized at all or at insufficient resolution to under-take an astronomical search in the coldest most qui-escent molecular clouds in space. The recent discov-ery of benzonitrile —the simplest aromatic nitrile
∗zsbuchanan@ucdavis.edu
(C6H5CN or PhCN hereafter)— using radio obser-vations towards Taurus Molecular Cloud (TMC-1) [4] has reignited the interest in nitrogen-containing aromatics generally and CN-functionalized aromat-ics specifically [5]. The subsequent identification of cyanocyclopentadiene, C5H5CN, in the same
cloud [6] has only intensified this interest. Ni-triles are also known to be important constituents in the chemistry of Titan’s atmosphere [7], and they are very prominent in the interstellar medium (ISM), accounting for roughly 20% of the 220 or so molecules (47) detected in the ISM to date, includ-ing cyanopolyynes as long as HC11N [8].
The presence of a nitrile group often imparts a molecule with a large permanent dipole moment and an intense rotational spectrum. In the case of PhCN, replacing a single H atom in benzene with a CN group transforms an otherwise highly symmet-ric ring into a highly polar species (µa = 4.5 D;
[9]) thereby greatly aiding its detection both in the laboratory and in space. Whilst the rotational spectrum of PhCN has been known for more than half-a-century [10], its interstellar detection was greatly aided by measurements at very high accu-racy (i.e., at a resolving power f /∆f > 106) at
cen-timeter wavelengths [4,9]. In light of this finding, new —or in many cases improved— high-resolution studies of molecules closely related in structure and composition are worth pursuing.
In this work, we report a combined pure ro-tational and vibrational investigation of a deriva-tive of PhCN, phenylpropiolonitrile (3-phenyl-2-propynenitrile, C6H5C3N, abbreviated as PhC3N in the following) where the nitrile group is replaced by a longer chain variant (C3N) (Fig. 1). This species has previously been identified as a possible prod-uct from the reaction between the cyano radical and phenylacetylene (C6H5CCH) [11]. To the best of our knowledge, however, spectroscopic investiga-tions have been limited to experimental and the-oretical vibronic spectroscopy [12, 13] while high-resolution, rotationally-resolved studies are appar-ently lacking. In light of the large permanent elec-tric dipole moment calculated here (5.9 D), labora-tory measurement of rotational frequencies would allow astronomical searches for this ring-chain to be undertaken with little or no ambiguity. If found in space, the abundance of PhC3N would provide a key test for models of aromatic chemistry which are poorly constrained at present. The infrared spec-trum of PhC3N is also of interest as a point of com-parison with other benzene derivatives whose vi-brational spectra are often plagued by a myriad of perturbations and resonances, notably Fermi and Darling-Dennison in the C−H and C−−−C stretching regions [14,15,16], in addition to Fermi and Cori-olis interactions for low frequency (∼150 cm−1), large amplitude modes that are prominent at room temperature [17,18, 19]—even under astronomical conditions.
2. Experimental and computational meth-ods
2.1. Quantum chemical calculations
Calculations were performed using the Gaus-sian’16 suite of electronic structure programs [20]. The goal of these calculations was to provide accu-rate estimates of spectroscopic parameters, includ-ing rotational constants, dipole moment, rotation-vibration corrections, and fundamental rotation-vibrational
Figure 1: Molecular structure of PhC3N; a and b principal
inertial axes are indicated (in red and green, respectively); the c-axis extends out of the molecular plane and is not shown.
frequencies using second-order vibrational pertur-bation theory (VPT2). Geometry optimizations of PhC3N and four of its isomers—namely the iso-cyanide analog PhCCNC and three variants where CN is substituted for a H atom on the ring of phenyl acetylene to yield ortho-, meta-, and para-cyanoethynylbenzene (CEB)—were carried out at the ωB97X-D/cc-pVQZ level on an ultrafine in-tegration grid, in which optimized structures are those in which convergence to better than 10−5 of the root-mean-squared (RMS) value of the gradi-ent has been achieved. For PhC3N, we also per-formed (an)harmonic frequency analysis, obtaining both the harmonic and anharmonic vibrational fre-quencies and intensities at the same level of the-ory; with the latter, the rotation-vibration interac-tion constants α were computed. Cartesian coor-dinates of the optimized equilibrium structures can be found in Tables S1-S5 in the Supporting Infor-mation.
In addition to spectroscopic parameters, we have also performed rudimentary thermochemical calcu-lations on the relative energies of PhC3N and its iso-mers using the G3//B3LYP composite method [21], which has been shown to provide near-chemical ac-curacy at excellent computational cost [22]. Given that semi-empirical methods typically perform best on closed-shell molecules with relatively simpler electronic structure, as the ones studied here, we believe these calculations provide a quantitative determination of relative stabilities, accurate to ±4 kJ/mol.
2.2. Fourier-transform infrared measurements The gas-phase vibrational spectrum of PhC3N was recorded in the far-infrared (far-IR) and mid-infrared (mid-IR) using the Bruker IFS 125 FT in-terferometer located at the AILES beamline of the
SOLEIL synchrotron facility (no synchrotron radia-tion was used in the present study) [23]. For the far-IR measurements, the spectrometer was equipped with a 6µm mylar-silicon composite beamsplitter and a liquid helium-cooled silicon bolometer. A KBr beamsplitter and a sensitive HgCdTe detec-tor, equipped with a cryogenically cooled entrance iris and optical filters [24], were used in the mid-IR region. Vapor of PhC3N was injected in a White-type multipass cell aligned to yield a 150 m opti-cal path length [25] and isolated from the interfer-ometer by 50µm-thick polypropylene windows in the far-IR and wedged ZnSe windows in the mid-IR range. In both spectral regions, the interfer-ometer was continuously evacuated to 10−5mbar to minimize absorption from residual water. Spec-tra were recorded at a resolution of 0.5 cm−1 us-ing a globar light source and an entrance iris of 4 mm, and consist of 100 and 500 co-added inter-ferograms for the far-IR and mid-IR regions, re-spectively. Both spectra were recorded at a sample pressure of 5µbar. It is worth noting that the rota-tional structure within the vibrarota-tional bands could not be resolved even at the highest resolution of the spectrometer (0.001 cm−1).
2.3. Chirped-pulse Fourier-transform microwave measurements
Microwave measurements were performed using a chirped-pulse Fourier transform microwave (CP-FTMW) spectrometer located at the Center for Astrophysics [26] which operates between 8 and 18 GHz. About 0.3 g of solid PhC3N was intro-duced into a reservoir located behind the pulsed nozzle and Ne carrier gas (at a flow of ∼20 sccm at standard temperature and pressure) passed through the reservoir; the resulting gas mixture was then in-jected into the vacuum chamber by operating the pulsed valve at a very low repetition rate (5 Hz). Because the vapor pressure of PhC3N is relatively
high at room temperature (several mbar), it was not necessary to heat the reservoir to observe rota-tional lines in the CP-FTMW spectrum with good signal-to-noise ratios.
Approximately 17,000 nozzle pulses, each probed by 10 microwave chirps, were acquired. Additional details on the experimental set-up are provided in Ref. [26]. The resulting spectrum, with electronics artifacts and well-known contaminant lines (e.g., acetone) removed, is displayed in Fig. 2. Transi-tions with 5 ≤ J00≤ 15 and K00
a ≤ 4 are visible.
Figure 2: Experimental CP-FTMW spectrum (in black) of PhC3N in comparison with a simulation at Trot = 1 K (in
purple) using the calculated set of rotational constants; the simulation is plotted here with negative intensity to more easily compare the two spectra. Left panel: the full spec-trum, noting that a few lines originating from impurities are visible around 10 GHz; Right panel: expanded view around theqR(7) transitions, as indicated by the gray rectangle on
the left panel. The simulation was performed using PGO-PHER [27].
2.4. Cavity-based Fourier-transform microwave measurements
In parallel to the present investigation, pure rotational transitions of PhC3N were also iden-tified by several of the co-authors of this paper while analyzing the discharge products of a ben-zene/nitrogen (N2) mixture [28] . Using a cavity-enhanced FTMW (CE-FTMW) spectrometer oper-ating between 6 and 40 GHz, transitions of PhC3N were measured at roughly ten times higher spec-tral resolution than can be achieved with the CP-FTMW instrument. In the following, we only briefly summarize the experimental conditions rel-evant to this work; further details about the CE-FTMW instrument and the discharge mixture ex-periments are presented in Refs. [26] and [28], re-spectively.
PhC3N was synthesized by subjecting a
mix-ture of C6H6 and N2 diluted heavily in Ne to a
high-voltage discharge (800 V); typical flow rates were 14, 12, and 20 sccm respectively. Compared to the CP-FTMW measurements where PhC3N was the precursor, the discharge experiment results in a slightly higher rotational temperature, i.e., ∼ 10 K and produces rotational lines with demon-stratively lower signal-to-noise ratio. Nevertheless, at the highest resolving power (∼ 107) the
nitro-gen nuclear-quadrupole structure for several low-Katransitions (Ka00= 0 − 2) in the 6–20 GHz region
2.5. Absorption millimeter-wave measurements The room temperature spectrum of PhC3N was recorded at ISMO with an absorption spectrome-ter in which a frequency multiplication scheme is used to generate millimeter-wave radiation [29]. By combining the output of a radiofrequency synthe-sizer (Rohde & Schwarz) operating in the 2–20 GHz region with one of two amplifier / multiplier chains, it is possible to produce broadly tunable radia-tion with modest power (of a few mW) through-out the millimeter band; a Radiometer Physics GmbH (RPG) SMZ110 for 75–97 GHz, and a Vir-ginia Diodes Inc. (VDI) for 141–214 GHz.
The millimeter-wave radiation was collimated us-ing a 10 mm focal length Teflon lens into a 2 m long Pyrex absorption cell and further focused onto a Schottky diode detector from VDI, using a sec-ond identical lens. The input radiation was fre-quency modulated at a frefre-quency of 48.2 kHz and a commercial lock-in amplifier (Ametek) demodu-lated the signal at the second harmonic. The spec-trum was recorded using 50 kHz frequency steps, a time constant of 50/100 ms, and an FM devi-ation of 200/250 kHz (where the two values refer the lower/higher frequency measurements, respec-tively).
A flow of PhC3N, not exceeding a pressure of 2µbar, was pumped through the cell and evacu-ated by a turbomolecular pump. Above this pres-sure, significant pressure broadening of the rota-tional lines was observed.
3. Results and discussion 3.1. Spectroscopic considerations
PhC3N belongs to the C2v symmetry group and
possesses a ˜X1A1 electronic ground state with 39
modes of vibration following the irreducible repre-sentation Γ = 14 A1⊕3 A2⊕9 B1⊕13 B2. All
vibra-tional modes except those of A2 symmetry are IR
active; A1and B2modes correspond to in-plane
vi-brations (respectively a- and b-type bands) while B1
modes are out-of-plane vibrations (c-type bands). PhC3N is a prolate asymmetric top molecule with a permanent dipole moment of 5.9 Debye along the a axis (axis of the C3N bonds, Fig. 1), according to our calculations. PhC3N also has nitrogen nuclear quadrupole hyperfine structure, but this splitting is only partially resolved at low frequency in the CE-FTMW measurements. Given that the molecule is C2v symmetry, we also include statistical weights
for equivalent exchangeable nuclei for correct tran-sition intensities. Identical to PhCN, there are two sets of equivalent hydrogen atoms (I1 = I2 = 12)
that give rise to Fermi-Dirac statistics for symmet-ric (even K) and antisymmetsymmet-ric (odd K) rotational states with a ratio of 10 : 6 [4].
3.2. Vibrational spectroscopy
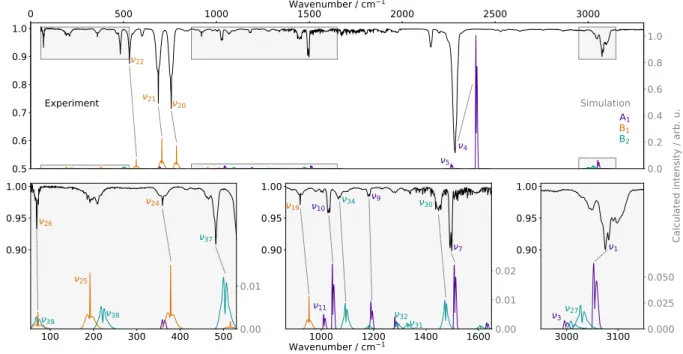
The infrared spectrum of PhC3N is presented in Fig.3together with a simulation of the vibrational fundamentals predicted by our anharmonic quan-tum chemical calculations. At our experimental resolution, the rotational contour of most bands is evident in the spectrum. Because the simulation is in very good agreement with the experiment, nu-merous assignments can be made with confidence. For ambiguous assignments, two criteria can be in-voked: (i) c-type bands (B1 symmetry) exhibit a
sharp Q-branch; and (ii) a-type bands (A1) are
usu-ally narrower than the others (as can be seen on the simulated spectrum). Out of the 36 active infrared modes of PhC3N, 14 can be assigned with little or no ambiguity while 9 other bands have tentative as-signments at this juncture; the remaining bands are either weak or are predicted in crowded regions of the spectrum (see Table 1for a detailed list of the proposed assignments). Experimental band centers are taken as the frequency of the Q-branch when one exists (c-type bands), equidistant between the P - and R-branches, or at the maximum of the enve-lope when no clear contour is visible. Considering c-type Q-branches are several wavenumbers wide, an accuracy of ±2 cm−1 can be expected for the band centers with B1 symmetry. For the others, a
conservative value of ±5 cm−1 is proposed.
A few of the assignments proposed in Fig. 3and Table 1 warrant further discussion. While the as-signment of the ν26 band (out-of-plane backbone
motion) is relatively secure thanks to the presence of a sharp Q-branch, the band appears stronger than expected from our calculations. A possible explanation is that ν39 (C−−−C−C−−−N rocking),
pre-dicted roughly at the same frequency as ν26,
con-tributes to the experimental band profile, thus en-hancing absorption. In absence of any specific fea-ture arising from ν39 on the experimental
spec-trum, we have chosen to assign this band to the same band center as ν26, at 69 cm−1. Slightly
higher in frequency are ν25 and ν38, which
in-volve similar nuclear motion as ν26 and ν39 and
are also predicted to lie close in energy (at 192 and 221 cm−1, respectively), which in combination
Table 1: Fundamental vibrational bands (position and intensity) of PhC3N from the quantum chemical calculations performed in this work at the harmonic and anharmonic levels of theory, and proposition of assignments. Modes are numbered following the anharmonic calculations frequency order. Modes energy are in wavenumbers, intensities are in km/mol, δ values are in %. The experimental assignments are split in two categories, the relatively secure ones (column “Assign.”) and the tentative ones (column “Prop.”); δ values of the latter are reported in italics.
Mode Harm. Calc. Anharm. Calc. Exp.
ν Sym. Energy Int. Energy Int. Assign. Prop. δa 1 A1 3214 6.7 3055 13.5 3078 0.8 2 A1 3226 5.6 3026 0.0 3047 0.7 3 A1 3197 0.0 2999 1.7 3047 1.6 4 A1 2431 242.3 2399 220.1 2284 -4.8 5 A1 2292 10.7 2265 7.5 2154/2198 -4.9/-3.0 6 A1 1675 1.0 1633 0.5 7 A1 1545 7.7 1510 4.9 1495 -1.0 8 A1 1306 1.6 1284 0.8 9 A1 1214 2.1 1193 2.0 1182 -0.9 10 A1 1064 4.6 1045 4.5 1029 -1.5 11 A1 1027 1.3 1012 1.0 1004/981 -0.8/-3.1 12 A1 981 0.1 960 0.0 13 A1 706 3.4 693 3.5 14 A1 371 0.8 362 0.5 15 A2 1019 0.0 1000 0.0 16 A2 876 0.0 862 0.0 17 A2 413 0.0 412 0.0 18 B1 1042 0.0 1023 0.0 19 B1 967 2.8 953 2.4 920 -3.5 20 B1 792 38.7 784 32.7 757 -3.4 21 B1 716 36.7 706 42.7 687 -2.6 22 B1 576 13.2 568 12.4 532 -6.3 23 B1 523 0.2 515 0.3 24 B1 384 2.8 377 2.8 359 -4.9 25 B1 195 2.6 192 2.5 185 -3.4 26 B1 74 0.6 71 0.7 69 -3.3 27 B2 3206 1.9 3030 9.5 3095 2.1 28 B2 3222 8.4 3012 2.6 29 B2 1646 0.7 1608 0.5 30 B2 1493 8.6 1475 4.5 1448 -1.8 31 B2 1364 1.2 1331 0.9 1336 0.4 32 B2 1320 1.3 1292 1.0 1280 -0.9 33 B2 1193 0.4 1183 0.5 34 B2 1117 4.4 1094 3.8 1069 -2.3 35 B2 644 0.0 635 0.0 36 B2 584 0.5 574 0.4 37 B2 511 5.3 504 5.6 482 -4.3 38 B2 226 2.3 221 2.4 209 -5.6 39 B2 71 1.1 71 1.2 69 -2.7 aδ = (Exp. − Anharm.Calc.)/Anharm.Calc. × 100
0 500 1000 Wavenumber / cm1500 1 2000 2500 3000 0.5 0.6 0.7 0.8 0.9 1.0 0.0 0.2 0.4 0.6 0.8 1.0 4 5 20 21 22 0.90 0.95 1.00 37 24 26 100 200 300 400 500 0.00 0.01 38 25 39 0.90 0.95 1.00 19 10 9 7 34 30 1000 1200 1400 16000.00 0.01 0.02 11 32 31 3000 3100 0.90 0.95 1.00 1 3000 3100 0.000 0.025 0.050 27 3 Wavenumber / cm1
Calculated intensity / arb. u.
Transmittance
Experiment Simulation
A1
B1
B2
Figure 3: Experimental (top traces, in black) and simulated (bottom traces, at 300 K, where different colors correspond to different symmetries) vibrational spectrum of PhC3N. The three bottom panels are expanded portions of the full spectrum, as indicated by gray rectangles. Simulation performed using the PGOPHER software [27] and the results of the anharmonic calculations (band centers, intensities, and rotational constants) and normalized to the strongest IR active mode (ν4). The
simulations are inverted relative to the observed spectrum solely for comparison purposes. Secure band assignments are indicated by dash lines; additional labelled bands are those for which an assignment is proposed; simulated bands without any labels remain unassigned.
likely yield the feature observed around 200 cm−1. It is not straightforward, however, to unambigu-ously assign each band center, in part because ν25
is the only band of B1 symmetry with a sizeable
transition moment that does not exhibit a sharp Q-branch. Tentative assignments are proposed in Table 1, but their accuracy should be taken with caution as the actual bands centers could lie in a 10 to 20 cm−1 window from the proposed assign-ments. Concerning ν11 (ring symmetric breathing)
and ν5 (C−−−C−C−−−N stretch)—predicted at 1012
and 2265 cm−1, respectively—two bands lie
system-atically close to the expected energy, with reason-able band profiles, thus in each case both assign-ments are reported in Table 1. In the case of ν5,
the lowest frequency assignment, i.e., 2154 cm−1 appears most likely as the relatively strong intensity of the observed band would indicate a fundamen-tal that could otherwise not be predicted. How-ever the shape of the band lying at 2198 cm−1 is closer to that expected for an a-type band, assum-ing that our aforementioned criterion remains valid at these frequencies (i.e. hot bands and
combina-tion bands could significantly affect the simplistic fundamentals-only picture).
The most difficult analysis lies in the ∼3000 − 3200 cm−1 region, where C−H stretching motions are observed. From previous studies on similar molecules like phenylacetylene [14] and naphthalene [16], it is well-known that this frequency range is plagued by anharmonic resonances which can signif-icantly complicate assignment. For PhC3N, three modes of A1 (ν1, ν2, ν3) and two of B2 (ν27, ν28)
symmetries (Table 1) very close in energy (of or-der of ∼10 cm−1 for the harmonic frequencies) and can mix strongly, thus qualitatively shifting the fun-damental energies and altering band intensities. In such cases, an approximate deperturbation analysis was performed using the generalized VPT2 calcula-tions to identify and treat anharmonic resonances, e.g. those arising from Fermi (so-called “1–2” res-onances) and Darling-Dennison (“1–1” interactions in the present case). These resonances are identified based on small differences in the energies of states and a model variational calculation [30]; the former is a zeroth order estimate for resonances, while the
latter tests for the magnitude of the coupling [31]. The VPT2 routines in Gaussian treat the prob-lem of state-to-state coupling as effective 2 × 2 Hamiltonians, where the diagonal elements corre-spond to the state energies, and the off-diagonal el-ements represent coupling between the two states. These values are shown in Table 2, and give rise to significant deviation from the harmonic frequen-cies and intensities shown in Table1. Of particular note is the unintuitive complete loss of intensity in ν2: ν3 is “dark” in the harmonic approximation,
and it gains intensity primarily through borrowing intensity from the stronger ν1 and ν2 bands. In
a general resonance picture, this interaction shares intensity, and to render a mode completely inac-tive is extremely rare if not unheard of. Given the VPT2 treatment here is only approximate, our ef-fective deperturbation analysis is likely inadequate to properly treat these bands, and a fully coupled model involving fundamentals, combination bands, and overtones, is required instead.
In light of this preliminary analysis, however, as well as the fact that the ∼3000 cm−1region is heav-ily congested, we assume all three A1modes are IR
active. Measurement under cold conditions—either in a supersonic jet or buffer gas cell—will help fu-ture analysis of this molecule by eliminating the possibility of combination bands and overtones, in addition to minimizing lineshape blending from ro-tational contours. Similarly, selective deuteration might clarify the assignment of some features [14].
Table 2: Strong anharmonic resonances and their corre-sponding off-diagonal matrix elements for bands in the ∼3100 − 3200 cm−1 region. Darling-Dennison (DDR) and
Fermi (FR) resonances are indicated; in this table, the for-mer corresponds to 1 − 1 type DDR, referring to the number of quanta for states involved.
State 1 State 2 Type Coupling v1= 1 v3= 1 DD -6.6 v2= 1 v3= 1 DD 14.5 v3= 1 v6= 1 + v7= 1 FR -23.2 v3= 1 v29= 1 + v30= 1 FR -29.3 v27= 1 v28= 1 DD 9.4 3.3. Rotational spectroscopy
Using the ground state rotational and quartic centrifugal distortion constants from the anhar-monic calculation, 65 strong lines of the CP-FTMW spectrum were assigned in a straightforward fashion
using the PGOPHER software [27] (Fig.2). The de-rived values are extremely close to those predicted by the calculation (the weighted frequency differ-ence δ is less than 1 % for the rotational constants, see Table 3). This initial set of constants was then used to assign the millimeter-wave data. Loomis-Wood diagrams were produced by means of the LWWa software from Lodyga et al. [32] to aid in the assignment of the high-J transitions. In total, 6151 a-type transitions (3780 different frequencies as a result of unresolved asymmetric splitting) of PhC3N in its ground vibrational state were assigned in the millimeter-wave spectrum, with values of J00
up to 199 and Ka00 up to 42.
The SPFIT/SPCAT suite of programs [33] us-ing the Watson S-reduced Hamiltonian in the Ir
representation was used to determine best-fit spec-troscopic constants. All transitions were weighted accorded to their expected experimental accuracy, i.e., 2 kHz and 25 kHz for the CE-FTMW and CP-FTMW transitions, respectively, and 50 kHz for the millimeter-wave transitions. To reproduce the data to their experimental accuracy, inclusion of several sextic and octic centrifugal distortion constants was required. Finally, the CE-FTMW transitions—the only ones for which the nuclear quadrupole split-ting was resolved—were added to the fit to deter-mine the χ(N) terms. All 57 hyperfine components were reproduced to the measurement uncertainty by adjusting only χaa(N) and χbb(N). Both
param-eters are close to those expected from calculation (to within about 15 %, Table3). When a transition was observed by both CP-FTMW and CE-FTMW spectroscopy, only the latter was retained in the fit, owing to the higher frequency accuracy of the cavity instrument. The rotational constants derived from a fit to all of the assigned rotational transitions are reported in Table 3. The final 49 kHz RMS value of the fit, corresponding to a reduced standard de-viation σ = 1.00, indicates that our present model adequately reproduces the ground state rotational spectrum of PhC3N.
Figure 4 shows a portion of the millimeter-wave spectrum in comparison with a simulation of PhC3N in its vibrational ground state using the ex-perimentally determined best-fit parameters from Table 3. As illustrated in this figure, many lines remain unassigned, but most of these likely arise from vibrational satellites, for which no attempt at assigning was made in the present study. Al-though longer integration times would allow a more in-depth analysis of these satellites, the spectrum
163500 164000 164500 165000 165500 166000 166500
164900 164925 164950 164975 165000 165025 165050 165075 165100 Frequency / MHz
Experiment
Simulation, T = 300 K
Figure 4: Portions of the millimeter-wave spectrum of PhC3N in comparison with a simulation of the pure rotational transitions
in the ground vibrational state using the best-fit set of spectroscopic constants (Table3). The simulation has been performed using the PGOPHER software and the resulting trace was then post-processed with a second derivative to allow a more straightforward comparison with the experimental spectrum. The line density in the experimental trace is far greater than our simulation, very likely because of lines from vibrational satellites.
is already fairly dense, implying that we may be close to the confusion limit. Indeed, the 2µbar pres-sure used in this study, although quite low, was ac-tually a compromise between reasonable signal-to-noise ratio and pressure broadening. Even at this pressure many lines are broader then expected from the effects of pressure broadening alone, and conse-quently may in fact be a spectral superposition of several transitions.
Regarding hyperfine splitting, its magnitude rapidly collapses with increasing J , as expected from this type of interaction. No splitting is observed in the CP-FTMW nor in millimeter-wave measurements, and in the cavity experi-ments it is marginally resolved above J00 ≈ 11
(∼12 GHz). Even at the lowest-J transitions mea-sured here (J00 = 5, ∼6 GHz), the splitting due to hyperfine and Doppler effects are comparable (Fig. 5). The experimentally derived value of χaa(N) [−4.219 (77) MHz; Table 3] is very similar
to that reported for PhCN [-4.23738(36) MHz [9]], and the relative magnitudes are in agreement with the theoretical values of χaa(N) calculated at the
ωB97X-D/cc-pVQZ level of theory for PhC3N (-4.959 MHz) and PhCN (-4.962 MHz). The small
changes in χ(N) are an indication that the local electronic structure of the nitrogen atom is rel-atively insensitive to the distance from the aro-matic ring. Equivalently, this finding implies that electron delocalization through ring conjugation is very poorly coupled to the chain regardless of length. Similar behavior is seen for cyanopolyyne chains, where the value of eQq equivalent to χaa(N)
(around −4.1 MHz) is relatively invariant with the length of the chain as well [34].
3.4. Astronomical considerations
Detection of molecules in space by radio astron-omy is heavily dependent on the magnitude of their permanent dipole moment. In comparison with PhCN, our theoretical predictions suggest PhC3N is substantially more polar (5.9 D vs. of 4.5 D, where the former value has statistical uncertainty of ±0.25 D based on our prior benchmarking at the ωB97X-D/cc-pVQZ level of theory [35]). Currently, PhCN is theorized to form in cold, dark clouds via a barrierless reaction between C6H6 and CN rad-ical [4, 36]. We thus speculate that PhC3N could be formed via C2 insertion to PhCN or through an analogous C−−−N addition reaction between CN
Table 3: Spectroscopic constants (rotational, centrifugal dis-torsion, and nuclear quadrupole constants) of PhC3N in its vibrational ground state (in MHz) and relevant fit parame-ters. Numbers in parenthesis are 1σ uncertainties expressed in the unit of the last digit. Parameters in brackets were kept fixed to the calculated values.
Constant Calc.a Exp. δb
A0 5656.9 5659.722 (15) 0.05 B0 567.0 569.582206 (39) 0.46 C0 515.4 517.404488 (37) 0.39 DJ× 106 3.6 3.85110 (77) 7.0 DJ K× 103 0.78 0.827177 (85) 6.1 DK× 103 0.42 0.400 (68) -4.8 d1× 106 −0.50 −0.55191 (24) 10 d2× 106 −0.52 −0.57101 (79) 9.8 HJ× 1012 −0.957 (11) HJ K× 109 0.7916 (18) HKJ× 106 −0.03051 (10) h2× 1012 0.575 (15) h3× 1012 0.10329 (55) LJ J K× 1015 −1.295 (20) LJ K× 1012 0.06954 (86) LKKJ× 1012 −3.512 (36) χaa −4.96 −4.219 (77) -15 χbb 2.39 2.114 (68) -12 χcc 2.57 2.143c -17 Nd 6256/3877/57 Jmax00 , K 00 a max 199, 42 rms /kHz 0.049 σe 1.00
aωB97XD/cc-pVQZ level of theory, Bayesian corrected for A, B, and C, and anharmonic values for the centrifugal distortion constants, and equilibrium values for the hyperfine constants bδ = (B
exp.− Bcalc.)/Bcalc.× 100 (in %)
cDerived value
dTotal number of lines in the fit / Number of different frequen-cies / Number of lines with resolved nuclear quadrupole struc-ture
eReduced standard deviation, unitless
radical and phenylacetylene (PhC2H), or C3N and
C6H6. If the latter mode is operative, then the
abundance ratio of PhCN/PhC3N will be depen-dent on CN/C3N, assuming similar reaction cross-sections. The CN + PhC2H process has been stud-ied in crossed-beam experiments by Bennett et al. [11], where the authors identify PhC3N as a po-tential reaction product, albeit not definitively so due to the lack of isomer specificity and at collision energies well in excess of interstellar cloud condi-tions (∼30 kJ/mol). This finding suggests other iso-mers, namely ortho, meta, para-CEB, might plausi-bly be formed from this reaction. While we have not
0.0 0.5 1.0 0.0 0.5 1.0 Intensity / arb. u. 6507.7 6507.8 6507.9 6508.0 6508.1 6508.2 Frequency / MHz 0.0 0.5 1.0 Experiment Simulation with Doppler splitting Simulation
without Doppler splitting
JK00
aKc0 J00K00aK00c= 606 505
Figure 5: Example of a transition showing resolved hyperfine structure on the CE-FTMW spectrum, and comparison with 10 K simulations using the final set of spectroscopic parame-ters, with and without taking into account the Doppler split-ting (simulations performed using the PGOPHER software, assuming a Lorentzian lineshape). As before, the simulation with Doppler splitting is inverted relative to the observed spectrum solely for comparison purposes.
attempted to experimentally characterized these species, estimates of their spectroscopic parameters are provided here. By scaling the experimental pa-rameters for PhC3N (Table3) to correct for vibra-tional and electronic effects (Table S6 in the Sup-porting Information), in conjunction to Bayesian uncertainties obtained from benchmarking [35], re-liable constraints of these constants should aid fu-ture experimental searches for these species.
In terms of astronomical detection, although the hyperfine structure does not take a large part the present rotational analysis, this splitting is partially resolved with cavity measurements up to 16 GHz. In cold, dark clouds such as TMC-1 where the linewidths are comparable to those measured with our CE-FTMW spectrometer, it is thus necessary to consider hyperfine splitting, as recent work on PhCN [4] demonstrates. This is particularly true for a relatively heavy molecule like PhC3N whose
strongest lines should lie at centimeter-wavelengths at low temperatures (Fig.6): at 10 K, the strongest features correspond to J00 = 21 around 23 GHz,
while at 6 K —a typical temperature for molecules in TMC-1— the strongest features are near 15 GHz (J00 = 14). Thus, the X/Ku (8–12/12–18 GHz)
bands appear to be the most promising to de-tect PhC3N in TMC–1. In sources with some-what warmer temperatures, the intensity of indi-vidual transitions is significantly decreased due to the larger partition function, and the peak inten-sity, although relatively flat, falls in the W (75–110
GHz) and N (100–200 GHz) bands. 0 50 100 150 200 250 Frequency / GHz 10 K 100 K * 5 300 K * 10
Figure 6: Calculated rotational spectrum of PhC3N at 10 K
(purple), 100 K (blue), and 300 K (orange). For the pur-poses of display, these relative intensities for the 100 K plot have increased by a factor of 5, while for the 300 K plot, the increase is 10.
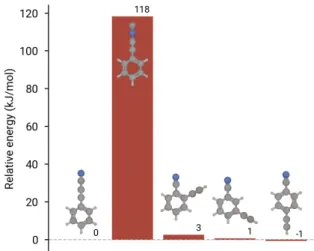
Detection of multiple isomers is also a powerful tool for constraining physical and chemical condi-tions in astrophysical environments. To assist in this process, we have calculated the relative en-ergy of the aforementioned ortho, meta, and para-CEB isomers, along with the isocyanide isomer, PhCCNC. As shown in Fig.7, apart from the iso-cyanide isomer, placement of the acetylenic unit on different parts of the ring produces isomers with comparable stability to PhC3N, i.e., they are effec-tively degenerate at the level of uncertainty afforded by G3//B3LYP (±4 kJ/mol). As such, a determi-nation of their relative abundances would provide a sensitive test of thermodynamics vs. kinetics in molecule formation. To aid further laboratory and hopefully astronomical efforts, Table S6, in addition to providing estimates of rotational constants, also reports calculated dipole moments at the ωB97X-D/cc-pVQZ level of theory using two methods of empirical scaling to correct for vibrational effects and deficiencies in the electronic structure method. We note that the Bayesian scaling factors obtained in Ref. [35] applied to PhC3N —where we now have accurately determined parameters— exceed the performance of the purely theoretical VPT2 corrections, and bring the theoretical predictions within a few MHz of the experimentally measured ones (see also Fig. S1). We expect a similar degree of precision and uncertainty for other isomers.
Figure 7: 0 K energetics of isomers of interest calculated at the G3//B3LYP level of theory, relative to PhC3N. Energies to the nearest kJ/mol are annotated above each bar.
4. Conclusion
Using a combination of gas-phase measurements and quantum chemical calculations, the fundamen-tal vibrational frequencies of most of the strongest IR-active fundamentals of PhC3N and over 6000 pure rotational transitions in its ground state be-tween 6.5 and 220 GHz have been measured. The assignment of spectra in different regions was guided by theoretical predictions: in the infrared, anharmonic calculations helped to assign most bands, with the exception of the most congested and perturbed region around 3000 cm−1; in the ra-dio domain, estimates of centrifugal distortion and hyperfine terms proved useful. Comparisons with PhCN suggest that the local electronic structure of the terminal nitrogen —as probed through its quadrupole moment χaa(N)— is relatively
unaf-fected by chain lengthening, indicating a similar electric field gradient for nitrogen in both PhCN and PhC3N. In addition, we provide accurate and reliable predictions of the thermochemistry and spectroscopic parameters for several isomers of PhC3N, which should prove useful in guiding fu-ture laboratory experiments. These isomers include the isocyanide isomer of PhC3N and the three cya-noethynylbenzenes alluded to in previous work [11]; their discovery along with PhC3N in the ISM would
provide sensitive measurements of local chemical and physical interstellar environments.
With highly precise measurements of the rest frequencies and corresponding spectroscopic
con-stants, a search for PhC3N can now be undertaken with considerable confidence in the ISM. The large permanent dipole moment (predicted to be 5.9 D), in addition to its chemical and structural similarity to astronomical PhCN makes PhC3N an excellent candidate for detection towards cold, dark molecu-lar clouds such as TMC-1. Hyperfine-resolved mea-surements are expected to be highly relevant in a potential discovery, given that at low temperatures the strongest transitions lie in the X/Ku bands
where the splitting is comparable to the source linewidth.
Acknowledgements
O.C., O.P., and M.-A.M.-D. acknowledge fund-ing support from the R´egion Ile-de-France through DIM-ACAV+, from the Agence Nationale de la
Recherche (ANR-19-CE30-0017-01), from the “In-vestissements d’Avenir ” LabEx PALM (ANR-10-LABX-0039-PALM), and from the Programme Na-tional “Physique et Chimie du Milieu Interstellaire” (PCMI) of CNRS/INSU with INC/INP co-funded by CEA and CNES. K.L.K.L. and M.C.M. acknowl-edge funding support from NSF grant AST-1908576 and NASA grant 80NSSC18K0396. Z.S.B. acknowl-edges support from the Chateaubriand Fellowship of the Office for Science & Technology of the Em-bassy of France in the United States. The authors are thankful to the AILES beamline staff for pro-viding access to the FTIR interferometer.
References
[1] M. Frenklach, E. D. Feigelson, Formation of polycyclic aromatic hydrocarbons in circumstellar envelopes, The Astrophysical Journal 341 (1989) 372.
[2] T. P. Snow, A. N. Witt, The Interstellar Carbon Budget and the Role of Carbon in Dust and Large Molecules, Science 270 (1995) 1455–1460.
[3] A. Tielens, Interstellar Polycyclic Aromatic Hydrocar-bon Molecules, Annual Review of Astronomy and As-trophysics 46 (2008) 289–337.
[4] B. A. McGuire, A. M. Burkhardt, S. Kalenskii, C. N. Shingledecker, A. J. Remijan, E. Herbst, M. C. Mc-Carthy, Detection of the aromatic molecule benzoni-trile (c-C6H5CN) in the interstellar medium, Science 359 (2018) 202–205.
[5] D. McNaughton, M. K. Jahn, M. J. Travers, D. Wachsmuth, P. D. Godfrey, J.-U. Grabow, Labora-tory rotational spectroscopy of cyano substituted poly-cyclic aromatic hydrocarbons, Monthly Notices of the Royal Astronomical Society 476 (2018) 5268–5273. [6] M. C. McCarthy, K. L. K. Lee, R. A. Loomis, A. M.
Burkhardt, C. N. Shingledecker, S. B. Charnley, M. A. Cordiner, E. Herbst, S. Kalenskii, E. R. Willis, C. Xue,
A. J. Remijan, B. A. McGuire, Interstellar detection of the highly polar five-membered ring cyanocyclopenta-diene, Nature Astronomy (2020). In press.
[7] T. Gautier, N. Carrasco, A. Buch, C. Szopa, E. Sciamma-O’Brien, G. Cernogora, Nitrile gas chem-istry in Titan atmosphere, Icarus 213 (2011) 625. [8] R. Loomis, et al., The third time’s a charm? a
rig-orous investigation of spectral line stacking techniques and application to the detection of HC11N, submitted
(2020).
[9] K. Wohlfart, M. Schnell, J.-U. Grabow, J. Kpper, Pre-cise dipole moment and quadrupole coupling constants of benzonitrile, Journal of Molecular Spectroscopy 247 (2008) 119–121.
[10] B. Bak, D. Christensen, W. B. Dixon, L. Hansen-Nygaard, J. RastrupAndersen, Benzene Ring Distor-tion by One Substituent. Microwave DeterminaDistor-tion of the Complete Structure of Benzonitrile, The Journal of Chemical Physics 37 (1962) 2027–2031. Publisher: American Institute of Physics.
[11] C. J. Bennett, S. B. Morales, S. D. L. Picard, A. Canosa, I. R. Sims, Y. H. Shih, A. H. H. Chang, X. Gu, F. Zhang, R. I. Kaiser, A chemical dynamics, kinet-ics, and theoretical study on the reaction of the cyano radical (CN; X2Σ+) with phenylacetylene (C
6H5CCH;
X1A
1), Phys. Chem. Chem. Phys. 12 (2010) 8737–8749.
[12] K. M. Jawad, T. S. Zwier, L. V. Slipchenko, C. I. Viquez Rojas, The exotic excited state behavior of 3-phenyl-2-propynenitrile, http://hdl.handle.net/2142/97063, 2017. Interna-tional Symposium on Molecular Spectroscopy. [13] C. I. Viquez Rojas, L. V. Slipchenko, T. S.
Zwier, K. M. Jawad, Computational modeling of electronic spectroscopy of 3-phenyl-2-propynenitrile, http://hdl.handle.net/2142/97102, 2017. International Symposium on Molecular Spectroscopy.
[14] G. King, S. So, Ethynylbenzene; The vibrational spec-tra of some deuterated isomers, Journal of Molecular Spectroscopy 36 (1970) 468–487. ZSCC: 0000063. [15] C.-H. Chang, G. Lopez, T. J. Sears, P. M. Johnson,
Vibronic Analysis of the S1 S0 Transition of
Pheny-lacetylene Using Photoelectron Imaging and Spectral Intensities Derived from Electronic Structure Calcula-tions, The Journal of Physical Chemistry A 114 (2010) 8262–8270. ZSCC: NoCitationData[s0].
[16] O. Pirali, M. Vervloet, G. Mulas, G. Malloci, C. Joblin, High-resolution infrared absorption spectroscopy of thermally excited naphthalene. Measurements and cal-culations of anharmonic parameters and vibrational in-teractions, Physical Chemistry Chemical Physics 11 (2009) 3443. ZSCC: 0000046.
[17] O. Pirali, Z. Kisiel, M. Goubet, S. Gruet, M. A. Martin-Drumel, A. Cuisset, F. Hindle, G. Mouret, Rotation-vibration interactions in the spectra of polycyclic aro-matic hydrocarbons: Quinoline as a test-case species, The Journal of Chemical Physics 142 (2015) 104310. Publisher: American Institute of Physics.
[18] Z. Kisiel, A. Kranicki, The millimetre-wave rotational spectrum of phenylacetylene, Journal of Molecular Spectroscopy 262 (2010) 82–88.
[19] M. A. Zdanovskaia, B. J. Esselman, H. S. Lau, D. M. Bates, R. C. Woods, R. J. McMahon, Z. Kisiel, The 103360 GHz rotational spectrum of benzonitrile, the first interstellar benzene derivative detected by radioas-tronomy, Journal of Molecular Spectroscopy 351 (2018)
39–48.
[20] M. J. Frisch, G. W. Trucks, H. B. Schlegel, G. E. Scuseria, M. A. Robb, J. R. Cheeseman, G. Scal-mani, V. Barone, G. A. Petersson, H. Nakatsuji, X. Li, M. Caricato, A. V. Marenich, J. Bloino, B. G. Janesko, R. Gomperts, B. Mennucci, H. P. Hratchian, J. V. Or-tiz, A. F. Izmaylov, J. L. Sonnenberg, D. Williams-Young, F. Ding, F. Lipparini, F. Egidi, J. Go-ings, B. Peng, A. Petrone, T. Henderson, D. Ranas-inghe, V. G. Zakrzewski, J. Gao, N. Rega, G. Zheng, W. Liang, M. Hada, M. Ehara, K. Toyota, R. Fukuda, J. Hasegawa, M. Ishida, T. Nakajima, Y. Honda, O. Ki-tao, H. Nakai, T. Vreven, K. Throssell, J. A. Mont-gomery, Jr., J. E. Peralta, F. Ogliaro, M. J. Bearpark, J. J. Heyd, E. N. Brothers, K. N. Kudin, V. N. Staroverov, T. A. Keith, R. Kobayashi, J. Normand, K. Raghavachari, A. P. Rendell, J. C. Burant, S. S. Iyengar, J. Tomasi, M. Cossi, J. M. Millam, M. Klene, C. Adamo, R. Cammi, J. W. Ochterski, R. L. Martin, K. Morokuma, O. Farkas, J. B. Foresman, D. J. Fox, Gaussian 16 Revision A.01, 2016.
[21] A. G. Baboul, L. A. Curtiss, P. C. Redfern, K. Raghavachari, Gaussian-3 theory using density func-tional geometries and zero-point energies, The Journal of Chemical Physics 110 (1999) 7650–7657.
[22] J. M. Simmie, K. P. Somers, Benchmarking Compound Methods (CBS-QB3, CBS-APNO, G3, G4, W1BD) against the Active Thermochemical Tables: A Lit-mus Test for Cost-Effective Molecular Formation En-thalpies, The Journal of Physical Chemistry A 119 (2015) 7235–7246.
[23] J.-B. Brubach, L. Manceron, M. Rouzi`eres, O. Pirali, D. Balcon, F. Kwabia-Tchana, V. Boudon, M. Tudorie, T. Huet, A. Cuisset, P. Roy, in: WIRMS 2009, volume 1214 of AIP Conference Proceedings, pp. 81–84. [24] M. Faye, M. Bordessoule, B. Kanout, J.-B. Brubach,
P. Roy, L. Manceron, Improved mid infrared detec-tor for high spectral or spatial resolution and syn-chrotron radiation use, Review of Scientific Instruments 87 (2016) 063119.
[25] O. Pirali, M. Goubet, T. R. Huet, R. Georges, P. Soulard, P. Asselin, J. Courbe, P. Roy, M. Vervloet, The far infrared spectrum of naphthalene character-ized by high resolution synchrotron FTIR spectroscopy and anharmonic DFT calculations, Physical Chemistry Chemical Physics 15 (2013) 10141–10150.
[26] K. N. Crabtree, M.-A. Martin-Drumel, G. G. Brown, S. A. Gaster, T. M. Hall, M. C. McCarthy, Microwave spectral taxonomy: A semi-automated combination of chirped-pulse and cavity fourier-transform microwave spectroscopy, The Journal of Chemical Physics 144 (2016) 124201.
[27] C. M. Western, PGOPHER: A Program for Simulat-ing Rotational, Vibrational and Electronic Spectra, J. Quant. Spectrosc. Radiat. Transfer 186 (2017) 221–242. [28] M. C. McCarthy, K. L. K. Lee, P. B. Carroll, J. P. Porterfield, B. Changala, J. H. Thorpe, J. F. Stanton, Exhaustive product analysis of three benzene discharges by microwave spectroscopy, J. Phys. Chem. A (2020). [29] O. Pirali, M. Goubet, V. Boudon, L. D’Accolti,
C. Fusco, C. Annese, Characterization of isolated 1-aza-adamantan-4-one (C9H13NO) from microwave, millimeter-wave and infrared spectroscopy supported by electronic structure calculations, J. Mol. Spectrosc. 338 (2017) 6 – 14.
[30] J. M. L. Martin, T. J. Lee, P. R. Taylor, J. Franois, The anharmonic force field of ethylene, C2h4 , by means of
accurate ab initio calculations, The Journal of Chem-ical Physics 103 (1995) 2589–2602. ZSCC: NoCitation-Data[s0].
[31] J. Bloino, M. Biczysko, V. Barone, Anharmonic Ef-fects on Vibrational Spectra Intensities: Infrared, Ra-man, Vibrational Circular Dichroism, and Raman Op-tical Activity, The Journal of Physical Chemistry A 119 (2015) 11862–11874. ZSCC: 0000070.
[32] W. Lodyga, M. Krglewski, P. Pracna, . Urban, Ad-vanced graphical software for assignments of transitions in rovibrational spectra, Journal of Molecular Spec-troscopy 243 (2007) 182 – 188. PRAHA2006, The 19th International Conference on High Resolution Molecular Spectroscopy.
[33] H. M. Pickett, The Fitting and Prediction of Vibration-rotation Spectra with Spin Interactions, J. Mol. Spec-trosc. 148 (1991) 371–377.
[34] M. C. McCarthy, W. Chen, M. J. Travers, P. Thaddeus, Microwave Spectra of 11 Polyyne Carbon Chains, The Astrophysical Journal Supplement Series 129 (2000) 611.
[35] K. L. K. Lee, M. McCarthy, Bayesian Analysis of Theo-retical Rotational Constants from Low-Cost Electronic Structure Methods, The Journal of Physical Chemistry A 5 (2020) 898–910.
[36] K. L. K. Lee, B. A. McGuire, M. C. McCarthy, Gas-phase synthetic pathways to benzene and benzonitrile: a combined microwave and thermochemical investiga-tion, Physical Chemistry Chemical Physics 21 (2019) 2946–2956.
Supporting Information
Pure rotational and vibrational investigation of
cyanophenylacetylene (C
6
H
5
C
3
N)
Zachary Buchanan
a,b, Kin Long Kelvin Lee
c, Olivia Chitarra
a, Michael C.
McCarthy
c, Olivier Pirali
a,d, Marie-Aline Martin-Drumel
aaUniversit´e Paris-Saclay, CNRS, Institut des Sciences Mol´eculaires d’Orsay, 91405
Orsay, France
bDepartment of Chemistry, The University of California Davis, Davis, CA, USA cCenter for Astrophysics | Harvard & Smithsonian, Cambridge, Massachusetts 02138,
United States
dSOLEIL Synchrotron, AILES beamline, l’Orme des Merisiers, Saint-Aubin, 91190
Gif-sur-Yvette, France
List of Figures
S1
Experimental CP-FTMW spectrum and comparison with a
simulation using the Bayesian scaled set of rotational constants
2
List of Tables
S1
Optimized equilibrium structure for PhC
3N
. . . .
3
S2
Optimized equilibrium structure for PhCCNC . . . .
4
S3
Optimized equilibrium structure for 2-cyanoethynylbenzene
(CEB). . . .
5
S4
Optimized equilibrium structure for 3-cyanoethynylbenzene
(CEB). . . .
6
S5
Optimized equilibrium structure for 4-cyanoethynylbenzene
(CEB). . . .
7
S6
Theoretical rotational constants for the PhC
3N isomers of
0.00
0.25
0.50
0.75
1.00
8000 10000 12000 14000 16000 18000
0.00
0.25
0.50
0.75
1.00
8500 8750
Frequency / MHz
Intensity / arb. u.
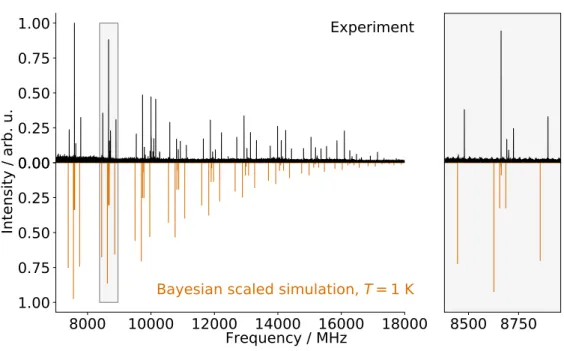
Experiment
Bayesian scaled simulation, T = 1 K
Figure S1: Experimental CP-FTMW spectrum (in black) of PhC3N and comparison with a simulation at Trot= 1 K using the Bayesian scaled set of rotational constants (in orange).
Simulation performed using the PGOPHER software [1].
15
PhC3N - wB97XD/cc-pVQZ
C
0.00000
0.00000
-0.37697
C
-0.00000
1.20783
-1.07655
C
-0.00000
1.20212
-2.45919
C
0.00000
0.00000
-3.15123
C
-0.00000
-1.20783
-1.07655
C
-0.00000
-1.20212
-2.45919
H
0.00000
0.00000
-4.23221
H
0.00000
-2.13859
-2.99859
H
0.00000
2.13859
-2.99859
H
-0.00000
2.13971
-0.52977
C
-0.00000
-0.00000
1.04708
H
-0.00000
-2.13971
-0.52977
C
-0.00000
-0.00000
2.24846
C
-0.00000
-0.00000
3.61995
N
-0.00000
-0.00000
4.77057
Table S1: Optimized equilibrium structure for PhC3N
15
PhCCNC - wB97XD/cc-pVQZ
C
0.00000
-0.00000
0.34801
C
0.00000
1.20610
1.05012
C
0.00000
1.20113
2.43316
C
0.00000
-0.00000
3.12656
C
0.00000
-1.20610
1.05012
C
0.00000
-1.20113
2.43316
C
-0.00000
0.00000
-1.07877
H
0.00000
-2.13857
0.50420
H
-0.00000
2.13857
0.50420
H
0.00000
2.13823
2.97177
H
0.00000
-0.00000
4.20756
H
0.00000
-2.13823
2.97177
C
-0.00000
0.00000
-2.27706
N
-0.00000
0.00000
-3.58777
C
-0.00000
0.00000
-4.75947
Table S2: Optimized equilibrium structure for PhCCNC
15
2-CEB - wB97XD/cc-pVQZ
N
2.03046
2.29735
-0.00000
C
1.13723
1.57719
-0.00000
C
0.00000
0.70670
-0.00000
C
-1.27703
1.25948
-0.00000
C
-2.38810
0.43728
-0.00000
C
-2.22851
-0.94055
0.00000
C
-0.96308
-1.49784
0.00000
C
0.16962
-0.68639
0.00000
C
1.47265
-1.26646
0.00000
C
2.56688
-1.74980
0.00000
H
-1.38577
2.33413
-0.00000
H
-3.37744
0.87135
-0.00000
H
-3.09573
-1.58553
0.00000
H
-0.83535
-2.57029
0.00000
H
3.54307
-2.16882
0.00000
Table S3: Optimized equilibrium structure for 2-cyanoethynylbenzene (CEB).
15
3-CEB - wB97XD/cc-pVQZ
N
-3.41959
-1.41606
-0.00000
C
-2.43943
-0.81962
-0.00000
C
-1.21675
-0.07068
-0.00000
C
-0.00000
-0.74224
0.00000
C
1.18921
-0.01921
0.00000
C
2.44509
-0.70232
0.00000
C
3.49696
-1.27279
0.00000
C
1.14276
1.37538
0.00000
C
-0.07306
2.03599
-0.00000
C
-1.25750
1.32147
-0.00000
H
0.02394
-1.82174
0.00000
H
4.42990
-1.78083
0.00000
H
2.06790
1.93333
0.00000
H
-0.09777
3.11610
-0.00000
H
-2.21048
1.82977
-0.00000
Table S4: Optimized equilibrium structure for 3-cyanoethynylbenzene (CEB).
15
4-CEB - wB97XD/cc-pVQZ
N
0.00000
-0.00000
3.98815
C
0.00000
-0.00000
2.84052
C
0.00000
-0.00000
1.40784
C
0.00000
-1.20724
0.71302
C
-0.00000
-1.20528
-0.66698
C
-0.00000
0.00000
-1.37042
C
-0.00000
0.00000
-2.79927
C
-0.00000
0.00000
-3.99611
C
0.00000
1.20528
-0.66698
C
0.00000
1.20724
0.71302
H
0.00000
-2.13957
1.25833
H
-0.00000
-2.13790
-1.21161
H
-0.00000
0.00000
-5.05843
H
0.00000
2.13790
-1.21161
H
0.00000
2.13957
1.25833
Table S5: Optimized equilibrium structure for 4-cyanoethynylbenzene (CEB).
Table S6: Theoretical rotational constants for the PhC3N isomers of interest. Values are
given in MHz. A(BC)e and A(BC)0 values correspond to theoretical equilibrium values,
calculated at the ωB97X-D/cc-pVQZ level of theory, without and with (respectively) the mean Bayesian scaling correction (0.9866 × A(BC)e) from Table 3 of Ref. [2]. A(BC)0
values correspond to ground state predictions from the anharmonic (VPT2) calculation at the same level of theory. A(BC)sevalues correspond to values scaled using semi-empirical
scaling factors derived as the ratio of the PhC3N equilibrium values and the experimentally determined parameters reported in this work. Dipole moments are given in Debye, with a nominal Bayesian uncertainty of ±0.25 D.