HAL Id: tel-02606580
https://hal.inrae.fr/tel-02606580
Submitted on 16 May 2020
HAL is a multi-disciplinary open access
archive for the deposit and dissemination of sci-entific research documents, whether they are pub-lished or not. The documents may come from teaching and research institutions in France or abroad, or from public or private research centers.
L’archive ouverte pluridisciplinaire HAL, est destinée au dépôt et à la diffusion de documents scientifiques de niveau recherche, publiés ou non, émanant des établissements d’enseignement et de recherche français ou étrangers, des laboratoires publics ou privés.
Characterization of chemical and biological clogging and
their interactions within a micro-irrigation system in the
context of the reuse of treated effluents in irrigation
N. Rizk
To cite this version:
N. Rizk. Characterization of chemical and biological clogging and their interactions within a micro-irrigation system in the context of the reuse of treated effluents in micro-irrigation. Environmental Sciences. Doctorat Génie des Procédés, Université d’Aix-Marseille, 2017. English. �NNT : 2017AIXM0224�. �tel-02606580�
UNIVERSITE D’AIX MARSEILLE
Ecole Doctorale des Sciences pour l’Environnement
Discipline : G´enie des Proc´ed´es
TH `
ESE
Pr´esent´ee en vue d’obtenir le grade de
DOCTEUR DE L’UNIVERSIT ´
E D’AIX-MARSEILLE
Facult´e des Sciences et Techniques
par
Nancy Rizk
Caract´erisation du colmatage chimique et biologique et leurs interactions
au sein d’un dispositif de micro-irrigation dans le contexte de la
r´eutilisation des eaux us´ees ´epur´ees en irrigation
Characterization of chemical and biological clogging and their
interactions within a micro-irrigation system in the context of the reuse of
treated effluents in irrigation
Soutenue publiquement le 21 juillet 2017 devant le jury compos´e de :
Dr. Nassim AIT MOUHEB Charg´e de recherche G-EAU, IRSTEA, Montpellier Examinateur Pr. Christophe DAGOT Professeur Universit´e de Limoges Rapporteur Dr. Renauld ESCUDIE Directeur de recherche LBE, INRA, Narbonne Rapporteur Pr. Marc HERAN Professeur Universit´e de Montpellier Pr´esident du jury Dr. Bruno MOLLE Ing´enieur de Recherche G-EAU, IRSTEA, Montpellier Examinateur Pr. Nicolas ROCHE Professeur Universit´e d’Aix-Marseille Directeur de th`ese Pr. Guilhem Bourri´e Directeur de recherche EMMAH, INRA, Avignon Invit´e
ACKNOWLEDGEMENTS
“I am thankful to all those who said ”NO”. It’s because of them, I did it myself” Wayne W. Dyer
4
This thesis was carried out in collaboration between IRSTEA (Institut national de Recherche en Sciences et Technologies pour l’Environnement et l’Agriculture, UMR G-eau) and M2P2 (M´ecanique, Mod´elisation et Proc´ed´es Propres, AMU-CNRS) laboratory. I would like to thank all the members of these two structures for having welcomed me during these three years and the NGO T.E.R.R.E Liban that funded this research.
I would also like to thank the people who supervised this work: Prof. Nicolas ROCHE at Aix-Marseille University who agreed to direct my thesis, as well as Dr. Nassim AIT MOUHEB and Dr. Bruno MOLLE at IRSTEA institute for their investment in this thesis. I would like to thank them for their availability, advice and support.
I also thank my dissertation committee members Prof. Christophe DAGOT and Dr. Renauld ES-CUDIE, who agreed to make reports on this thesis, and Prof. Marc HERAN for agreeing to evaluate this work and for its participation in the jury. I also thank Prof. Guilhem Bourri´e for the valuable advice he gave me for the setting of numerical experimentations.
This research paper would not have been possible without the help and assistance of David TANG, Jean-Francois BONICEL, David BASTIDON, Jean-Philippe TRANI, Franc¸ois LIRON and Geoffrey FROMENT the technicians and engineers from IRSTEA team and Jean-Paul NISTERON the technician from Aix-Marseille University. I would thank Dr. Joel COUVE and Dr. Bernard FRAISSE from Mont-pellier University for their permission and help to use the analytical laboratory materials.
I would like to express my gratitude to the many people who supported and encouraged me through this research. To all the team of IRSTEA Montpellier especially Jaafar AL MUHAMMAD, Souha GAMRI, David NORTES MARTINEZ, Sandrine DHENAIN, Pierre-Olivier MALATERRE, David DORCHIES, Daniel MOURA, Augustin LUXIN, Rami AL BACHA, Cyril CHEVARIN, and many more.
I also do not forget to thank all PhD students and trainees with whom I shared good times. To my friends from outside the laboratory and to Dr. Roger MOUSSA my guarantor who without him I could not have visited some superb places in the south of France and shared many experiences.
My deepest thanks goes to my family and especially my father, mother and sister for their support, prayers, encouragement and because they believed in me throughout the school, university and thesis. Without them I would not be in France and this work would not be done.
And finally a big thanks for my darling who concentrated all his effort and his energy so that I can be in good condition for the finalization of this work even if thousands of kilometers separated us he was waiting for any occasion to help me in France and thanks to his love and successive encouragement I felt his presence always beside me.
5
“A river cuts through rock, not because of its power, but because of its persistence” James N. Watkins
Contents
ACKNOWLEDGEMENTS 3
DEDICATION 5
TABLE OF CONTENTS 6
General Introduction: 18
I Context and Objectives 22
I.1 Wastewater reuse in irrigation 24
I.1.1 Context and issues related to the reuse of treated wastewater . . . 24
I.1.2 Worldwide application of wastewater in irrigation . . . 25
I.1.3 Wastewater . . . 26
I.1.4 Water treatment in a Wastewater Treatment Plant (WWTP) . . . 26
I.1.5 Beneficial and negative impacts of the reuse of treated wastewater for agricultural irri-gation . . . 28
I.2 Irrigation generalities 30 I.2.1 Irrigation systems . . . 30
I.2.2 Clogging problems in micro-irrigation systems . . . 34
I.2.3 Types of drippers . . . 37
I.2.4 Hydrodynamics and flow behavior of drippers . . . 38
I.2.5 Parameters influencing clogging in micro-irrigation . . . 40
I.3 Biofilm 44 I.3.1 Definition of Biofilm . . . 44
I.3.2 Advantages and disadvantage of biofilms development . . . 45
I.3.3 The different stages of biofilm development . . . 45
CONTENTS 7
I.3.4 Factors influencing the different stages of biofilm development in micro-irrigation
sys-tems . . . 48
I.4 Characterization of chemical and biological clogging 54 Conclusion and thesis objectives 60 II Materials and Methods 62 Introduction 64 II.1 Characterization of chemical precipitation 66 II.1.1 Chemical precipitation in batch reactors . . . 67
II.1.2 Precipitation modeling with PHREEQC . . . 68
II.2 Effect of shear stress on biofilm development 72 II.2.1 Taylor-Couette Reactor generalities . . . 73
II.2.2 Hydrodynamic conditions inside TCR . . . 74
II.2.3 Choice of the shear stress . . . 77
II.2.4 TCR speed rotation and parameters . . . 79
II.2.5 TCR experimental set-up . . . 80
II.2.6 Experimental protocol . . . 82
II.2.7 Wastewater Treatment Plant (WWTP) of Mauguio . . . 82
II.2.8 Analyzing the water quality inside the TCR . . . 85
II.3 Effect of calcium carbonate on biofilm development 86 II.3.1 Experimental set-up . . . 86
II.3.2 Method of fouling analysis . . . 88
II.3.3 Synthetic effluent quality . . . 89
II.3.4 Characterization of the fouling material . . . 90
III Characterization of chemical precipitation 92 Introduction 94 III.1 Experimental characterization 96 III.1.1 Chemical precipitation . . . 96
CONTENTS 8
III.1.3 Precipitate characterization by thermogravimetric analysis (TGA) . . . 101
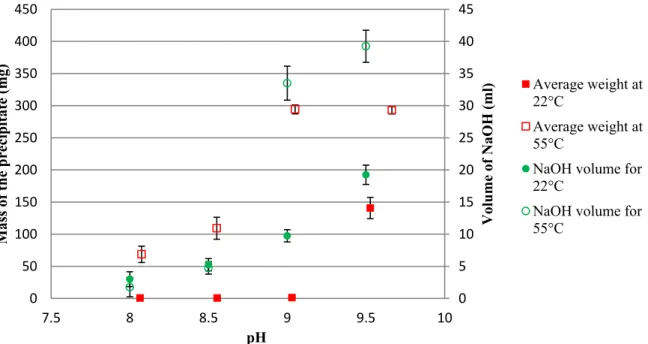
III.1.4 Effect of pH and temperature on calcium carbonate precipitation . . . 102
III.2 Numerical characterization 106 III.2.1 Treated wastewater speciation . . . 106
III.2.2 Calcite saturation index in function of pH and temperature . . . 107
III.2.3 Experimental and numerical calculation of pH and SI . . . 108
III.2.4 Numerical precipitation of calcite . . . 111
III.2.5 Effect of CO2partial pressure on calcite precipitation . . . 114
Conclusion 116 IV Characterization of biological fouling 118 Introduction 120 IV.1 Effect of shear stress on biofilm development 122 IV.1.1 Validation of the protocol for monitoring the biofilm development kinetics . . . 122
IV.1.2 Evolution of the fouling in the TCR . . . 123
IV.1.3 Characterization of fouling chemical composition inside the TCR . . . 129
IV.1.4 Conclusion . . . 133
IV.2 Effect of calcium carbonate precipitation 136 IV.2.1 Interaction between calcium carbonate precipitation and biofilm development in irriga-tion pipes. . . 137
IV.2.2 Characterization of the fouling by DRX and TGA. . . 141
IV.2.3 Effect of calcium carbonate precipitation on biofilm development and dripper clogging. 145 IV.2.4 Conclusion . . . 152
V R´esum´e d´etaill´e en Franc¸ais 158 V.1 Contextes et Objectifs de la th`ese: 160 V.2 Mat´eriels et m´ethodes 162 Qualit´e de l’eau . . . 162
Pr´ecipitation chimique au laboratoire . . . 162
Mod´elisation de la pr´ecipitation avec PHREEQC . . . 163
CONTENTS 9
Effet du carbonate de calcium sur le d´eveloppement du biofilm . . . 164
Caract´erisation de l’encrassement . . . 165
V.3 Caract´erisation de la pr´ecipitation chimique 166 Pr´ecipitation chimique au laboratoire . . . 166
Caract´erisation num´erique de la pr´ecipitation chimique . . . 167
V.4 Caract´erisation du colmatage biologique 169 D´eveloppement du biofilm en fonction des contraintes de cisaillement . . . 169
Interaction entre carbonate de calcium et d´eveloppement du biofilm . . . 170
Conclusion et perspectives 172 List of Figures 174 List of Tables 178 References 180 Annex 206 A.1 Standards of wastewater used in irrigation . . . 206
A.2 Composition and structure of the biofilm . . . 207
A.3 Extracellelar polymeric substances (EPS) . . . 208
A.4 COD/ TS/VS/DRX/TGA . . . 209
A.5 Determination and description of the different regimes . . . 211
A.6 Various Ta and Re data for regimes transitions . . . 212
A.7 Shear stress calculation inside the drippers . . . 212
A.8 Plate preparation and sampling . . . 214
A.9 Average and standard deviation of the water quality at the outlet of Mauguio WWTP . 215 A.10 Yield rate calculation and values of consumed DCO . . . 216
A.11 XRD pattern for the different shear stress . . . 217
A.12 TGA pattern for the different shear stress . . . 219
A.13 Measurement of COD inside T1 and T2 . . . 227
A.14 DRX graph for T1 and T2 . . . 227
A.15 TGA/MS thermal curves for T1 and T2 . . . 233
A.16 Drippers optical observation . . . 235
CONTENTS 10
Nomenclature
Latin alphabet
˙ai Empirical ion-size parameter
-t Time s
Ai, At Cell and total surface respectively m2
ae Field application efficiency %
cKs Concentration solubility
-ce Conveyance efficiency %
Dh Hydraulic Diameter m
e Gap width between the inner cylinder and the outer cylinder m
H Working pressure head at the dripper bar
h Height of the reactor cylinders m
I Ionic strength
-ie Scheme irrigation efficiency %
Kd Constant of proportionality that characterizes each dripper
-mb Mass of biofilm that develops on all the plates at a period t mg
mCOD Consumed COD corresponding to the same period t mg
n Cells number
CONTENTS 12
q Dripper discharge m3/s
R1, R2 Radii of the two cylinders m
Re Reynolds number
-Rec Critical Reynolds number
S Saturation
-Si, Sm Cell and average strain rate respectively s−1
SI Saturation Index
-T Temperature ◦C
Ta Taylor number
-Tac Critical Taylor number
-V Flow velocity m/s
X Average flow rate at the same time (t) m3.s−1 x Dripper discharge exponent
Y Yield rate Greek alphabet
α Constant 0,1556
Γ Aspect ratio (h/e)
-γi The activity coefficient
-λ Radiation wavelengt A˚
µ The dynamic viscosity of the fluid for water 1.00 × 10⁻³Pa.s ν The kinematic viscosity of fluid for water 1.00 × 10−06m2/s
Ω Angular velocity rad/s
CONTENTS 13
Φ Pipe diameter m
ρ Fluid density for water 1000 kg/m3
σ Standard deviation of dripper flow rate at a specific time
τ Wall shear stress N/m2
2θ Incidence angle of the x-ray beam deflected by an angle of 2θ Abbreviations
ACC Amorphous Calcium Carbonate COD Carbon Oxygen Demand CU Coefficient of Uniformity CV Coefficient of Variation DOC Dissolved Organic Carbon Dra Discharge ratio variation DTG TGA derivative
EPS Extracellular Polymeric Substances IE Inhabitant Equivalents
IM Inorganic Matter
LDPE Low Density Polyethylene LSSR Low Shear Stress Reactor NPC Non-Pressure Compensating NTK Nitrogen Kjeldahl
OM Organic Matter
PC Pressure Compensating PE Polyethylene
CONTENTS 14
rpm Rotations per minute SD Standard Deviation
SEM Standard Error of the Mean SS Suspended Solids
SU Statistical Uniformity TCR Taylor-Couette Reactor
TG-MS Thermogravimetric analysis–mass spectrometry TGA Thermogravimetric Analysis
TOC Total Organic Carbon TS Total Solids
TSS Total Suspended Solids TTF Turbulent Taylor Flow TVF Turbulent Vortex Flow VS Volatile Solids
WVF Wavy Vortex Flow XRD X-Ray Diffraction
Acronymes
CAT Complete Alkalimetric Title CFD Computational Fluid Dynamics DGV Doppler Global Velocimetry EPA Environmental Protection Agency FAO Food and Agriculture Organization IWMI International Water Management Institute
CONTENTS 15
LDV Laser Doppler Velocimetry LIF Laser Induced Fluorescence
NPC2 Non-Pressure-compensating drippers (2 l/h) PIDV Particle Image Displacement Velocimetry PIV Particle Image Velocimetry
PTV Particle Tracking Velocimetry
UNESCO United Nations Educational, Scientific and Cultural Organization UNWWAP United Nations World Water Assessment Programme
WRG Water Resources Group WWTP WasteWater Treatment Plant
Chemical elements
BOD5 5-day Biochemical Oxygen Demand
Ca3(PO4)2 Calcium Phosphate
Ca2+ Calcium ions CaCl2 Calcium chloride
CaCO3 Calcium Carbonate
CaO Calcium Oxide
CaPO4 Calcium orthophosphates
CO2 Carbon Dioxide
Fe2O3 Iron(III) oxide
H2CO3 Carbonic Acid
H2O Water
CONTENTS 16
HCO3– Bicarbonate ion
Mg2+ Magnesium ions NaHCO3 Sodium bicarbonate
NaOH Sodium Hydroxide NO2– Nitrite
NO3– Nitrate
OH– Hydroxide ions PO43 – Mineral phosphorus
General Introduction:
Problems of overexploitation of water resources and their pollution increases every year around the world. In addition, water withdrawals for agriculture are becoming more and more important with the increasing demand for food. Today, irrigation uses 70% of the world’s water resources. Faced with the problem of water resource rarefaction, especially in arid and semi-arid countries, reuse of treated wastewater for irrigation appears to be an efficient solution. Problems related to water shortage are lim-ited and the crop yield is improved due to the fertilizer potential of this resource. Indeed, the treated wastewaters are rich in nutrients (nitrogen, phosphorus and potassium). Therefore, their use can reduce fertilizer inputs while increasing crop yield.
Among several irrigation techniques for the reuse of treated wastewater, micro-irrigation is the most efficient and safest. It consists of bringing irrigation water to the bottom of the crops. This technique allows achievement of water savings by reducing the losses by infiltration and evaporation. Micro-irrigation also reduces the health risks associated with the use of treated wastewater by limiting the contact of farmers and crops with irrigation water. However, clogging of drippers is a common problem in drip irrigation. It causes a dysfunction of the irrigation system as the uniformity of the dis-tribution progressively decreases. This results in reduced crop yield and damage to irrigation systems. The clogging of micro-irrigation devices can be traced to (i) accumulation of particulate matter due to the presence of suspended solids (physical clogging), (ii) precipitation of soluble salts present at a concentra-tion above saturaconcentra-tion (chemical clogging) and (iii) biofilm development (biological clogging) (Dosoretz et al., 2011[85]). These phenomena are interlinked and are observed in all the components of micro-irrigation systems (pipes, drippers, etc.). The small section of the drippers (on the order of millimeters) makes them more vulnerable to clogging. The clogging of localized irrigation drippers is of concern to farmers and often justifies the use of treatment procedures. Mineral particles more than 80 µm are retained by filtration. The chemical elements are removed using acidic solutions. Chlorination treatment is often used to control the development of biofilm in irrigation systems, but its effectiveness remains limited (Levy et al., 2011[168]).
General Introduction: 19
Many researchers have investigated dripper clogging by biofilm development in an experimen-tal context using treated wastewater (Karaca and Uc¸an, 2013[146], Tarchitzky et al., 2013[271]). Other works have focused more on the influence of hydrodynamic conditions in the pipes and drippers on the development of these associations of microorganisms. However no studies have focused on chemical clogging and the possibility of modeling salt precipitation and the interaction between chemical precipi-tation and biofilm development inside pipes and drippers.
We suggest in this work that has been done within IRSTEA (Institut national de Recherche en Sciences et Technologies pour l’Environnement et l’Agriculture, UMR G-eau) and M2P2 (M´ecanique, Mod´elisation et Proc´ed´es Propres, AMU-CNRS) laboratory to study the mechanisms of chemical and biological clogging, and their interactions in micro-irrigation.
The main objective of this thesis is to introduce new elements on the clogging of drippers and fouling of pipes done at laboratory scale under well-controlled conditions in the context of the reuse of wastewater in irrigation. In order to acheive this objectif, this research is divided into three parts.
In the first part of the study, we will explore an experimental set-up composed of batch reac-tors which allows us to follow the chemical precipitation while mastering the operating conditions. The experimental results allowed us to validate and calibrate the modeling of the precipitation under PHREEQC’s software. This numerical model allows prediction and quantification of chemical precipi-tation for a given water quality under various operating conditions of pH, temperature and CO2 partial
pressure.
In the second part, an analysis of the effect of the shear stresses on the biofilm development will be carried out using a Taylor-Couette reactor (TCR). The TCR is a good method for developing the biofilm under particular hydrodynamic conditions which in this study will be similar to those encoun-tered in irrigation.
In the third part, we will study the development of biofilm with and without calcium carbon-ate. To do this, an irrigation set-up was implemented and a follow-up of the clogging of drippers and pipes was done. The results will show the interaction between biofilm development and calcium carbon-ate precipitation.
General Introduction: 20
The plan of the manuscript is therefore sorted in the following way:
In ChapterI, we will present the state of art of the study context concerning water reuse in irrigation as well as the works done on biofilm development (parameters influencing its development, etc.), chem-ical precipitation and their interaction. In ChapterII, we will describe the experimental set-ups as well as the protocols used. In ChapterIII, we will discuss the experimental and numerical results on chemical precipitation using treated wastewater. And in ChapterIV, we will discuss the biofilm development and the interaction between biofilm and calcium carbonate.
Chapter I
Context and Objectives
Part I.1
Wastewater reuse in irrigation
I.1.1
Context and issues related to the reuse of treated wastewater
Mediterranean countries, developing countries and arid regions are particularly vulnerable to wa-ter stress and suffer from most of the current global changes such as erosion of diversity, climate change, population growth, industrialization and especially the increasing degradation of water resources (over-exploitation, pollution, salinization, etc.). A continuation of the development trend will lead to a 55% increase of global water demand by 2050 (WRG, 2009[1]; UNWWAP, 20151). By 2025, 1.8 billion peo-ple will live in countries or regions where water availability is less than 100 m3/ capita / year according to the International Water Management Institute (IWMI). As a result, humanity is facing a multitude of water-related problems and major improvements in water management strategies are indispensable for a sustainable future (Bagatin et al., 2014[24]; Alnouri et al., 2015[13]). Water recycling and especially wastewater reuse is becoming a critical element for managing our water resources for both environmental and economic reasons. Another reason to reuse wastewater is that its volume is constantly increasing with the expansion and intensification of urban planning. The U.S. Environmental Protection Agency (EPA) defines wastewater reuse as, ”using wastewater or reclaimed water from one application for another ap-plication. The deliberate use of reclaimed water or wastewater must be in compliance with applicable rules for a beneficial purpose (landscape irrigation, agricultural irrigation, aesthetic uses, ground water recharge, industrial uses, and fire protection). A common type of recycled water is water that has been reclaimed from municipal wastewater (sewage).” Agriculture, especially crop production, is the sector that consumes the biggest quantity of water. Water use for crop irrigation accounts for 70% and in some cases 90% of the water needs in the world (Kalavrouziotis et al., 2011[145]; UNESCO 2003[280]). To
1http://www.unesco.org/fileadmin/MULTIMEDIA/HQ/SC/images/WWDR2015Facts
FiguresEN Gweb.pdf
Accessed June 2017 .
PART I.1. WASTEWATER REUSE IN IRRIGATION 25
reduce the pressure on freshwater resources and preserve them for the supply of drinking water, many countries reuse treated wastewater for irrigation.
Figure I.1:Map showing areas of the world with water scarcity. Map by Mesfin M. Mekonnen and Arjen Y, 2016[189], courtesy Science Advances. CC-BY-NC-4.0 (National Geographic, 15/02/2016)
I.1.2
Worldwide application of wastewater in irrigation
Irrigation with wastewater even with no treatment or just primary treatment is a common practice in developing countries like China, India, Mexico, etc. due to high treatment costs (Lazarova and Bahri, 2005[165]). In water scare regions of developed countries such as Australia, the Middle East, and coastal or inland areas of France and Italy, treated wastewater is used for irrigation (IWMI, 2007[138]). In Spain, 408 million m3 of treated wastewater is reused; In Italy, ambitious projects are being created (22,000 ha of vegetable crops are irrigated with treated wastewater from a sewage treatment plant with a capacity of more than one million inhabitants). Cyprus has the most ambitious objective: to reuse 100% of treated wastewater (Lazarova and Brissaud, 2007[166]).
For this reason, the selection of appropriate wastewater treatment at an affordable cost and adapted irrigation practices are the two main necessary measures to protect public health and prevent harmful conditions and damage to crops, soil and groundwater. Various reclamation technologies can be used to treat wastewater prior to irrigation, such as lagoon ponds, constructed wetlands, conventional wastew-ater treatment plants, membrane bioreactors, membrane filtration and others. However, these methods generally need large land areas and involve high investment costs (Norton-Brandao et al., 2013[214]). More details are found in paragraphI.1.5for the benefits and the disadvantages of the reuse of treated wastewater for irrigation.
PART I.1. WASTEWATER REUSE IN IRRIGATION 26
I.1.3
Wastewater
Wastewater is all waters entering sewage pipes whose natural properties are transformed by do-mestic uses, industrial, agricultural and other enterprises. Rainwater that flows into these pipelines is also included (Bliefert and Perraud, 2001[36]). There are several categories of pollutants:
- Particulate pollution, which refers to biodegradable and non-biodegradable mineral suspensions (MS or SS for suspended solids) or organic (VS for volatile solids).
- Organic pollution which includes biodegradable materials (BOD5), non-biodegradable materials,
toxic substances, inhibitory material, dissolved and particulate matter.
- Nitrogen pollution consists of nitrogen in reduced form (organic nitrogen, ammoniacal nitrogen (NTK = nitrogen Kjeldahl)) or oxidized (nitrite (NO2–), nitrate (NO3–)).
- Phosphorus pollution composed of mineral phosphorus (including PO43 –) and organic
phospho-rus.
- Microbiological pollution consisting of bacteria, viruses, protozoa and fungi.
For wastewater reuse and even for a rejection in nature, treatment series must be made. The concentra-tions of the input elements of the treatment plant are variable and depend on the size of the agglomer-ations and the origin of these waters. TableI.1shows the flow of pollutants released per inhabitant per day according to the decree of 10/12/1991.
Table I.1:Flow of pollutants released per inhabitant per day for a volume of 150 liters of water. SS COD COD BOD5 NTK P
Flow per capita / day for a vol-ume of 150 liters of water
90g 100-130 g O2 60g O2 13-15g N 4g P
I.1.4
Water treatment in a Wastewater Treatment Plant (WWTP)
Developed countries have generated techniques and guidelines for safe reuse of wastewater in irrigation for the purposes of health and environment. Water treatment represents a technological and economic challenge with the common goal of preserving biodiversity and protecting water resources. Depending on the degree of elimination of pollution and the processes implemented, several treatment levels are generally defined: pretreatment, primary treatment and secondary treatment. In some cases, tertiary treatment is applied, particularly when treated water must be disposed of in particularly sensitive
PART I.1. WASTEWATER REUSE IN IRRIGATION 27
areas. There are also extensive treatments known as lagoons, which combine biological, physical and natural. TableI.2shows the different stages of water treatment in a WWTP from pretreatment to tertiary treatment.
Table I.2:Different stages of water treatment in a WWTP from pretreatment to tertiary treatment.
Treatments Objectives Pretreatment: -Screening -Degreasing -Degritting -Shredding Removal of:
-Particles larger than 2 mm -Grease
-Sand
Reduction in amount of waste Primary treatment:
-Primary decantation
-Primary decantation with the addition of reagent
Elimination of particulate pollution
Efficiency: SS: 50-60%; COD and BOD5:
25-35%; NTK and P: < 10%
Efficiency: SS: 90%; COD and BOD5: 60-70%;
NTK: < 10% ; P: 80% Secondary treatment:
-Suspended bacteria treatment processes -Fixed bacteria treatment processes
Elimination of biodegradable pollution
Dissolved and particulate COD, BOD5, N and P
Tertiary treatment: -Refining treatment -Disinfection
Improvement of quality of treated water on the parameters SS, COD, BOD5, N and P.
Abatement of pathogenic germs
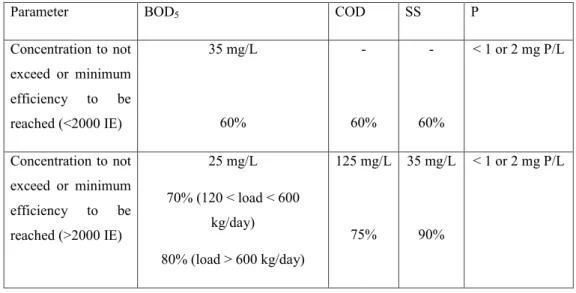
According to French regulations, the discharge levels of urban effluents into non sensitive zones for WWTPs treating a gross load < 120kg BOD5 / day (< 2000 inhabitant equivalents “IE”) and
> 120kg BOD5 / day (> 2000 inhabitant equivalents “IE”) are presented in TableI.3(decree of 22
June 2007).
Table I.3:Values to respect for urban effluents discharges into non-sensitive areas.
Parameter BOD5 COD SS P
Concentration to not exceed or minimum efficiency to be reached (<2000 IE) 35 mg/L 60% -60% -60% < 1 or 2 mg P/L Concentration to not exceed or minimum efficiency to be reached (>2000 IE) 25 mg/L 70% (120 < load < 600 kg/day) 80% (load > 600 kg/day) 125 mg/L 75% 35 mg/L 90% < 1 or 2 mg P/L
PART I.1. WASTEWATER REUSE IN IRRIGATION 28
I.1.5
Beneficial and negative impacts of the reuse of treated wastewater
for agricultural irrigation
The reuse of wastewater in irrigation results in both positive and negative impacts on soil, crops and health. This practice can benefit soil and farmers, while at the same time posing a risk of contami-nation to the ecosystem.
I.1.5.1 Benefits of wastewater reuse
The use of treated wastewater in irrigation can positively influence crop production and improve physico-chemical characteristics of soil (Kiziloglu et al., 2007[155]). The presence of nitrogen, phos-phorus, organic matter, and other trace elements in the water provides a good source of nutrients for the growth, yield and quality of crops, minimizes soil degradation, improves fertility and restores the nutrient contents of soil (Benitez et al., 2001[33]; Plauborg et al., 2010[232]; Abusam and Al-Anzi, 2011[3]; Khurana and Singh, 2012[154]; Christou et al., 2014[63]; Almuktar et al., 2015[11]; Almuk-tar and Scholz, 2016[12]). The extra supply of organic carbon or the addition of micro-organisms via wastewater increases the soil microbial activity. This increase in microbial activity of the soil brings benefits to both agriculture and the development of flora and fauna in the soil ecosystem (Friedel et al., 2000[106]). Wastewater reuse can also have an economic benefit since it has limited costs compared to other techniques developed to obtain fresh water. Production of treated wastewater may cost less than the supply of deep groundwater, water import and desalination (Veolia, 2006[283]). A cost-benefit analysis was done in 2014 on treated wastewater reuse by IRSTEA for ONEMA. One focus was the sport of golf in the city of Sainte Maxime, France. Golf consumes 12% of total water volume issued in Sainte Maxime. Using treated wastewater instead of drinking water, golf has an additional cost of 2 millione for the new watering system but it is largely offset by the 5.9 millione of savings in terms of re-grassing, fertilizer and especially water purchase (Loubier and Declercq, 2014[182]).
I.1.5.2 Negative impacts of wastewater reuse in agriculture
The main downside of reusing treated wastewater in agriculture is the pollution of soil, the po-tential contamination of crops (Khan et al., 2008[153]) and water sources (Batarseh et al., 2011[28]). Municipal wastewater contains a huge quantity and variety of pathogenic agents, such as bacteria, pro-tozoa and viruses. The study of microbial contamination is focused on the pollution of crops rather than the soils receiving wastewater. This is because a greater number of people are exposed to pathogenic
PART I.1. WASTEWATER REUSE IN IRRIGATION 29
microorganisms through consumption of contaminated crops. It also has a significant risk of helminth, bacterial/viral and protozoan infections for farm workers and their families, causing diarrhea and hook-worm disease (Blumenthal and Peasey, 2002[38]). Crops are polluted by direct contact with wastewater during irrigation. Pollution of the edible parts of plants depends not only on the quality of water, but also on the quantity applied to soil, the irrigation method and the type of crop. Other risk factors have only measurable effects over longer periods and increase with the continued use of wastewater, such as the salinity of the soil (Levy et al., 2011[168]; Muyen et al., 2011[203]), the accumulation of toxic chemicals (Kukul et al., 2007[160]) heavy metals and organic compounds (Mapanda et al., 2005[186]; Rattan et al., 2005[239]) . Different levels of risk are perceived for different heavy metals. While some of them are nutrients for plants at trace concentrations (Cu, Fe, Mn, Mo, Zn, Ni) others have been shown to produce harmful effects on exposed organisms or are absorbed by plants and accumulated through the food web (Cr, As, Pb, Hg, Al, Cd). Pollution of soil by organic polluants (pesticides, polyaromatic hydrocarbons, organochlorides, paraffin, organic solvents, etc.) can have different effects in soil organisms depending on the compound. For example some antibiotics (chlortetracycline, etc.) can decrease crop growth and inhibit the microbial activity of the soil. FigureI.2shows the 20 countries with the highest use of un-treated wastewater for agricultural irrigation. China is the country with the highest volume of unun-treated wastewater in agriculture (Jimenez et al., 2008[139]), followed by Mexico then the United States. We can also see in this figure sites where monitoring studies are aimed at determining the occurrence of organic pollutants in soils after irrigation with wastewater.
Figure I.2:Monitoring studies for pollutants of emerging concern in wastewater irrigated soils through-out the world and comparison with the 20 countries using the largest volumes of raw wastewater for agricultural irrigation(Dur`an– `Alvarez and Jim´enez–Cisneros, 2014 [90]).
Part I.2
Irrigation generalities
I.2.1
Irrigation systems
Irrigation systems are generally classified into two categories: gravity irrigation systems and pres-surized irrigation systems (sprinkler and drip irrigation).
All irrigation techniques can be used to distribute treated effluent. The choice of irrigation tech-nique for reuse of treated water essentially depends on several parameters such as performance potential, cost, health impact, technical constraints and efficiency of irrigation.
Irrigation efficiency can refer to the uptake of water in the root zone of a plant but can also refer to how much water is lost when it flows (Van der Kooij et al., 2013[281]). A scheme irrigation efficiency of 50 − 60% is good; 40% is reasonable, while a scheme irrigation efficiency of 20 − 30% is poor (FAO Annex: Irrigation efficiencies, 1989). It can be calculated using the following formula:
ie = ce × ae
100 (I.1)
with
ie : scheme irrigation efficiency (%) ce : conveyance efficiency (%) ae : field application efficiency (%)
Field application efficiency (ae) mainly depends on the irrigation method and the level of farmer discipline. Conveyance efficiency (ce) mainly depends on the length of the canals, the soil type or permeability of the canal banks and the condition of the canals.
PART I.2. IRRIGATION GENERALITIES 31
I.2.1.1 Surface irrigation
Surface irrigation, also called gravity irrigation (figureI.3), is the oldest technique and the one most used in the world. It concerns around 80% of the world’s irrigated area (Pereira et al., 2006[223]). The water is distributed by gravity through a network of channels in the open air from which it infiltrates the ground. The distribution of water is ensured by the topography and infiltration properties of the soil. This technique has low investment costs, very low energy consumption and good adaptation to the distribution of sewage (limitation of the risks of contact by projection, no clogging of irrigation systems). However, it is characterized by low field application efficiency (50% as a world average) and high water losses which make this technique inappropriate in a context of water stress. To avoid these losses and in order to improve the uniformity of distribution, it is recommended to use sprinkler irrigation or micro-irrigation.
Figure I.3:Surface irrigation ( c 2010 Cornell University)
https://nrcca.cals.cornell.edu/soil/CA3/CA0324.php
I.2.1.2 Sprinkler irrigation
Sprinkler irrigation (FigureI.4) refers to techniques designed to artificially reproduce natural rain-fall. After pumping, water is sprayed into the air by sprinklers in the form of a jet and distributed on agricultural plots. The pressure requirements at the inlet of the system consist specially on the sprinkler operating pressure which varies between 1.5 and 5.5 bar. Various devices are used for this type of irriga-tion including the reels system, full coverage sprinkler and center pivot or linear irrigairriga-tion.
This technique is characterized by greater efficiency than surface irrigation, varying between 75 and 95% (Compaor´e, 2006[65]). It requires significantly higher energy consumption and techni-cal skills by the irrigators. In addition, the wind influences the uniformity of water distribution in the plot (Stevenin, 2016[261]).
PART I.2. IRRIGATION GENERALITIES 32
Figure I.4:Sprinkler irrigation (Stevenin 2012[260])
The use of this technique with inadequately treated sewage must be restricted so as to limit drift and aerosols that represent a health risk. Indeed, the aerosols formed by the sprinklers can carry pathogens depending on the speed and wind direction when the water quality is not properly followed. The dispersion of the jets in the atmosphere has been studied by Molle et al., (2012 a)[194]. This study recommended practices adapted to the use of treated wastewater in spray irrigation (restricted access to the land during irrigation, monitoring the wind, selection of sprinklers and operating pressure, etc.) in order to limit the possible drift of aerosols and associated risks of health pollution. Clogging problems at sprinkler emission holes may occur with the use of highly mineralized waters. This risk is lower and easier to observe in sprinkler irrigation than in micro-irrigation.
I.2.1.3 Micro-irrigation
Micro-irrigation, also known as drip irrigation is an irrigation technique characterized by low, frequent and localized water supplies near the crops in the form of drops (Figure I.5). This irrigation method is fundamentally different from those seeking to cover a surface (surface or sprinkler irrigation), and consists of bringing water to plants in small amounts once or several times a day. Water diffuses radially under the effect of capillary forces and vertically under the effect of gravity, in a limited volume of soil in the vicinity of the roots, where the plant draws.
PART I.2. IRRIGATION GENERALITIES 33
Transport and distribution of water are provided either by a single element for irrigation conduits where drippers are integrated (FigureI.6.a) or by two separate elements (conduits and drippers) in the case of using drippers (FigureI.6.b). The material generally used for such pipes is polyethylene.
I.6.a: I.6.b: I.6.c:
Figure I.6: (a) Micro-irrigation with integrated dripper, (b) Micro-irrigation with on-line dripper, (c) Labyrinth of a dripper taken with binocular microscope (source: PReSTI).
Drippers have a low flow rate between 0.5 and 8 `/h under a pressure of 0.5 to 4 bar, depending if we have pressure compensating dripper (PC) or non-pressure compensating (NPC) (see sectionI.2.3). Through the dripper, water follows a complex and more or less long path (0.1 to 1 m), which induces a release of pressure. This pressure drop is generated by the friction of the water along the walls in the case of capillary dripper (uniform circuit), flow regulation is therefore proportional to the length of the capillary and to its inner diameter which is constant. In non-uniform circuit drippers (called baffles or labyrinth) (FigureI.6.c), sudden changes in the direction of water cause turbulence. This effect, added to friction along the walls, can cause pressure drop (Bounoua, 2010[40]).
Compared to other techniques of irrigation, micro-irrigation contributes to realizing water savings by reducing losses which is a real advantage for the development of irrigated agriculture in arid or semi-arid areas. These systems allow delivery with measuring the exact amount of water necessary for the crops, and their efficiency varies between 95% (new, well maintained) and 70% (Compaor´e, 2006[65]). Drip-irrigation appears to be the most suitable technique for irrigation with wastewater since it reduces health risks by avoiding pathogen-dispersion problems by aerosols and minimizes contact of farmers and crops with water (Xanthoulis, 2006[299]). Fertilizers can also be associated with water delivery to improve crop yields through fertigation.
However, the high cost of installation and the drippers’ sensitivity to clogging are the main disad-vantages of using this type of irrigation. Clogging may involve different forms of organic and inorganic suspended materials due to the low section of water passage (on the order of mm2). Moreover, in arid areas limiting watering can lead to salinity problems difficult to solve without the possibility of leaching by rain. Standards of wastewater used in irrigation are provided in AnnexA.1.
PART I.2. IRRIGATION GENERALITIES 34
Table I.4:Comparison of different irrigation techniques for use with treated wastewater Irrigation Techniques Advantages Disadvantages Surface irrigation - Low investment costs - Low efficiency
- Low energy consumption - High water losses - No projection risks - Reduced automation Sprinkler irrigation - Better efficiency - Average investment cost
- Robustness - Energy dependence - Average distribution rate (5 to 20
mm/h)
- Aerosols - Automation
Micro-irrigation - Reduced water losses - High investment cost - No germs-dispersion problems due
to aerosol
- Distributors sensitivity to clogging inducing low uniformity before clog-ging
- Easy automation
I.2.2
Clogging problems in micro-irrigation systems
The clogging of drippers in drip irrigation systems is the major cause of reduced performance at plot level (reduction in flow rate, poor distribution of water) (Pitts et al., 1990[230]) and thus determines the life duration of the distribution system. Clogging can be physical (accumulation of suspended solids), organic (growth of algae and biofilm) and / or chemical (precipitation of chemical elements) and can be observed simultaneously. The clogging of drippers is often caused by a combination of different factors depending on the physicochemical quality of irrigation water, the hydrodynamic conditions, etc. where interactions between different factors play a major role.
I.2.2.1 Physical clogging
Physical clogging (or mineral clogging) is caused by suspended mineral particles in the water. It consists of sand particles, silts and clays ranging in diameter between 2 and 200 µm. The elements below 80 µm are not retained by the filters used in micro-irrigation.
They can act on the obstruction of the drippers in two different ways:
• Obstruction: when particle or aggregate dimensions are greater than the water section passage of the dripper (case of sand particles).
• Slow clogging or silting: When finer particles gradually settle in places where the water flow rate is low (Xanthoulis, 2006[299]). This attachment point serves as support for the next particles and disturbs the flow within the dripper. Deposits are located either in the labyrinth, or at the level of
PART I.2. IRRIGATION GENERALITIES 35
the input grid designed to prevent large particles from entering the labyrinth (FigureI.7).
Furthermore, clay particles (less than 2 µm in diameter) can aggregate downstream of the filtering system and cause clogging (Pitts et al., 1990[230]; Bounoua, 2010[40]).
Figure I.7:Physical clogging observed in the labyrinth (Bounoua, 2010[40])
I.2.2.2 Chemical clogging
Clogging of drippers can also be caused by the chemical elements contained in the water (Fig-ureI.8). These chemical elements can be inorganic solutes as well as acids along with hydroxides of calcium, magnesium, sodium and potassium (Ricci, 1952[243]). The main inorganic solutes are car-bonates, bicarcar-bonates, sulphates and chlorides of calcium, magnesium, sodium and potassium (Kemp, 1970[149]). For acids, the most important parameter is carbonic acid, but we can also have sulfuric and hydrochloric acids (Ricci, 1952[243]). These solutes are present in dissolved form and can precipitate as a result of reactions that can be generated by a change of temperature or pH (Xanthoulis, 2006[299]). The pH change is due to the behavior of the carbon system which is intimately involved in the control of pH as well as in the control of the precipitation of chemical elements. Temperature is also an important factor (MacAdam and Parsons, 2004[183]; Muryanto et al., 2014[202]). Lamm et al., 2007[162] have indicated that the solubility of calcium carbonate (CaCO3) is related to the temperature and decreases as
the temperature increases.
Figure I.8: Chemical clogging observed at the output of a conduct orifice (example of clogging by pre-cipitation of CaCO3) (source: PReSTI)
PART I.2. IRRIGATION GENERALITIES 36
The most commonly encountered precipitates in irrigation equipment are calcium and magnesium carbonates, phosphates, sulfates, and ion precipitates in the ferric form (Nakayama et Bucks, 1986[206]; Hills and al., 1989[128]; Burt and Styles, 1994[48]; Burt et al., 1995[49]; Levy et al., 2011[168]). Calcium carbonate is well recognized as the major element in the chemical clogging of irrigation systems (Schwankel and Prichard, 1990[252]). In general, the contact of water which is rich in carbon dioxide and calcium with the open air, in case of open channel and storage, causes an increase in pH due to the loss of carbon dioxide which induces the precipitation of calcium carbonate (Gal et al., 2002[110]). Fertigation (distribution via irrigation of nutrients such as phosphorus-containing compounds, liquid ammonia, some trace elements [zinc, copper, manganese]) favor the precipitation of solutes (Pitts et al., 1990[230]) and accelerate the precipitation process, resulting in clogging.
I.2.2.3 Biological clogging
Biological clogging is driven by two types of organic matter:
- Inert or degraded organic material (grass, leaves, other microorganisms, etc.)
- Living organic matter that is formed by algae spores, algae themselves, colonies of bacteria as well as fungi or even microscopic shells that grow in the pipes where they find nutrients needed for growth.
The growth of algae requires light, which means it takes place mainly at the output of the orifices (Figure
I.9.a). Biofilms generally grow on the walls of pipes and labyrinth drippers (FigureI.9.b).
I.9.a: I.9.b:
Figure I.9:biological clogging (a) by algae at the output of the orifice of the dripper (b) by biofilm in the labyrinth of drippers (source: PReSTI).
According to Magesan et al., (2000)[184], the increase of C/N ratio in wastewater is the cause of this phenomenon as it promotes increased microbial biomass and nematode population. However, these
PART I.2. IRRIGATION GENERALITIES 37
same authors state that biological clogging occurs only in the case of C/N > 50, whereas the majority of domestic treated wastewater has a C/N ratio of about 2.5.
Biofilm development in irrigation systems is a serious source of clogging. Indeed, its presence enhances the adhesion of physical and chemical deposits such as calcium carbonate or particles that are suspended in the irrigation water (Gilbert et al., 1981[118]; Adin and Sacks, 1991[7]) which accentuates the clogging of irrigation systems. In addition, the precipitation and dissolution of minerals can be used for bacterial growth by significantly modifying the porous media (Perez-Paricio, 2000[224]).
Also, the practice of fertigation (input of nutrient through the drip irrigation system) can con-tribute to clogging by promoting the development of some microorganisms due to an additional intake of nutrient.
I.2.3
Types of drippers
Drippers are classified according to their incorporation in the lateral (point source and line source drippers), flow rate (PC and NPC drippers), form of pressure dissipation, and construction (long-path, tortuous path, short-path, orifice and vortex drippers) (Keller and Bliesner, 1990[150]; Enciso et al., 2005[95]). A basic component of dripper characteristics is the sensitivity of their flow to pressure changes. Water pressure is measured in bars, and most are designed to work best at 1.5 to 2.0 bars of pressure. There are two basic categories of drippers: Self-regulating or PC for pressure compensating and not self-regulating or NPC for non-pressure compensating.
Pressure compensating drippers or PC are designed to discharge water at a very uniform rate un-der a wide range of water pressures (same flow at 3.0 bars as at 1.0 bar). The pressure head exponent (Eq.I.3) must be less than 0.2 and close to 0. The flow rate is obtained by a diaphragm which, depending on the pressure, deforms and closes more or less the water passage orifice (Tiercelin, 1998[275]).
Non-pressure compensating drippers or NPC are also designed to discharge water at a uniform rate, but the water pressure needs to remain relatively constant or the discharge will vary (Stryker, 2001[265]). Depending on the flow inside the dripper, the value of x (Eq.I.3) should approach 0.5 (Cuenca, 1989[72]).
The relationship between the discharge and pressure can be described in the following equation (Karmeli, 1977[143]):
q = KdHx (I.2)
where q is the dripper discharge; Kd is the constant of proportionality that characterizes each
dripper; H is the working pressure head at the dripper; and x is the dripper discharge exponent that is resulting from the flow regime.
PART I.2. IRRIGATION GENERALITIES 38
To determine K and x, the discharges (q1, q2) at two different operating pressure heads (H1,H2)
must be known. The exponent x may be determined by measuring the slope of a log-plot of H versus q that is, x = log q1 q2 logH1 H2 (I.3) The value of x characterizes the flow regime and discharge versus pressure relationship of the dripper. The lower the value of x, the less discharge will be affected by pressure variations (FigureI.10). In fully turbulent flow, x = 0.5 and in laminar flow, x = 1.0. Non-compensating orifice and nozzle drippers are always fully turbulent with x = 0.5, and x is effectively zero for fully pressure compensating drippers. However, the exponent of long-path drippers may range anywhere between 0.5 and 1.0.
Figure I.10:Discharge variations resulting from pressure changes for dripper having different discharge exponents (Karmeli, 1977[143]).
The calculation of this curve is used to define the sensitivity of variation of the flow to pressure variations. This relationship intervenes in the calculation of maximum ramp length. According to the parameter x, the same pressure change will not result in the same flow change.
In this work, the NPC dripper will be used because it is the most commercialized and widely used in agricultural irrigation.
I.2.4
Hydrodynamics and flow behavior of drippers
In order to understand the fouling phenomena, various studies have focused on analyzing ex-perimentally and numerically the flow along the dripper channel. Modeling works helped to further
PART I.2. IRRIGATION GENERALITIES 39
characterize the hydrodynamics of these drippers and flow within the labyrinth and to estimate the ve-locity ranges and shear that may influence the agglomeration mechanisms. This data will be useful later as shear stress is a parameter that influences the growth and fragmentation of aggregates. Wei et al., (2006)[288] used the method of computational fluid dynamics (CFD) to calculate the distribution of pressure and velocity of the flow, and to calculate the relationship between pressure and discharge rate for channels with three different shapes: triangular, rectangular, and trapezoidal (FigureI.11). According to CFD simulations, the changes in pressure gradients occur mainly at the corner of the channels in each of the three labyrinth channels.
I.11.a: I.11.b: I.11.c:
Figure I.11:Pressure (mH2O) distributions of the flow in partial channels in rectangular (A), trapezoidal
(B) and triangular (C) shaped channels (Wei et al., 2006[288]).
When the flow arrives at the corner, the change in the direction of flow results in a large loss of local pressure, which is the main cause of hydraulic energy dissipation. Therefore, the pressure loss at the corner of the channel will finally determine the degree of hydraulic energy dissipation. The more the pressure varies, the greater the pressure loss will be. The pressure loss in the triangular dripper channels is higher than in trapezoidal drippers which, in turn, is higher than in rectangular drippers (Wei et al., 2006[288]). Consequently, a greater dissipation per unit length occurs in the triangular channel than in the rectangular or trapezoidal channels. In a labyrinth, the flow is divided into two parts: a main flow with a high velocity (red, orange and yellow colors) and a recirculation zone with a low velocity (blue color) (FigureI.12).
PART I.2. IRRIGATION GENERALITIES 40
I.12.a: I.12.b: I.12.c:
Figure I.12: Velocity (m/s) distributions of the flow in partial channels in rectangular (A), trapezoidal (B) and triangular (C) shaped channels (Wei et al., 2006[288]).
The distributions of the velocities on the x–y plane shown in FigureI.12clearly present the flow state of the water in the three channels. The shapes of the flow in the three channels present the same behavior. An obvious turning appears at the corner of the channel, which makes the flow move along an S-shaped path. In addition, some obvious swirl zones appear in the channels. These swirl zones will increase the dissipation of kinetic energy. The kinetic energy of the flow directly affects the efficiency of hydraulic energy dissipation, and the velocity of the flow along the length direction determines the dis-charge. Consequently, comparing the distributions of velocity along the flow path in the three channels, the rectangular channel has the highest discharge rate per unit of pressure.
I.2.5
Parameters influencing clogging in micro-irrigation
Dripper clogging has become the key obstacle to the development of drip irrigation technology. Several factors can influence the clogging of drippers, like hydraulic behavior which is affected by drip-per channel structure (Adin Sacks, 1991[7]; Taylor et al., 1995[273]) and water quality especially when using effluents (Bucks et al., 1979[45]; Adin Sacks, 1987[5]; Ravina et al., 1992[240]; Nakayama et al., 2007[208]). Other parameters found in the literature can affect the clogging of micro-irrigation systems; we can cite the effect of flushing frequency (Lamm Camp, 2007[162]; Puig-Bargues et al., 2010[235]), the location of drippers along the laterals (Capra Scicolone, 1998[52]; Duran-Ros et al., 2009[89]) and the effect of chemical oxidants (Rav-acha et al., 1995[241]). In this work, we are especially interested in studying water quality parameters and dripper hydraulic behavior effects on clogging.
PART I.2. IRRIGATION GENERALITIES 41
I.2.5.1 Geometry of drippers and hydraulic behavior
Dripper design can help preclude clogging. Pressure compensating drippers, integrated drippers (El-Berry et al., 2003[92]), labyrinth drippers (Capra Scicolone, 2004[53]) and high flow drippers (Rav-ina et al., 1992[240]) have been found to be the most resistant to clogging. Adin and Sacks, (1991)[7] conducted farmland experiments to study the clogging problem of drippers in wastewater irrigation sys-tems. They found that clogging was closely related to the channel structure and suggested that channel design be improved. Shortening and widening the flow path, and rounding the straight edges on the protruding teeth are possible solutions to reduce dripper clogging . Wu et al., (2004)[297] carried out an investigation on the subsurface drip irrigation system which had been run for 8 years. They attributed dripper clogging to the attached granules and suggested optimizing the channel structure to solve this problem.
I.2.5.2 Water quality
Experiments were conducted with different qualities of treated wastewater to test the sensitiv-ity of the different components of irrigation systems to clogging (Adin and Sacks, 1991[7]; Carpa and Scicolone, 2004[53] and 2005[54]; Liu et al., 2009[177]). It has been demonstrated that biofilm devel-opment and its role in dripper clogging is directly related to the quality of irrigation water. These waters are rich in suspended solids, dissolved chemical elements and nutrients.
When such water is used in drip irrigation systems, there is a strong potential for biofilm devel-opment. This phenomenon is observed primarily on filters, and then on drippers which will risk their clogging (Gilbert et al., 1979[117]; Bucks and Nakayama, 1984[47]; Adin and Alon, 1986[4]; Adin et al., 1989[6]). Clogging in irrigation systems is often worsened by water temperature changes because the solubility of some components depends on it . Calcium, magnesium and carbonates precipitate in pipes and drippers when temperature is high and pH is above 7.2. The solubility of CaCO3is inversely
proportional to the temperature (Hills et al., 1989[128]). But if increasing temperature promotes precip-itation, once the precipitate is formed, decreasing temperature does not dissolve the layer of CaCO3.
These precipitates due to calcium carbonate accumulate in the narrow path of drippers and ac-celerate clogging. We should know that in surface irrigation systems, where pipes are black and are directly exposed to the sun, water temperature can reach 50◦C in summer (Gamri et al., 2016[113]). The formation of phosphate as a precipitate depends on several factors (Boman, 1990[39]) such as pH, temperature and concentration. Ca2+and PO43 –form several combinations; three of them (hypo-,
meta-and pyro-phosphate) are insoluble in water. Components that occur naturally as blushite (CaPO4,2 H2O)
PART I.2. IRRIGATION GENERALITIES 42
instance, these parameters can affect the growth of bacteria, which tends to increase the risk of clogging. Nakayama and Bucks, (1980)[204] established a grid to link water quality and clogging risks:
Table I.5: The different parameters of dripper clogging and their degrees of risk. (Data compilation from the following authors: Nakayama and Bucks, 1980[204]; Ayers and Westcot, 1985[22]; Pitts et al., 1990[230]; Couture, 2004[71])
Degree of risk
Parameter Symbol Unit Low Average High
Suspended solids ppm < 50 50 - 100 > 100
pH pH 1 to 14 < 7.0 7.8 – 8.0 > 8.0
Conductivity ECw dS/m < 0.75 0.75 – 3.0 > 3.0
Total dissolved solids TDS mg/l < 500 500 – 2000 > 2000
Sodium Adsorption ratio SAR mg/l < 3 3 - 9 > 9
Residual Sodium Carbonate RSC mg/l < 1.24 1.25 – 2.5 > 2.5
Alkalinity mg/l < 120 120 – 200 > 200 Bacterial population ppm < 10000 10000 – 50000 > 50000 Bicarbonate HCO3- mg/l < 90 90 – 520 > 520 Chlorine Cl- mg/l < 142 142 – 355 > 355 Boron B mg/l < 0.5 0.5 – 2.0 > 2.0 Nitrate- Nitrogen NO3-N mg/l < 5 5 – 30 > 30 Iron Fe mg/l < 0.1 0.1 – 1.5 > 1.5 Hydrogen sulfide H2S mg/l < 0.2 0.2 – 2.0 > 2.0 Manganese Mn2+ mg/l < 0.1 0.1 – 1.5 > 1.5
The earlier the clogging of drippers is detected, the easier it is to implement cleaning methods such as acid or chlorine injection. To better understand the mechanisms of dripper clogging, it is re-quired to monitor the evolution of the pressure and flow (in filters and dripper lines) and to study the hydrodynamics of the drippers.
Part I.3
Biofilm
The most common mode of growth for microorganisms is in surface associated communities called biofilms (Costerton, 1978[66]; Metcalf and Eddy, 1991[193]; Sutherland, 2001[268]; Stoodley et al., 2002[264]; Syron and Casy, 2007[269]). Many types of microorganisms can be preset in wastew-ater, and they have been identified as a major contributor to dripper clogging in drip irrigation systems distributing reclaimed wastewater (Yan et al., 2009[301]).
I.3.1
Definition of Biofilm
Biofilms are an association of microorganisms adhering to each other, which grow on any solid-liquid interface (cellular tissues, marine medium, water pipes, medical and industrial equipment, etc.) (Donlan, 2002[83]; Costerton, 2004[69]). Contrary to what their name suggests, biofilms do not form a continuous film of bacteria; their structure is indeed very complex and heterogeneous, and contains microcolonies embedded in a polymeric extracellular matrix which they secrete (Characklis, 1973[58]). Their composition and nature vary depending on the environment and the conditions under which they are formed (Friese et al., 1997[107]; Eberl et al., 2000[91]). These aggregations of microorganisms are often separated by channels and pores allowing water flow, ions and nutrients (Clutterbuck, 2007[64]). The channels also serve to remove debris and metabolites (Fletcher, 1979[102]; Lewandowski, 2000[169]; Ivleva et al., 2010[137]). FigureI.13shows some examples of biofilms observed with different micro-scopic techniques. More details about the composition and structure of the biofilm are found in Annex
A.2.
PART I.3. BIOFILM 45
I.3.2
Advantages and disadvantage of biofilms development
Biofilms are commonly used for the treatment of wastewater in fixed cultures processes (Lazarova and Manem, 1995[164]; Gebara, 1999[115]; Nicolella et al., 2000[211]). They play a major role as bio-physico-chemical reactors in the environment. They are involved in controlling the organic matter concentration and metal contaminants in natural and anthropogenic ecosystems (Battin et al., 2003[29]; Horn et al., 2003[131]; El Samrani et al., 2004[94]; Houhou et al., 2009[132]).
Figure I.13: Images of mixed strain biofilms using three different microscopic techniques. a) Phase contrast micrograph, b) FISH/EPI-fluorescent micrograph, c) SEM image of 3D biofilm. (Andersson, 2009[15]).
The presence of biofilm is undesirable in certain applications where their development can lead to technical, economic and / or health problems. In irrigation systems, biofilm development causes a pressure loss in the pipes by increasing the water friction force (Picologlou et al., 1980[227]). In their research, Li et al., (2012)[171] examined the development of biofilm in micro-irrigation system pipes used with treated water from two different treatment processes. The detachments of biofilm fragments from pipes are deposited in drippers’ labyrinths, causing their obstruction. These have low flow section (to the millimeter) and are thus very susceptible to clogging (Gamri et al., 2013[111]). In addition, the biofilm surface is highly adsorbent and the suspended elements in water (particles of clay, sand or other elements) can easily adhere, resulting gradually in the total obstruction of the system (Gilbert et al., 1981[118]).
I.3.3
The different stages of biofilm development
The development can be described by a series of steps influenced by various factors (see para-graphI.3.4). The different steps have been extensively studied and defined (Characklis, 1981[59]; Van Loosdrecht et al., 1989[179]; Costerton, 1999[68]; Gauthier, 2002[114]; Liu and Tay, 2002[176]). The transport of bacteria to the wall, their adherence, their growth and maturation phases and their detachment
PART I.3. BIOFILM 46
phenomena are summarized in FigureI.14.
Figure I.14: Stages of biofilm development (1) initial attachment; (2) production of exopolysaccharide (EPS) by bacteria; (3) replication of early colonizers; (4) maturation; (5) dispersion (Sehar and Naz, 2016[253]).
I.3.3.1 The transport of bacteria
The adhesion of bacteria to the surface requires a rapprochement which is provided by transporting them from the fluid to the surface. In a hydrodynamic system, the transfer of bacteria to the surface will be provided by both convection and diffusion (Rijnaarts, 1994[244]; Ginn et al., 2002[119]; Khalizadeh, 2009[152]). This transfer will be faster and influenced by the speed and the flow nature. In this case, the higher is the fluid velocity the higher will be the transport by convection. The nutrient concentration near the surface of the biofilm promotes its growth (Mueller, 1996[200]; Busscher and Van der Mei, 2006[50]).
I.3.3.2 Adhesion
The adsorption of an organic monolayer occurs several minutes after the contacting with the liq-uid medium. The adhesion of bacteria to the support depends on the properties of the support (see paragraphI.3.4.2) and on the bacteria cell wall properties (hydrophilic / hydrophobic character, charge, physical and electrostatic forces and bonds (Van Loosdercht et al., 1987[178] and 1989[179]; Costerton, 1999[68]; Gauthier, 2002[114]) that vary depending on the bacterial species and environmental factors (see paragraph I.3.4.1) (Characklis, 1981[59]; An and Friedman, 1997[14]; Beloin, 2008[31]). EPS production (Skillman et al., 1999[257]) and the presence of attachment and motility proteins (Goller, 2008[122]) are important factors for bacterial adhesion. More details about EPS are found in AnnexA.3.
PART I.3. BIOFILM 47
I.3.3.3 Growth phase and maturation
Once attached to the surface, the microorganisms begin to multiply and produce the necessary exopolymers to form the skeleton of the biofilm (Costerton, 1999[68]; Gauthier, 2002[114]; Khalizadeh, 2009[152]). These EPS will form on the surface, and complexes will ensure the adsorption of other bacteria which allows increasing the thickness of the biofilm. The biofilm begins to grow by division and bacteria multiplication (Lazarova and Manem, 1995[164]; Costerton, 1999[68]; Andersson, 2009[15]). At this stage, bacteria multiplication and biofilm growth are strongly linked to the environmental factors (see paragraphI.3.4.1). The maximum thickness of the biofilm is reached during the maturation phase (Clutterbuck, 2007[64]). This phase is characterized by an equilibrium which is created between the biomass that grows in the presence of substrate (see paragraphI.3.4.1) and the one which is detached from the biofilm through the action of the hydrodynamic forces (see paragraph I.3.4.1). The detached cells are conveyed by the flow and can colonize the system again.
I.3.3.4 The detachment
When the biofilm reaches the stage of maturity, nutrients lack, biofilm age, the amount of biomass fixed, physical, chemical, and biological stresses and hydrodynamic conditions plays a very important role in the structure, density and thickness of the biofilm, and subsequently in its activity and the transfer phenomena (Lazarova and Manem, 1995[164]; W¨asche et al., 2002[287]). These factors are respon-sible for the biofilms detachment and re-dispersion into the environment (Abrahamson et al., 1996[2]; Andersson, 2009[15]; Mahfoud et al., 2009[185]) favoring the colonization of new ecological niches and therefore the formation of other biofilms (Clutterbuck, 2007[64]). The detachment mechanisms de-scribed in the literature are erosion, abrasion and sloughing. Erosion is a mechanism of detaching small parts of the biofilm. It depends essentially on the increase of the shear stress (see paragraphI.3.4.1) and / or the thickness of the biofilm results in an increase in erosion rates (Trulear and Characklis, 1982[278]; Telgmann et al., 2004[274]). Similarly, abrasion causes the detachment of small parts of the biofilm. However, it is generated by the collision of solid particles with the biofilm (Gjaltema et al., 1997[120]; Derlon et al., 2008[78]). Unlike the first two mechanisms, sloughing causes the detachment of large aggregates (Telgmann et al., 2004[274]) which increases the heterogeneity of the biofilm. The limita-tions of nutrients and oxygen can be at the origin of this process (Applegate et al., 1991[20]; Hunt et al., 2004[134]).
PART I.3. BIOFILM 48
I.3.4
Factors influencing the different stages of biofilm development in
micro-irrigation systems
I.3.4.1 Environmental factors
The formation and dispersion of a biofilm depends, according to bacteria, on different environ-mental factors (temperature, pH, substrate availability, hydrodynamic conditions) (Fletcher, 1988[103]; Donlan, 2002[83]). Some bacteria can adapt to different environments by genetic modifications (Clut-terbuck, 2007[64]). Others are influenced by stressful environmental conditions (high concentrations of salts, high temperatures, extreme variations of pH) that decrease the potential of bacterial adhesion to surfaces (Goller, 2008[122]).
a) Temperature Drip-irrigation is widely used in arid and semi-arid regions where the temperature is generally very high especially during the day (Qin et al., 2005[236]; Verheye, 2009[284]). Measures car-ried out in the irrigation material tests and research laboratory (Irstea Aix en Provence) have shown that the water temperature can exceed 50◦C in polyethylene pipes during the summer period in the absence of flow (Gamri, 2013[111]). Temperature strongly influences the development of biofilm as it affects the metabolic and enzymatic activity of bacteria as well as their surface properties (Van Loosdrecht et al., 1990[180]; Goller, 2008[122]).
In the work of Qian et al., (2017)[237], the effect of temperature was investigated on biofilm formation in micro-irrigation devices. Two series of experiments were carried out, one at ambient tem-perature and the second at daily temtem-perature cycle. Daily temtem-perature cycle was varied from 20 to 50◦C. The increase in temperature had a negative impact on the biofilm, consequently greatly reducing its development. Biofilm volumetric coverage for ambient temperature at day 30 of cultivation was 40% versus 10% for the same time but under daily temperature variations. According to Pirt, (1985)[229] the optimum temperature of 45◦C for the biofilm development should not be exceeded. When this temper-ature is exceeded, enzymes can be deactivated and surface electrical properties changed (Rogers et al., 1994[247]; Briandet et al., 1999[44]). This will reduce or delay the formation and the growth of biofilm in pipes and drippers.
b) pH Many irrigation water sources are alkaline with pH values between 7.2 and 8.5 due to a high content of calcium, magnesium and bicarbonates (hard waters) (Mengel, 1994[191]). At the same time, phosphate and nitrogen addition by fertigation can lower the water pH to 6 - 6.5 (Imas and Cohen, 2009[136]). For this reason, pH variations can be observed and this may influence the adhesion of
![Figure I.1: Map showing areas of the world with water scarcity. Map by Mesfin M. Mekonnen and Arjen Y, 2016[189], courtesy Science Advances](https://thumb-eu.123doks.com/thumbv2/123doknet/13532480.417959/26.892.172.737.225.437/figure-showing-scarcity-mesfin-mekonnen-courtesy-science-advances.webp)
![Figure I.10: Discharge variations resulting from pressure changes for dripper having different discharge exponents (Karmeli, 1977[143]).](https://thumb-eu.123doks.com/thumbv2/123doknet/13532480.417959/39.892.289.614.452.754/discharge-variations-resulting-pressure-different-discharge-exponents-karmeli.webp)
![Figure I.16: X-ray diffraction of the fouling collected from irrigation pipes (Hadfi et al., 2011[125]).](https://thumb-eu.123doks.com/thumbv2/123doknet/13532480.417959/58.892.230.666.121.328/figure-ray-diffraction-fouling-collected-irrigation-pipes-hadfi.webp)