HAL Id: halshs-01384725
https://halshs.archives-ouvertes.fr/halshs-01384725
Submitted on 20 Oct 2016
HAL is a multi-disciplinary open access
archive for the deposit and dissemination of sci-entific research documents, whether they are pub-lished or not. The documents may come from teaching and research institutions in France or abroad, or from public or private research centers.
L’archive ouverte pluridisciplinaire HAL, est destinée au dépôt et à la diffusion de documents scientifiques de niveau recherche, publiés ou non, émanant des établissements d’enseignement et de recherche français ou étrangers, des laboratoires publics ou privés.
Does Urbanization Reduce Rural Poverty? Evidence
from Vietnam
Adel Ben Youssef, Mohamed El Hedi Arouri, Cuong Nguyen-Viet
To cite this version:
Adel Ben Youssef, Mohamed El Hedi Arouri, Cuong Nguyen-Viet. Does Urbanization Reduce Rural Poverty? Evidence from Vietnam . Economic Modelling, Elsevier, 2016, 60. �halshs-01384725�
1
Does Urbanization Reduce Rural Poverty?
Evidence from Vietnam
1Abstract
This paper contributes to the urbanization-poverty nexus by assessing the effect of urbanization on income, expenditure, and poverty in rural households in Vietnam, using data from household surveys. We find that the urbanization process stimulates the transition from farm to non-farm activities in rural areas. More specifically, urbanization tends to reduce farm income and increase wages and non-farm income in rural households. This suggests that total income and consumption expenditure of rural households are more likely to increase with urbanization. Finally, we find also that urbanization helps to decrease the expenditure poverty rate of rural households, albeit by a small magnitude.
Keywords: urbanization, per capita income, per capita expenditure, rural poverty, impact evaluation, household surveys, Vietnam, Asia.
JEL Classification: O18, I30, R11.
1 We acknowledge very helpful comments from three reviewers and the chief editor of Economic
2 1. Introduction
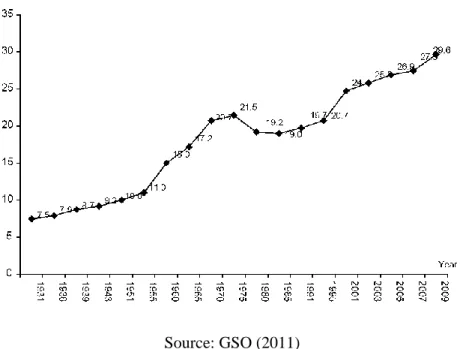
This paper contributes to the literature by investigating the urbanization-poverty nexus in rural developing economies. Previous research suggests urbanization is both a result and a cause of economic development (Gallup et al., 1999).The proportion of the world's urban population increased from 29.4 percent in 1950 to around 52.1 percent in 2011 (United Nations, 2012). While 77.7 percent of the populations of developed countries live in urban areas, urbanization levels are low in developing countries despite growing from 17.6 percent of the population in 1950 to 46.5 percent in 2011.2 Moreover, according to UN projections, the world's urban population is expected to increase to72 percent by 2050, from 3.6 billion in 2011 to 6.3 billion in 2050, with 5.12 billion of this urban population living in a developing country.
In theory, the geographical agglomeration of people and firms can lead to lower production costs, and higher productivity and economic growth (Krugman, 1991; Fujita et al., 1999; Quigley, 2008). Also, urbanization can help to reduce poverty through its impact on economic growth which is a prerequisite for poverty reduction (Demery and Squire, 1995; Dollar and Kraay, 2000). Urban areas tend to be less poor, and as a result, poverty levels tend to decrease as the share of urban population increases (Ravallion et al., 2007). However, in practice the impact of urbanization on economic growth depends on the process and nature of urbanization (Bloom et al., 2008; Basuand Mallick, 2008; Kumar et al., 2009). In Asia urbanization has led to rapid economic growth but there has been no similar impact in Africa (Ravallion et al., 2007). Despite the large literature on the
2
There are economic theories and empirical studies supporting an inverted U-shaped relationship where urbanization first increases to a peak, then decreases with economic development (see Henderson (2003) for a review).
3
relationship between urbanization and growth (Bertinelli and Black, 2004), little is known about the effect of urbanization on rural poverty, and the channels through which urbanization can influence rural poverty.
There are several channels through which urbanization can be expected to affect income expenditure and poverty among rural households (Ravallion et al., 2007; Cali and Menon, 2013; Martinez-Vazquez et al., 2009, Mallick, 2014, Banerjee and Duflo, 2007). First, urbanization often involves migration from a rural to an urban area. Workers tend to move from the agricultural sector and rural areas to industry sectors and urban areas (Lewis, 1954; Harris and Todaro, 1970). Migration is expected to increase the incomes and consumption of both the migrants and the households they leave behind which benefit from remittances (Stark and Taylor, 1991; Stark, 1991;McKenzie and Sasin, 2007).Remittances can be used also to invest in human capital building or physical and social assets allowing rural households to increase agricultural productivity or start non-farm businesses.However, the results from empirical studies on the impact of migration on the households left behind are rather mixed. Several studies show a positive impact of remittances on household income and poverty reduction (e.g., Adams and Page, 2005; Acosta et al., 2007, Bouiyouret al., 2016) while others find no poverty reduction effects of migration (Yang, 2008; Azam and Gubert, 2006; Nguyen et al., 2013). Moreover, during times of economic crisis, rural to urban migration, and the remittances sent to rural areas, decrease due to higher unemployment in urban areas.
Second, urban development can have a positive impact on rural revenues by increasing demand for rural products (Tacoli, 1998; Otsuka, 2007; Cali and Menon, 2013; Haggblade et al., 2010). High levels of economic growth and population density in urban
4
areas create higher demand for commodities from rural areas, especially agricultural and labor-intensive commodities. Transportation and infrastructure tend to improve overtime which reduces the cost of transporting commodities from rural households to urban markets. Otsuka (2007) concludes that in developing Asian countries, urban-to-rural subcontracting for labor-intensive export manufactures increases due to reduced transport fees.
Third, urbanization can increase rural households' nonfarm income, and especially for households located close to a city (Berdegue et al., 2001; Fafchamps and Shilpi, 2005; Deichmann et al., 2009).Firms are agglomerated in cities, and attract both urban and also nearby rural workers. As a result, urbanization can increase the wages of rural workers. In addition, migration based on the wage differentials between urban and rural areas can reduce the rural labor supply, thereby increasing rural wages.
Finally, rural households’ living standards can rise as a result of urbanization spillover effects (Bairoch, 1988; Williamson, 1990; Allen, 2009). As well as migration, other interactions between urban and rural areas can have positive effects on human capital formation in rural areas through transfers of information and advanced knowledge about production-related skills and technology (McKenzie and Sasin, 2007). Also, urbanization plays a vital role in the economic and social fabric of both urban and nearby rural areas by offering opportunities for education, health services and environmental facilities.Education capital determines the ability of rural inhabitants to adopt technologies; health capital can influence economic activity and poverty reduction directly, through the impact on labor productivity.
5
However, there are reasons to think that urbanization does not lead necessarily to higher incomes for rural households. For instance, a direct consequence of rural to urban migration is the reduction in the labor supply of rural households, especially in the labor-intensive sector. In the short-run, migrants are unable to send remittances and their family members can suffer a decrease in income. In the long-run, rural to urban migration can prevent these households from engagement in high-return, labor intensive activities. Moreover, remittances can create disincentives to work resulting in a moral hazard problem (Farrington and Slater, 2006). Several studies show that migration is likely to affect the labor decisions of other members of the migrant’s rural household, or can increase their reservation wage; receiving remittances from migrants can have a negative effect on labor market participation for non-migrants in rural areas (Kim, 2007; Grigorian and Melkonyan, 2011).
Thus, through rural to urban migration, remittances, labor supply, the impact on the demand for agricultural products, and technology transfer, urbanization can affect production activities including the farm and non-farm activities of rural households, and can affect the incomes and poverty of rural households. Depending on the relative magnitude of the different channels of the effect of urbanization, its impact on rural households’ poverty is theoretically uncertain and may be negative or positive, especially in the context of rapid urbanization in developing economies.
Despite the importance of the urbanization-poverty nexus for developing countries, very few empirical studies investigate the effect of urbanization on poverty reduction, and
6
in particular, on rural poverty reduction. Ravallion et al. (2007) find that urbanization has a positive effect on poverty reduction but that the effect varies across regions.Martinez-Vazquez et al. (2009) also using cross-country datafind a U-shaped relation between urbanization levels and poverty indexes. This implies that the effect of urbanization on poverty is not necessarily linear and positive for all countries. To our knowledge, only Cali and Menon (2013) explicitly examine the effect of urbanization on rural poverty. These authors investigate thecase of rural poverty in India and find that urbanization helps to reduce rural poverty thanks mostly to positive spillovers from urbanization rather than migration of the rural poor to urban areas.A related study is Mallick (2014), which shows that during the shrinking process of the agricultural sector, poor laborers move from rural to urban areas, and it helps to reduce poverty in rural areas in India.
In this study, we contribute to this research area by examining the effect of urbanization on the income, expenditure and poverty of rural households in Vietnam. Vietnam is an interesting case for at least three main reasons. Firstly, Vietnam is a post-communist country which has achieved high economic growth and remarkable poverty reduction following economic reforms in the 1980s. The poverty rate dropped dramatically from 58 percent in 1993 to 37 percent in 1998, and continued to decrease to 20 percent and 15 percent in 2004 and 2008respectively.3 Secondly, Vietnam remains a rural country with 70 percent of its population living in a rural area, and poverty is a rural phenomenon in Vietnam with around 97 percent of the country's poor living in a rural
7
area.4 Vietnam's urbanization level is very similar to that of other developing countries. However, in the first decade of 2000 the urbanization process in Vietnam increased quite remarkably. The share of urban population increased from around 24 percent in 2001 to 30 percent in 2009. Thirdly, although there are several studies of urbanization and rural-urban migration in Vietnam (e.g., GSO, 2011; World Bank, 2011), there are no quantitative studies that look at the effect of urbanization on rural households' income and expenditure. Whether the urbanization process has contributed to rural poverty reduction in Vietnam remains unknown.
Using panel data from the 2002, 2004, 2006, and 2008Vietnam Household Living Standard Surveys (VHLSS) we show that urbanization tends to increase landlessness among rural households, and reduces their farm income. However, households living in provinces with high levels of urbanization are more likely to have higher wage and non-farm incomes. For these households, the increase in non-non-farm income is greater than the loss of farm income, and as a result, rural households' total income and expenditure on consumption tend to increase with urbanization. We propose a simple method to measure the marginal effect of urbanization on poverty rates; we find that in Vietnam urbanization has led to a decrease in the poverty rate. Although our empirical analysis focuses on Vietnam, we believe our results are significant for a wider group of emerging and developing economies with high urbanization rates but also high rural poverty rates.
4 Rural households tend to have lower education levels, larger household size, and a larger share of farm income compared to urban households. In 2008 the poverty rates in urban and rural areas were 3.3% and 18.7% respectively. Also in 2008, the average per capita expenditure of urban households was nearly twice that of rural households.
8
This paper is structured in six sections. Section 2 presents the data sets used in the study; section 3 provides an overview of the urbanization process and rural poverty in Vietnam. Sections 4 and 5 describe the method, and present the results of the effect of urbanization on income, expenditure,and poverty of rural households. Section 6 offers some conclusions.
2. Data set
This study relies on data from the 2002, 2004, 2006, and 2008VHLSSconducted by the General Statistics Office (GSO) of Vietnam. The surveys provide data on households and communes. The household data include basic demographics, employment and labor force participation, education, health, income, expenditure, housing, fixed assets, durable goods, and household participation in poverty alleviation programs. Commune data includethe demographics and general situation of communes, general economic conditions and aid programs, non-farm employment, agriculture production, local infrastructure and transportation, education, health, and social issues. Commune data can be merged with household data. However, commune data are collected only for the rural areas (2,181 rural communes); there are no data on urban communes.
The 2002VHLSS covered 29,530 households, while the 2004, 2006, and 2008 VHLSSs each covered 9,189 households. The larger sample size of the 2002 VHLSS was because GSO wanted to obtain income and consumption estimates representative of the provincial level. The other VHLSSs are representative of the regional level. In Vietnam, there are 64 provinces and cities grouped into 8 geographic regions (see figure 2).
9
The VHLSSs collect information on commune characteristicsfrom 2,181 rural communes. According to the 2009 Population and Housing Census, there are 10,894 communes in Vietnam with an average of some 7,900 people per commune. The existence of random panel data in these surveys is helpful. From each VHLSS, GSO randomly selects a number of households to be included in the next VHLSS; the 2002 and 2004 VHLSSs refer to a panel of 4,008 households,and the 2004 and 2006 VHLSSs refer to a different panel of 4,219 households. However, among these households, 1,873 were covered by the 2002, 2004, and 2006 VHLSSs. The 2006 and 2008 VHLSSs selecteda panel of 4,090 households. There are 1,873 households that were sampled by the 2004, 2006, and 2008 VHLSSs. Only 30 households were sampled by all four VHLSSs. The four VHLSSs provide unbalanced panel data for 20,950 households. In this study, we focus on the impact of urbanization on rural households;the number of rural households in our panel data set is 15,886.
3. Urbanization and rural households in Vietnam
3.1. Urbanization process in Vietnam
Topographically Vietnam is a very diverse country, with eight well-defined agro-ecological zones. These regions range from the remote and poorly endowed zones of the Northern Mountain area bordering China, and the North and South Central Coastal regions, through the Central Highlands, to the fertile, irrigated regions of the Red River Delta in the North, and the Mekong Delta in the South. The North West is the poorest region with a low level of urbanization, while the South East is most urbanized region with the lowest poverty (table 1).
10
Table 1: Urbanization and rural poverty in 2002-2008
Regions
Proportion of urban people (%)
Rural poverty rate (%)
2002 2008 2002 2008
Red River Delta 19.7 25.6 27.1 10.4
North East 18.4 20.2 45.8 29.3
North West 13.1 12.9 77.9 52.0
North Central Coast 12.6 14.5 49.1 25.9
South Central Coast 28.0 29.8 31.3 18.2
Central Highlands 26.1 28.7 61.0 31.4
South East 48.9 54.1 17.7 5.7
Mekong River Delta 17.3 21.4 26.6 13.6
Total 23.2 27.6 35.6 18.7
Source: Authors’ estimation based on VHLSSs.
Notes: In this study, a household is classified as poor if its per capita expenditure is below the expenditure poverty line. The expenditure poverty lines are VND1,917,000, 2,077,000, 2,560,000, and 3,358,000 for the years 2002, 2004, 2006, and 2008, respectively. These poverty lines are constructed by the World Bank and GSO. The poverty lines are equivalent to the expenditure level that allows for nutritional needs, and some essential non-food consumption such as clothing and housing.
Before 2008, Vietnam was split into 59 provinces and 5 centrally controlled cities: Hanoi (the capital), Ho Chi Minh City, HaiPhong, Da Nang, and Can Tho. In this study, provinces include both provinces and centrally controlled cities. In 2008, Ha Tay province was merged with Hanoi, reducing the number of Vietnam's provinces to 63. Each province is split into districts, and each district is split further into communes. Communes are the smallest administrative divisions in Vietnam. In 2009, there were 684 districts and 11,112 communes (2009 Population Census). Communes are classified into three types: rural communes, commune-level towns, wards of urban districts. Urban areas consist of commune-level towns andwards. An area is classified as urban if it has a minimum population of 4,000, and a minimum population density of 2,000 inhabitants/km2. The proportion of non-farm workers is required to be at least 65 percent (see Government of
11
Vietnam, 2009).Currently, around 30 percent of the population livein 753 urban areas (commune-level towns andwards) across the country (GSO, 2011).
The process of urbanization in Vietnam has been increasing since the early 1900s (figure 1). According to the definition of urban area in Vietnam, this urbanization has two possible origins. Firstly, rural-urban migration; around 16 percent of the urban population in Vietnam is composed of migrants who moved from rural to urban areas in 2004 to 2009 (GSO, 2011). The key motivation for rural people to move to urban areas is high wage employment in the urban area (e.g., Brauw and Harigaya, 2007). Industrialization and foreign direct investment in industrial zones in urban areas attract rural laborers (Dang et al., 1997).
Figure 1. Percentage of urban population in 1931–2009
12
Secondly, a rural area can become an urban area if its population and non-farm economic activities increase.5In developing countries where agricultural production is a comparative advantage, farm households can increase their income by exporting agricultural products. Increasing incomes in the agricultural sector can result in greater demand for services and manufactured goods (Tacoli, 1998). Trade liberalization and increased export oriented agriculture can lead to the marginalization of small farmers who maybe forced to move to non-farm sectors. Rural communes with increasing population and non-farm sectors are defined as urban wards. The share of wages in the total income of rural household increased from 23.7 percent in 2002 to 27.1 percent in 20086.During 2000-2009, the number of urban areas in Vietnam grew from 649 to 753 (GSO, 2011) while the number of urban communes (wards) increased from 14.8 percent in 1999 (based on 10,474 communes) to 17.7 percent in 2009 (based on 10,894 communes).
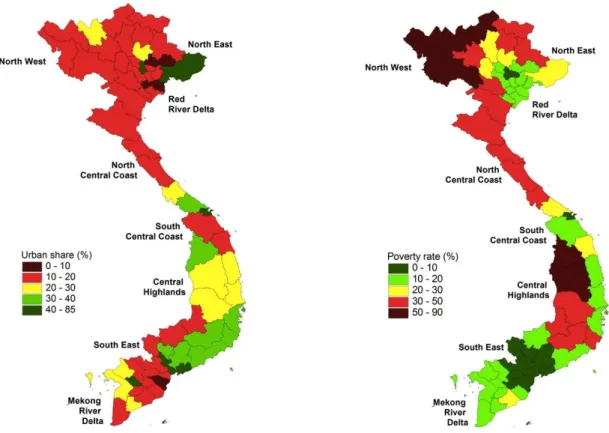
There is wide variation in urbanization between regions and provinces in Vietnam (table 1 and figure 2). The largest cities including Hanoi, Ho Chi Minh City, HaiPhong, and Da Nang are located in the Red River Delta, South Central Coast and South East regions. The proportion of urban dwellers in the populations of provinces ranges from 7 percent to 86 percent. The median of the urban population at the provincial level is around 16 percent. There are two cities whose urban population exceeds 80 percent - Da Nang city (86%) and Ho Chi Minh city (84%), and there are four provinces with proportions of urban population of less than 10 percent.
5Vietnam's population increased by around 1 million annually between 1999 and 2009. 6 Authors’ estimation based on the VHLSS 2002 and 2008.
13
Figure2. Provincial urbanization and rural poverty
The proportion of urban people in 2006 (%) Poverty rate of rural peoplein 2006 (%)
Source: Prepared by the authors using data on urban population from GSO Vietnam and poverty rate data from Nguyen et al. (2010).
3.2. Urbanization and rural households
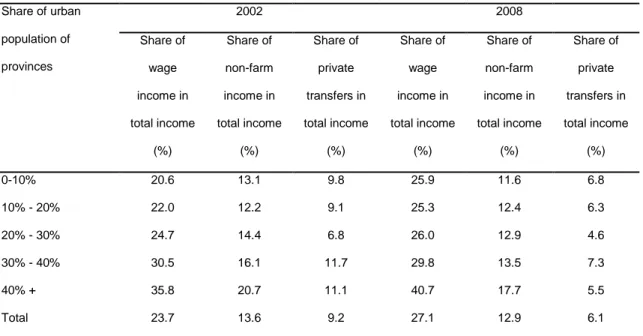
Table 2 presents the association between household and provincial urbanization income patterns. Households in the most urbanized provinces are more likely to have a lower share of crop and livestock income in total income. This is expected since households in more urbanized provinces have smaller agricultural landholdings than households in less
14
urbanized provinces. The share of wages and other non-farm income in total household income is higher for households in more urbanized provinces.
Table 2. Provincial urbanization and income share of rural households in 2008 Share of urban population of provinces 2002 2008 Share of wage income in total income (%) Share of non-farm income in total income (%) Share of private transfers in total income (%) Share of wage income in total income (%) Share of non-farm income in total income (%) Share of private transfers in total income (%) 0-10% 20.6 13.1 9.8 25.9 11.6 6.8 10% - 20% 22.0 12.2 9.1 25.3 12.4 6.3 20% - 30% 24.7 14.4 6.8 26.0 12.9 4.6 30% - 40% 30.5 16.1 11.7 29.8 13.5 7.3 40% + 35.8 20.7 11.1 40.7 17.7 5.5 Total 23.7 13.6 9.2 27.1 12.9 6.1
Source: Authors’ estimations based on from 2002-2008 VHLSS panel data.
Table 3presents the association between income, expenditure, and poverty among rural households, and urbanization. Rural households in more urbanized provinces have higher per capita income and expenditure than rural households in less urbanized provinces. Table 3 also shows the large difference in the expenditure poverty rate between rural households in low and high urbanized areas.
Table 3. Provincial urbanization and rural households during 2002-2008 Share of urban population of provinces 2002 2008 Per capita income Per capita expenditure Poverty rate (%) Per capita income Per capita expenditure Poverty rate (%)
15 0-10% 3251.5 2504.5 35.9 5623.4 3571.4 17 10% - 20% 3317.2 2469 40.4 5247.7 3617.6 21.5 20% - 30% 3663.9 2475.2 37.3 5972.6 3782.5 19.6 30% - 40% 4053.1 3039.8 23.5 5736.1 3879.7 14.5 40% + 5629 4029.4 9.7 6714.2 4991 3.4 Total 3565.2 2621.8 35.6 5569.9 3776.4 18.7
All variables are ‘per capita’, i.e.. equal to total annual household income (expenditure) divided by household size. Income and expenditure variables are based on Jan 2002 prices.
Source: Authors’ estimation based on 2002-2008 VHLSS panel data.
4. Estimation methods
4.1. Fixed-effects regressions
To estimate the effect of urbanization on rural households, we assume a rural household outcome indicator as a function of household characteristics and the urbanization level:
ikt ik ikt t kt ikt U T X Y )ln( ) ln( (1)
whereYikt is anoutcome indicator of household iin province k at time t(years 2002, 2004, 2006, and 2008), andUkt is an indicator of urbanization. In this study, urbanization is measured as the percentage of urban population to total population in the province. Uktis the percentage of urban population in province k at the time t. We use the lagged urban population share, i.e., the urban population shares in 2001, 2003, and 2005, and 2007 so that the urbanization variables are determined before the outcome variables.7Although the 2002, 2004, 2006, and 2008 VHLSSs were conducted in 2002, 2004, 2006, and 2008,
7 There are no data on urban or district level population for 2005-2008. The urban population share is available for 2009 when there wasa population census.
16
respectively, they were implementedmainly in June and September, and the data on householdsreferred to the previous 12 months.
In Vietnam, estimates of urban and rural populationsare based on the Vietnam Population and Housing Censuses which are conducted every ten years. For the years when there was no population census, GSO conductedwhat they call a Population Change and Family Planning Survey to collect data on basic demographics and fertility since 2001. The surveys are representative of urban and rural provinces. Around 6,000 households were sampled in each province (GSO, 2010). In this study, the share of urban population in the provinces is computed based on these surveys.8
t
T is the dummy variable for year t. Xikt is a vector of household characteristics.
ik
andiktare respectively time-invariant and time-variant unobserved variables. The
effect of urbanization on the outcome indicator is measured by which is interpreted as the elasticity of the rural householdoutcome indicator to the proportion of the urban populationin the province.
We estimate the effect of urbanization for a number of household outcome indicators including per capita income, per capita income from different sources, per capita consumption expenditure, and housing and asset variables. For all outcome indicators we use the same model specification as equation (1). In other words, we regress different dependent variables of household outcomes on the same set of explanatory variables.
8
17
Estimating the impact of a factor is always challenging. There are two difficulties involved in estimating the effect in a country of urbanization on rural households . Firstly, the urbanization process involves the country's total population. If urbanization is considered as the treatment, there are no clean treatment and control groups. In this study, we assume that urbanization at the provincial level affects only those people living in the province. It is possible that rural households close to the boundary dividing two provinces might be affected by the respective urbanization processesin those two provinces. However,since the proportion of households living near a provincial boundary is small, the spill-over effects are expected to be small compared to the main effect of urbanization.Appendix Figure A.1 shows that most urban areas lie completely within provinces.Testing the spill-over effect of the urbanization process is beyond the scope of this study due to data limitations but would be an important are for further studies.
Secondly, urbanization is not a random process, and the urbanization process cannot befully observed.We use a fixed-effects regression to eliminate unobserved time-invariant variables (variable ik in the equation (1)) whichcan cause endogeneity bias. We would expect endogeneity bias to be negligible afterthe elimination of unobserved time-invariant variables andafter controlling for theobserved variables.Also, to achieve a robust analysis we ran the fixed-effects with instrumental variable regressions where the instrumental variable for the urbanization variable (one-year lagged share of urban population) was the two-year lagged share of urban population. Lagged endogenous variables are often used as instruments for current endogenous variables. This type of instrument has the advantage that it is strongly corrected with the endogenous variables, and as a result, can reduce bias due to weak instruments.However, the assumption of
18
theexclusion condition of the instruments might not hold. Thus, in this study, we rely mainly on the results of the fixed-effects regressions. In addition, the results for the causal effect of urbanization on rural households should be interpreted with caution.
4.2. Two part fixed-effects models
Our study uses different dependent variables for the income and expenditure sub-components. For total income and consumption expenditure, we employ a fixed-effects regression. However, several dependent variables such asthe sub-components of income and landholding,have zero values for a large number of households. Dependent variableswith zero values suggest use of a Tobit model. However, in our case there are two problems with a Tobit model. Firstly, there are no available fixed-effects Tobit estimators due to the so-called incidental parameter problem in maximum likelihood methods (Greene, 2004)9.Secondly, Tobit estimators are not consistent if the assumption related to the normality and homoskedasticity of the error terms is violated (Cameron and Trivedi, 2009). This assumption is very strong and often does not hold. In health economics, a two-part model is often used to model a variable with a large number of zero values(Duan et al., 1983; Manning et al., 1987). In this study, we apply the two-part model in the context of fixed-effects panel data, as follows:
ikt D ik D D ikt D t D kt D ikt U T X D ln( ) , (2) ikt Y ik Y Y ikt Y t Y kt Y Y ikt U T X Y ikt ln( ) ) ln( | 0 , (3)
9 Instead of a fixed-effects Tobit model, it is possible to use a random-effects Tobitmodel with the available explanatory variables and group means of these explanatory variables to remove time-invariant unobserved variables (Wooldridge, 2001).
19
whereDiktis a binary variable which is equal to 1 for Yikt0, and 0 if Yikt 0. SubscriptsD and Y in the parameters of equations (2) and (3) denote parameters in the models of Dikt
and ln(Yikt), respectively. Equation (2) is a linear probability model. Equation (3) is a linear model of ln(Yikt) for households with positive values of Yikt. Both equations (2) and (3) are estimated using the fixed-effects regressions.
Although equation (2) (with the binary dependent variable) is often estimated using a logit or probit model, we estimate equation (2) using a linear probability regressionsince the aim is to estimate equation (2) using a fixed-effects estimator (there are no available fixed-effects probit estimators). Although we could use a fixed-effects logit regression this is not efficient since it drops observations with fixed values for the dependent variable. Linear probability models generally are used to estimate the marginal effect of independent variables when there is no non-linear probability modelavailable (e.g., Angrist, 2001; Angrist and Krueger, 2001).
The effect of urbanization on the outcome indicator is measured by D and Y, and each parameters can indicate something interesting. We are interested also in the averagepartial effect (APE)of ln(U)on the unconditional dependent variableln(Y)which is estimated as follows (see Appendix 2 for the proof):
ikt ikt Y ikt ikt Y D Y lm D n Y n E P Aˆ ( ) ˆ 1 ln( ) ˆ 1 , (4)whereˆD and ˆYare estimates based on the fixed-effects regressions of equations (2) and (3), nYis the number of observations with positive values of Y, and n is the total number of
20
observations in the panel data sample. A ˆPEY measures the elasticity of Y with respect to U
(the partial effect of ln(U)on ln(Y)).
4.3. The effect on poverty rate
While urbanization has an effect on consumption expenditure, it also can affect poverty. In this study, we measure poverty by the expenditure poverty rate. A household is classified as the poor if its per capita expenditure is below the expenditure poverty line. We use a simple method to estimate the effect of urbanization on the poverty rate of rural households. The APE of the urbanization variable on the poverty rate can be estimated as follows (see Appendix 2 for proof):
ikt ikt ikt ikt ikt ikt P Y z U H M E P A ˆ ˆ ) ln( ln ˆ 1 ˆ (5)whereHi is the size of household i, and M is the total number of people in the data sample
which is equal to
ikt i
H .The summation includes the households in the two periods. ˆ,
ikt
ˆ andˆiktare estimated from the fixed-effects regression of log of per capita expenditure.
is the probability density function of the standard normal distribution.A ˆPEPis
interpreted as the change in the poverty rate as a result of a 1 percentage point change in the share of urban population in the provinces. We can estimate A ˆPEPfor each year to see
how the effect of urbanization changes overtime.
The standard errors of the APE estimators (in equations (4) and (5)) are calculated using non-parametric bootstrap with 500 replications.
21 5. Empirical results
5.1. Effects of urbanization on household income
As discussed in section 3, urbanization combined with the process of industrialization can create more non-farm employment and promote the economic transition of rural households.In this section, we first regress rural household income variables on the share of urban population and other control variables. Earning variables depend on a set of household characteristics which can be grouped into five categories (Glewwe, 1991): (i) Household composition, (ii) Regional variables, (iii) Human assets, (iv) Physical assets, and (v) Commune characteristics. Thus, the explanatory variables include household demographics, level of education of the household head, and availability of an automobile road in the village. Variables such as regional dummies which are time-invariant, are excluded from the fixed-effects regressions. Note that the explanatory variables should not be affected by the urbanization variable (Heckman et al., 1999). Thus, we limit our estimation to the most exogenous explanatory variables. The summary statistics of the explanatory variables are presented in Appendix3 table A.1.
We estimate both the fixed-effects regressions and the fixed-effects using instrumental variable regressions in which the instrumental variable for the urbanization variable (1-year lagged share of urban population) is the two-year lagged share of urban population. The first-stage regression shows a strongly positive correlation between this instrument andthe urbanization variable. The results of thefixed-effects estimates with instrumental variable regressions are very similar to the fixed-effects regressions
22
(presented in Appendix 3). We use the results from the fixed-effects regressions for interpretation.
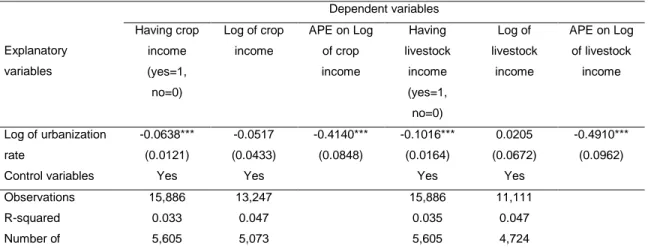
Table 4 presents the fixed-effects regressions for crop and livestock income on urbanization, and estimation of the APE using fixed-effects two-part models. Tables 4 to 9report only the estimated coefficients of the variable urbanization. The full regression results are provided in Appendix 3tables A.2 to A.7.Table 4 shows that a1 percent increase in the urban population share of provinces reduces the probability of income from crops and livestock by 0.064 percent and 0.102 percent respectively. However, the effect of urbanization on crop and livestock incomes conditional on households having such income is not statistically significant. This is consistent with the effect of urbanization on landholding. Urbanization decreases the proportion of rural households with arable land but not the area of arable land owned by rural households with crop land.
Overall, the APE of urbanization on crop and livestock incomeremains negative. A1 percent increase in the urban population share of provinces decreases crop and livestock incomes by 0.1 percent and 0.5 percent respectively.
Table 4. Fixed-effects regression of crop and livestock income
Explanatory variables Dependent variables Having crop income (yes=1, no=0) Log of crop income APE on Log of crop income Having livestock income (yes=1, no=0) Log of livestock income APE on Log of livestock income Log of urbanization rate -0.0638*** -0.0517 -0.4140*** -0.1016*** 0.0205 -0.4910*** (0.0121) (0.0433) (0.0848) (0.0164) (0.0672) (0.0962)
Control variables Yes Yes Yes Yes
Observations 15,886 13,247 15,886 11,111
R-squared 0.033 0.047 0.035 0.047
23 Explanatory variables Dependent variables Having crop income (yes=1, no=0) Log of crop income APE on Log of crop income Having livestock income (yes=1, no=0) Log of livestock income APE on Log of livestock income households
Heteroskedastic robust standard errors in parentheses (corrected also for sampling and cluster correlation). *** p<0.01, ** p<0.05, * p<0.1
Source: Authors’ estimation based on 2002-2008 VHLSS panel data.
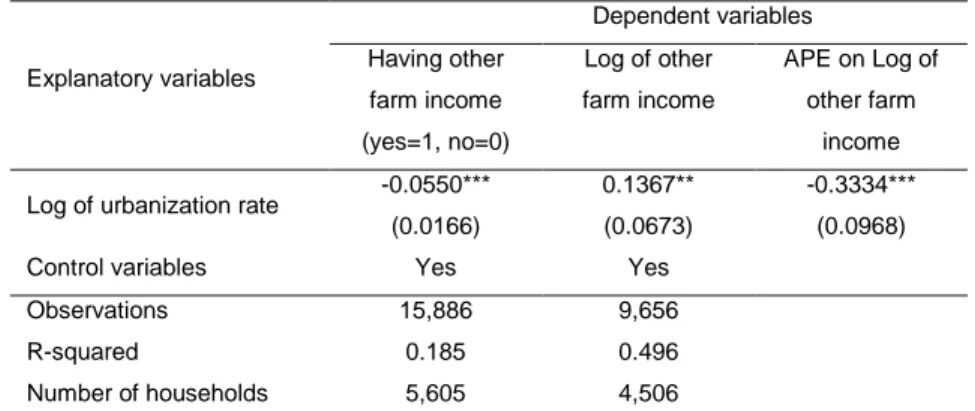
Urbanization also has a negative effect on other farm income (table 5). Other farm income includes income from agriculture, forestry, and other agricultural activities. Urbanization can decrease the probability of having other farm income by 0.055 percent, and can reduce the level of rural households' other farm income by 0.14 percent.
Table 5. Fixed-effects regression of other farm income
Explanatory variables Dependent variables Having other farm income (yes=1, no=0) Log of other farm income APE on Log of other farm income Log of urbanization rate -0.0550*** 0.1367** -0.3334***
(0.0166) (0.0673) (0.0968)
Control variables Yes Yes
Observations 15,886 9,656
R-squared 0.185 0.496
Number of households 5,605 4,506
Heteroskedastic robust standard errors in parentheses (corrected also for sampling and cluster correlation). *** p<0.01, ** p<0.05, * p<0.1
Source: Authors’ estimation based on 2002-2008 VHLSS panel data.
Shortage of agricultural land in Vietnam can push farmersinto non-farm employment (Dang et al., 1997; Cu, 2005). Urbanization can lead to an increase in land prices in rural areas near to cities, allowing rural households to sell their land at higher prices. Land sales can enable the householdto invest in capital-intensive, nonfarm
24
production (Cali and Menon, 2009). The urbanization and industrialization process also creates more non-farm employment opportunities for rural dwellers.
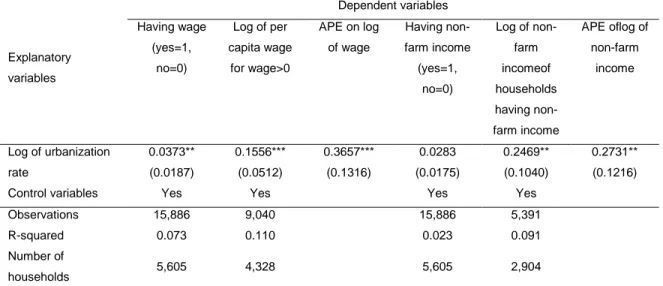
Table 6shows that urbanization increases both the wages and income of rural households from non-farm business and production (excluding wages). A 1 percent increase in the urban population share of provinces increases wages and non-farm income by 0.37 percent and 0.27 percent, respectively. During the urbanization process, agricultural land may be converted to agricultural uses such as infrastructure and non-farm businesses. Farmers subject to enforced acquisition of non-farmland can be liable for compensation which will increase their income and reduce their level of poverty - at least in the short-run (Nguyen and Tran, 2014). Tuyen and Van-Huong (2013), and Ravallion and van de Walle (2008) find that in Vietnam, landlessness does not necessarily lead to poverty.
Table 6.Fixed-effects wages and non-farm income regressions
Explanatory variables Dependent variables Having wage (yes=1, no=0) Log of per capita wage for wage>0 APE on log of wage Having non-farm income (yes=1, no=0) Log of non-farm incomeof households having non-farm income APE oflog of non-farm income Log of urbanization rate 0.0373** 0.1556*** 0.3657*** 0.0283 0.2469** 0.2731** (0.0187) (0.0512) (0.1316) (0.0175) (0.1040) (0.1216)
Control variables Yes Yes Yes Yes
Observations 15,886 9,040 15,886 5,391
R-squared 0.073 0.110 0.023 0.091
Number of
households 5,605 4,328 5,605 2,904
Heteroskedastic robust standard errors in parentheses (corrected also for sampling and cluster correlation). *** p<0.01, ** p<0.05, * p<0.1
25
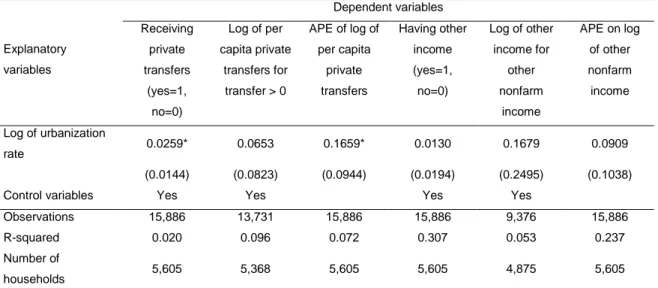
Urbanization does not have a significant effect on the private transfers received by households,or income from other sources (table 7). However, urbanization increases the probability of receiving a transfer.Migration is likely to increaseduring the urbanization process which leads to a higher proportion of rural households in receipt of remittances. Nguyen et al. (2011) show for Vietnam that migration leads to an increase in the remittances received by home households.However, in periods of economic crisis, the effect of urbanization on private transfers may be smallerwith both migration and remittances decreasing. Actionaid (2009) found that in some provinces, remittances from migrants have decreased as a result of therecent global economic crisis.
Table 7.Fixed-effects regressions of transfers and other non-farm income
Explanatory variables Dependent variables Receiving private transfers (yes=1, no=0) Log of per capita private transfers for transfer > 0 APE of log of per capita private transfers Having other income (yes=1, no=0) Log of other income for other nonfarm income APE on log of other nonfarm income Log of urbanization rate 0.0259* 0.0653 0.1659* 0.0130 0.1679 0.0909 (0.0144) (0.0823) (0.0944) (0.0194) (0.2495) (0.1038)
Control variables Yes Yes Yes Yes
Observations 15,886 13,731 15,886 15,886 9,376 15,886
R-squared 0.020 0.096 0.072 0.307 0.053 0.237
Number of
households 5,605 5,368 5,605 5,605 4,875 5,605
Heteroskedastic robust standard errors in parentheses (also corrected for sampling and cluster correlation). *** p<0.01, ** p<0.05, * p<0.1.
The APE is computed using the formula in equation (5).
Source: Authors’ estimation based on 2002-2008 VHLSS panel data.
Previous analysesshows that urbanization reduces farm income but increases non-farm income. An important question is whether urbanization affects the aggregate income
26
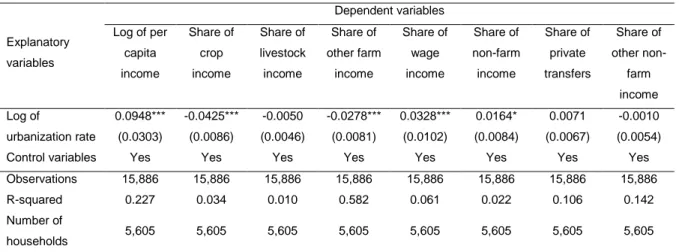
of rural households.Table 8 presents the effect of urbanization on per capita income, and the ratio of subcomponent incomes to total income. Urbanization has a positive effect on the per capita income of rural households. A 1 percent increase in the urban population share of provinces increases the per capita income of rural households by 0.09 percent.
The effect of urbanization on the shares of different incomes is small,and is consistent with the findings on the effect of urbanization ontotal income10.Specifically, a 1 percent increase in the urban population share of provinces reduces the share of crop income and other farm income in total household income by 0.04 percent and 0.03 percent, respectively. Also, a 1 percent increase in the share of urban population in the province increases the share of wages and non-farm income in total household income by 0.03 percent and 0.02 percent, respectively.
Table 8. Fixed-effects regression of income and income share
Explanatory variables Dependent variables Log of per capita income Share of crop income Share of livestock income Share of other farm income Share of wage income Share of non-farm income Share of private transfers Share of other non-farm income Log of urbanization rate 0.0948*** -0.0425*** -0.0050 -0.0278*** 0.0328*** 0.0164* 0.0071 -0.0010 (0.0303) (0.0086) (0.0046) (0.0081) (0.0102) (0.0084) (0.0067) (0.0054)
Control variables Yes Yes Yes Yes Yes Yes Yes Yes
Observations 15,886 15,886 15,886 15,886 15,886 15,886 15,886 15,886 R-squared 0.227 0.034 0.010 0.582 0.061 0.022 0.106 0.142 Number of
households 5,605 5,605 5,605 5,605 5,605 5,605 5,605 5,605 Heteroskedastic robust standard errors in parentheses (corrected also for sampling and cluster correlation).
*** p<0.01, ** p<0.05, * p<0.1
Source: Authors’ estimations based on VHLSSs 2002-2008 panel data.
10
Note that all the fraction variables are measured as percentages. In this case, a 1% increase in urbanization will increase or decrease the dependent variables by a percentage point that is equal approximately to the coefficient divided by 100.
27
5.2. Effect of urbanization on household asset, expenditure and poverty
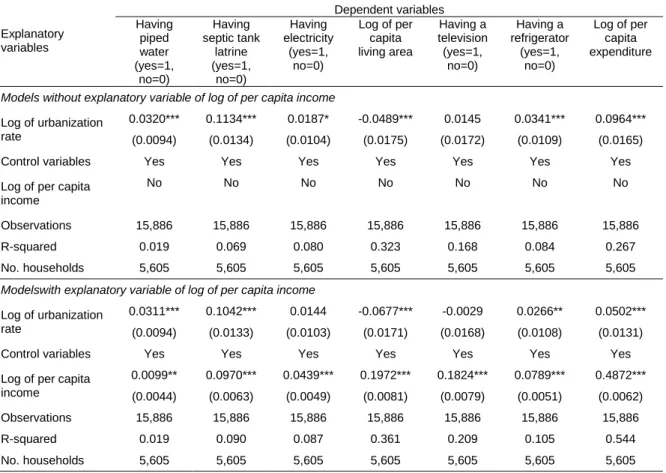
We are interested also in whether the increased income due to urbanization increases the living standards of rural households and contributes to reducing rural households' poverty. We measure poverty as expenditure poverty. It has been suggested that monetary poverty does not provide a comprehensive evaluation of human well-being, andthat poverty should be examined from a multidimensional perspective (Bourguignon and Chakravarty, 2003; Alkire and Foster, 2011). To investigate whether urbanization improvesthe non-monetary welfare of rural households, we regress several outcomes including sanitation, housing, electricity, and durables on the urbanization variables. The upper panel in Table 9 presents the fixed-effects linear probability regressions without controlling for per capita income; the lower panel presents the fixed-effects linear probability regressions controlling for per capita income. We see that urbanization increases access to piped water, septic tank latrines, and electricity. Controlling for per capita income does not change the effect of urbanization on these outcome variables which implies that householdincome is not the main channel through which urbanization increases access to infrastructure.
We find that theurbanization process results in a decrease in households’ living area. A 1 percent increase in the urban population share reduces the per capita living areas (measured in square meters) of rural households by 0.0489 percent. If we control for per capita income, the effect is higher, at 0.0677 percent. This might be because residential land becomes more expensive during the process of urbanization, and households tend to live in smaller houses.We regress two popular durables in Vietnam, television and refrigerator, on urbanization. We find that urbanization has a positive and significant effect on refrigerator but not televisionownership.
28
Rural households in provinces with high proportions of urban population tend to have higher consumption expenditure. A 1percent increase in the urban population share increases the per capita expenditure of rural households by 0.096 percent (table 10).If we control for income, the effect of urbanization on expenditure remains significant but is smaller.A part of increased income due to urbanization translates into increased consumption.
Table 9. Fixed-effects regression of per capita expenditure and household assets
Explanatory variables Dependent variables Having piped water (yes=1, no=0) Having septic tank latrine (yes=1, no=0) Having electricity (yes=1, no=0) Log of per capita living area Having a television (yes=1, no=0) Having a refrigerator (yes=1, no=0) Log of per capita expenditure
Models without explanatory variable of log of per capita income
Log of urbanization rate
0.0320*** 0.1134*** 0.0187* -0.0489*** 0.0145 0.0341*** 0.0964*** (0.0094) (0.0134) (0.0104) (0.0175) (0.0172) (0.0109) (0.0165)
Control variables Yes Yes Yes Yes Yes Yes Yes
Log of per capita income
No No No No No No No
Observations 15,886 15,886 15,886 15,886 15,886 15,886 15,886
R-squared 0.019 0.069 0.080 0.323 0.168 0.084 0.267
No. households 5,605 5,605 5,605 5,605 5,605 5,605 5,605
Modelswith explanatory variable of log of per capita income
Log of urbanization rate
0.0311*** 0.1042*** 0.0144 -0.0677*** -0.0029 0.0266** 0.0502*** (0.0094) (0.0133) (0.0103) (0.0171) (0.0168) (0.0108) (0.0131)
Control variables Yes Yes Yes Yes Yes Yes Yes
Log of per capita income 0.0099** 0.0970*** 0.0439*** 0.1972*** 0.1824*** 0.0789*** 0.4872*** (0.0044) (0.0063) (0.0049) (0.0081) (0.0079) (0.0051) (0.0062) Observations 15,886 15,886 15,886 15,886 15,886 15,886 15,886 R-squared 0.019 0.090 0.087 0.361 0.209 0.105 0.544 No. households 5,605 5,605 5,605 5,605 5,605 5,605 5,605 Heteroskedastic robust standard errors in parentheses (corrected also for sampling and cluster correlation).
*** p<0.01, ** p<0.05, * p<0.1
29
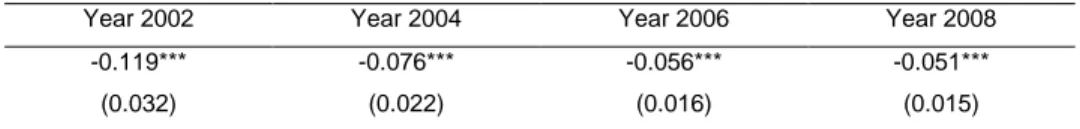
Finally, we estimate the effect of urbanization on rural poverty using equation (5) (table 10). Since urbanization increases household expenditure, it reduces the expenditure poverty rate of rural households. Similar to the case of India (Cali and Menon, 2009), we find that in Vietnam urbanization reduces expenditure poverty although only slightly. The effect of urbanization on the poverty rate tends to be smaller overtime since the poverty rate decreases overtime. In 2002, a1 percentage point increase in the proportion of urban population in the provinces results in a 0.12 percentage point reduction in the expenditure poverty rate. In 2008, the povertyreducing effect of urbanization was 0.05 percentage points.
Table 10: Impact of urbanization on rural poverty rate (percentage points)
Year 2002 Year 2004 Year 2006 Year 2008
-0.119*** -0.076*** -0.056*** -0.051***
(0.032) (0.022) (0.016) (0.015)
Note: Both the poverty rate and the urbanization level are measured as percentages. Robust standard errors in parentheses. Standard errors calculated using non-parametric bootstrap with 500 replications. *** p<0.01, ** p<0.05, * p<0.1.
Source: Authors’ estimation based on 2002-2008 VHLSS panel data.
6. Conclusions
This paper examined the effect of urbanization on income, expenditure, and poverty among rural households in Vietnam using 2002, 2004, 2006, and 2008 VHLSS panel data.Our main findings are as follows. Urbanization stimulates the transition from farm to non-farm activities in rural areas. Rural households in highly urbanized provinces have lower crop income and lower livestock income but higher wages and higher non-farm income.Urbanization increases the probability of receivingprivate transfers.This implies
30
that urbanization increases rural-urban migration, and migrant-sending households are likely to receive remittances from their migrant members.
The increased income due to higher wages and higher non-farm income outweighs the income decreases due to lower farm income. Thus, urbanization contributes to increasing rural households' per capita income and per capita expenditure. More specifically, a 1 percent increase in the share of urban population at the provincial level increasesthe per capita income and per capita expenditure of rural households by around 0.09 percent. We also found a positive effect of urbanization on households’ access to sanitation, piped water, and electricity. However, urbanization leads to a reduction in the living areas of rural households, possibly because urbanization makes residential land more expensive. Note that the positive effect of urbanization on access to sanitation, piped water, and electricity is not due to income. It is possible that urbanization increases rural households’ demand for and knowledge about sanitation, or alternatively, that urbanization leads to improved infrastructure.
Overall, our analysis suggests that urbanization increases income and consumption expenditure and reducespoverty among rural households in Vietnam. Urbanization also allows rural households increased access to sanitation, piped water, and electricity. These findings have important implications for poverty reduction policies, especially since thepace of poverty reduction has been slow in recent years. In addition to poverty reduction programs targeted towardsthe poor, policies and programs to stimulate urbanization, and policies linking urban and rural development might be effective for reducing both overall poverty and rural poverty.Similarly, urbanization might playan important role inreducing rural poverty in developing countries with similar economic and
31
geographical conditions to Vietnam such as the Philippines, Indonesia, Laos, and Cambodia.
Finally, the effect of urbanization on the urban-rural gap and inequality is interesting. Several studies suggest that inequality reduces happiness (e.g., Alesina et al., 2004;Verme, 2011; Schröder, 2016). Urbanization can affect not only income and expenditure of rural households but also the urban-rural gap in income and consumption. With an increasing urban-rural gap, relative welfare and happiness among rural households might decrease despite their absolute income and consumption increasing. Testing this hypothesis would require data on urban-rural gaps in income and consumption at the geographical level is small areas such as districts. This is beyond the scope of the present study but would be worth investigating.
32 References
Acosta, P., C. Calderon, Fajnzylber, P., Lopez. H., 2007. What is the impact of international remittances on poverty and inequality in Latin America?World Development 36(1): 89-114.
Actionaid., 2009. The impacts of the global economic crisis on migration patterns in Viet Nam”, Research report, Actionaid, Autralisan Government Aid Program, Oxfarm, Hanoi, Vietnam.
Adams, R., Page, J., 2005. Do International Migration and Remittances Reduce Poverty in Developing Countries? World Development, 33, 1645-1669.
Alesina, A., Di Tella, R., MacCulloch, R., 2004. Inequality and happiness: are Europeans and Americans different? Journal of Public Economics, 88(9), 2009-2042.
Alkire, S., Foster, J. E., 2011. Counting and Multidimensional Poverty Measurement,Journal of Public Economics 95, 476-487.
Allen, R., 2009.The British Industrial Revolution in Global Perspective. Cambridge University Press.
Angrist, D. J., Krueger, A. B., 2001. Instrumental Variables and the Search for Identification: From Supply and Demand to Natural Experiments.Journal of Economic Perspectives, 15(4): 69–85.
Angrist, D. J., 2001. Estimation of Limited Dependent Variable Models With Dummy Endogenous Regressors: Simple Strategies for Empirical Practice.Journal of Business & Economic Statistics, 29(1): 1-28.
Azam, J. P., Gubert F., 2006. Migrants’ Remittances and the Household in Africa: A Review of Evidence, Journal of African Economies, 15(2),426-462.
Bairoch, P., 1988.Cities and Economic Development: From the Dawn of History to the Present, The University of Chicago Press.
Banerjee, A., Duflo, E., 2007. The economic lives of the poor. The Journal of Economic Perspectives, 21(1), 141-167.
Basu, S., Mallick, S., 2008. When does growth trickle down to the poor? The Indian case. Cambridge Journal of Economics, 32(3), 461-477.
Berdegue, J.A., E. Ramirez, T. Reardon., Escobar, G., 2001. Rural nonfarm employment and incomes in Chile, World Development, 29(3), 411-425.
Bertinelli, L., Black D., 2004.Urbanization and growth, Journal of Urban Economics, 56, 80–96.
Bloom. D., Cunning, D., Fink, G., 2008. Urbanization and the Wealth of Nations, Science, 13, 319.
33
Bourguignon, F., Chakravarty, S., 2003. The Measurement of Multidimensional Poverty, Journal of Economic Inequality, 1(1), 25-49.
Bouiyour, J., Miftah, A., Mouhoud, E., 2016. Education, Male gender preference and Migrants' remittances: Interactions in rural Morocco, Economic Modelling, 57, 324-331. Brauw, A., Harigaya T., 2007. Seasonal migration and improving living standards in Vietnam. American Journal of Agricultural Economics 89(2): 430-447.
Cali, M., Menon, C., 2013. Does Urbanisation Affect Rural Poverty? Evidence from Indian Districts, The World Bank Economic Review, 27(2), 171-201.
Cameron, A. C., Trivedi, P. K., 2009. Microeconometric using Stata, Stata Press.
Cu C. L., 2005. Rural to urban migration in Vietnam. Chapter 5 in “Impact of Socio-economic Changes on the Livelihoods of People Living in Poverty in Vietnam”, edited by Ha Huy Thanh and Shozo Sakata, Institute of Developing Economies, Japan External Trade Organization.
Dang, A., Goldstein, S., McNally, J.W., 1997. Internal migration and development in Vietnam. International Migration Review,31(2): 312–337.
Deichmann, U., Shilpi F., Vakis, R., 2009. Urban Proximity, Agricultural Potential and Rural Non-Farm Employment: Evidence from Bangladesh, World Development, 37(3), 645-660.
Demery, L. and Squire, L. 1995.Poverty in Africa: an Emerging Picture, Washington, DC, World Bank.
Dollar, D., Kraay, A., 2000.Growth Is Good for the Poor, Development Research Group, Washington, D.C., World Bank.
Duan, N., Manning, W.G., Moris, C., Newhouse, J.P., 1983. A comparison of alternative models for the demand for medical care. Journal of Business and Economics Statistics, 1, 115–126.
Fafchamps, M., Shilpi, F., 2005. Cities and Specialization: Evidence from South Asia, Economic Journal, 115, 477-504.
Farrington, J., and Slater, R., 2006. Introduction: Cash Transfers: Panacea for Poverty Reduction or Money Down the Drain?, Development Policy Review, 2006, 24(5), 499– 511.
Fujita, M., Krugman, P., Mori, T., 1999. On the evolution of hierarchical urban systems,European Economic Review, 43(2), 209-251.
Gallup, J.L., J.D. Sacks., Mellinger, A., 1999. Geography and economic development. International Regional Science Review, 22, 179-232.
Glewwe, P., 1991. Investigating the Determinants of Household Welfare in Cote d'Ivoire.Journal of Development Economics,35: 307-37.
Government of Vietnam., 2009. Decree No. 42/2009/ND-CPon Classification of Urban Areas in Vietnam, dated on 07/05/2009, Hanoi, Vietnam.
34
Greene, W., 2004. Fixed effects and bias due to the incidental parameters problem in the Tobit model, Econometric Reviews 23(2), 125 – 147.
Grigorian, D. A., and Melkonyan, T. A., 2011. Destined to receive: The impact of remittances on household decisions in Armenia, Review of Development Economics, 15(1): 139-53.
GSO., 2010. Phương án điều tra biến động dân số và kế hoạch hoá gia đình 1/4/2010 (The plan to conduct Population Change and Family Planning Survey 1/4/2010), General Statistics Office of Vietnam, Hanoi, Vietnam.
GSO., 2011.Migration and Urbanization in Vietnam: Patterns, Trends and Differentials, Monograph, General Statistics Office of Vietnam (GSO), Hanoi, Vietnam.
Haggblade, S., Hazell, P., Reardon, T., 2010. The Rural Non-farm Economy: Prospects for Growth and Poverty Reduction, World Development, 38(10), 1429-1441.
Heckman, J., Lalonde, R., Smith J., 1999. The economics and econometrics of active labor market programs. Handbook of Labor Economics 1999; Volume 3, Ashenfelter, A. and D. Card, eds., Elsevier Science.
Harris, R.,Todaro, P., 1970. Migration, Unemployment and Development: A Two-Sector Analysis, American Economic Review60 (1): 126–142
Henderson, V., 2003. Urbanization and Economic Development, Annals of Economics and Finance, 4, 275-241.
Hentschel, J., Lanjouw, J., Lanjouw, P. Poggi, J., 2000. Combining census and survey data to trace the spatial dimensions of poverty: a case study of Ecuador, World Bank Economic Review, Vol. 14, No. 1: 147-65.
Kim, N., 2007.The impact of remittances on labor supply: The case of Jamaica, World Bank Policy Research Working Paper 4120, Washington, DC, USA.
Krugman, P., 1991. Increasing returns and economic geography,Journal of Political Economy, 99, 483-99.
Kumar, T.K., Mallick, S.K. Holla, J., 2009. Estimating consumption deprivation in India using survey data: a state-level rural-urban analysis before and during the reform period. Journal of Development Studies, 45(4), 441-470.
Lewis, W. A., 1954. Economic development with unlimited supplies of labour.The Manchester School 22: 139-191.
McKenzie, D., and Sasin, M.. 2007. Migration, remittances, poverty, and human capital: conceptual and empirical challenges. Policy Research Working Paper 4272, The World Bank.
Mallick, S. K., 2014. Disentangling the Poverty Effects of Sectoral Output, Prices, and Policies in India. Review of Income and Wealth, 60: 773-801.
Manning, W.G., Duan, N., and Rogers, W.H., 1987. Monte Carlo evidence on the choice between sample selection and two-part models. Journal of Econometrics 35, 59–82.
35
Nguyen V. C. Tran N. T. Roy V. D. W., 2010. Poverty and Inequality Maps in Rural Vietnam: An Application of Small Area Estimation,Asian Economic Journal, 24(4), 355-390.
Martinez-Vazquez, J., Panudulkitti P., and Timofeev, A., 2009. Urbanization and the Poverty Level, Working Paper 09-14, Andrew Young School of Policy Studies, Georgia State University.
Nguyen, C., Tran, A., 2014. The effect of crop land on poverty reduction: Evidence from Vietnam,European Review of Agricultural Economics, 41(4), 561-582
Nguyen, C., Van den Berg M., Lensink, R., 2013. The Impacts of International Remittances on Income, Work Efforts, Poverty and Inequality: New Evidence for Vietnam, in "Banking the World: Empirical Foundations of Financial Inclusion" edited Robert J. Cull, Asli Demirguc-Kunt and Jonathan Morduch, the World Bank and MIT Press.
Nguyen, C., Van den Berg, M., Lensink, R.,2011. The impact of work and non‐work migration on household welfare, poverty and inequality,The Economics of Transition, 19(4), 771-799.
Otsuka, K., 2007. The Rural Industrial Transition in East Asia: Influences and Implications. Chapter 10 in Haggblade, Hazell and Reardon, editors, Transforming the Rural Nonfarm Economy. Baltimore: Johns Hopkins University Press.
Quigley, J. M., 2008. Urbanization, Agglomeration, and Economic Development. Working Paper No. 19, Commission on Growth and Development.
Ravallion, M., Chen, S., Sangraula, P., 2007. New evidence on the urbanization of global poverty, World Bank Policy Research Working Paper 4199.
Ravallion,M., van deWalle,D., 2008. Land in Transition: Reform and Poverty in Rural Vietnam. Washington, DC: World Bank and Palgrave Macmillan Press.
Schröder, M., 2016. How income inequality influences life satisfaction: hybrid effects evidence from the German SOEP. European Sociological Review, 32(2), 307-320.
Stark, O., 1991.The Migration of Labour, Cambridge, Mass. Harvard University Press. Stark, O., Taylor, J., 1991. “Migration Incentives, Migration Types: The Role of Relative Deprivation”, The Economic Journal, 101, 1163-78.
Tacoli, C., 1998. Rural-Urban Interactions: A Guide to the Literature.Environment and Urbanization 10(1):147-166.
Tuyen, T. Q., Van-Huong, V., 2013. Farmland Loss and Poverty in Hanoi’s Peri-Urban Areas, Vietnam: Evidence from Household Survey Data.AGRIS on-line Papers in Economics and Informatics, 5(4), 199-209.
United Nations., 2012. World Urbanization Prospects: The 2011 Revision. Department of Economic and Social Affairs, Population Division. United Nations, New York.
36
Verme, P., 2011. Life satisfaction and income inequality. Review of Income and Wealth, 57(1), 111-127.
Williamson, J., 1990.Coping with City Growth During the British Industrial Revolution. Cambridge University Press.
Wooldridge J. M., 2001. Econometric Analysis of Cross Section and Panel Data. The MIT Press, Cambridge, Massachusetts London, England.
World Bank., 2011. Vietnam Urbanization Review: Technical Assistance Report, The World Bank, Hanoi, Vietnam.
Yang, D., 2008. International Migration, Remittances, and Household Investment: Evidence from Philippine Migrants’ Exchange Rate Shocks, Economic Journal, 118 (528) 591-630.
37 Appendix 1: Figures
Figure A.1. Urban areas in Vietnam
38 Appendix 2: Average partial effect estimators
Average partial effect in fixed-effects two-part models
From equations (2) and (3) we can compute the marginal partial effect of the log of urbanization on the dependent variable as follows (for simplicity, subscripts i, k, and t are dropped):
ln( ) 0,ln( ), , ,
0ln( ), , ,
. , , ), ln( 0 ) ln( , , ), ln( , 0 ) ln( , , ), ln( , 0 ) ln( ) ln( , , ), ln( 0 ) ln( , , ), ln( , 0 ) ln( , , ), ln( 0 ) ln( , , ), ln( ) ln( X T U Y P X T U Y Y E X T U Y P U X T U Y Y E X T U Y Y E U X T U Y P U X T U Y Y E X T U Y P U X T U Y E Y D (A.1)The partial effect varies across the value of U, T, and X. Note that we can differentiate
)
ln(Y with respect to ln(U) since the fixed-effects model assumes that the time-invariant error term () is fixed, and the time-invariant error term ( ) is uncorrelated with ln(U).
Based on (A.1), the estimator of the APE of ln(U) on ln(Y)can be expressed as follows:
ikt ikt Y ikt ikt Y D Y lm D n Y n E P Aˆ ( ) ˆ 1 ln( ) ˆ 1 , (A.2)whereˆD and ˆYare estimates from the fixed-effects regressions of equations (2) and (3),
Y
n is the number of observations with positive values of Y, and n is the total number of observations in the panel data sample. A ˆPEY measures the elasticity of Y with respect to U (the partial effect of ln(U)on ln(Y)).
The effect on poverty rate
Based on the expenditure model (1) the probability that household i is poor can be expressed as follows (Hentschel et al., 2000):