HAL Id: hal-01855978
https://hal.archives-ouvertes.fr/hal-01855978
Submitted on 28 Mar 2019
HAL is a multi-disciplinary open access archive for the deposit and dissemination of sci-entific research documents, whether they are pub-lished or not. The documents may come from teaching and research institutions in France or abroad, or from public or private research centers.
L’archive ouverte pluridisciplinaire HAL, est destinée au dépôt et à la diffusion de documents scientifiques de niveau recherche, publiés ou non, émanant des établissements d’enseignement et de recherche français ou étrangers, des laboratoires publics ou privés.
orchards: a useful tool to test management practices
A. Saez, A. Di Virgilio, F. Tiribelli, Benoit Geslin
To cite this version:
A. Saez, A. Di Virgilio, F. Tiribelli, Benoit Geslin. Simulation models to predict pollination success in apple orchards: a useful tool to test management practices. Apidologie, Springer Verlag, 2018, 49 (5), pp.551-561. �10.1007/s13592-018-0582-2�. �hal-01855978�
Simulation
models to predict pollination success in apple
orchards:
a useful tool to test management practices
A. SÁEZ1, A.DIVIRGILIO2,3, F. TIRIBELLI2, B. GESLIN4
1Universidad Nacional del Comahue, INIBIOMA-CONICET, Quintral 1250, CP 8400, San Carlos de Bariloche, Rio
Negro, Argentina
2Grupo de Ecologıa de la Polinizacion, INIBIOMA (CONICET-Universidad Nacional del Comahue), CP 8400, San
Carlos de Bariloche, Rio Negro, Argentina
3Grupo de Investigaciones en Biología de la Conservación, INIBIOMA-CONICET, CP 8400, San Carlos de Bariloche,
Rio Negro, Argentina
4IMBE, Aix Marseille Univ, Avignon Université, CNRS, IRD, Marseille, France , Marseille, France
Abstract – The cultivated area of pollinator-dependent crops is increasing globally, and thus many natural habitats are being replaced by cropland. This change in land use is one of the main causes of biodiversity losses, of which include wild pollinators. As a consequence, many bee species are increasingly being reared and sold specifically for crop pollination services. However, the spatial arrangement of colonies of managed bee species in crops, as well as the spatial design of plants within plantations to maximize pollen flows is not standardized and growers are still experimenting. Here, we propose a spatially explicit simulation model to test which spatial arrangement of hives and plants maximizes pollination services. We used apple orchards pollinated by honey bees as a case study. We found that the spatial arrangement of plants within plantations affects both the mean level and homogeneity of the pollination in apple orchards. Bees’ hive locations, on the other hand, only affected the mean levels of pollination. Our results showed that simulation models are powerful tools to provide management recommendations to farmers. Simulation model / pollination / apple orchards / honeybee hives
1. INTRODUCTION
Human demands for food coming from pollinator-dependent crops are increasing globally (Aizen et al.2008). During the last 50 years, the fastest way to achieve this need was to increase the size and the number of cultivated areas, and thus, replace natural habitats for croplands (Meyer and Turner1992; Aizen et al.2008). This contin-uous and growing replacement is one of the main causes of biodiversity loss at the global scale
(Matson et al.1997; Benton et al.2003), and also causes the decline of native pollinators popula-tions (Garibaldi et al.2011a). One solution for this trade-off between food production and habitat replacement could be the use of more efficient pollination practices, attempting to increase the yield per cultivated area.
To maximize the production of pollinator-dependent crops, the quantity and quality compo-nents of the pollination services need to be ful-filled (Ashman et al. 2004; Aizen and Harder
2007). The quantity component refers to the ratio between the number of ovules and the number of pollen grains deposited. When pollinators are scarce, flowers receive an insufficient quantity of pollen grains to fertilize all their ovules. Under this scenario, the quantity component of the pol-lination is limited, and the plant will develop less
Electronic supplementary material The online version of this article (https://doi.org/10.1007/s13592-018-0582-2)
seeds or fruits than it would have with adequate pollinator levels and pollen deposition (Knight et al.2005). For this reason, many studies attempt to estimate the abundance of pollinators needed to ensure adequate pollination (Martins et al. 2015; Cunningham et al.2016; Geslin et al.2017). The quality component of the pollination refers to both self-fertilization and mating with related plants which can reduce fruit and/or seed production (Griffin and Ecker 2003; Herlihy and Ecker
2004). For self-incompatible crops, this quality component plays a major role in fruit and/or seed production because these plants require pollen from a different variety (Ramirez and Davenport2013). Therefore, to maximize pollen flows through the foraging movements of bees, farmers must grow different tree varieties in the same plantation. How-ever, the spatial design of trees within a plantation is not yet standardized and growers are still experimenting (see Morse and Calderone2000).
The apple (Malus domestica ) is one of the most important crops consumed at global scale and is cultivated in many regions of the world (FAOStat2013; Reganold et al.2001). Many of the varieties cultivated for fruit production are self-incompatible and depend on pollen from pol-linizer trees (i.e., apple trees from different, but compatible, varieties) to perform adequate polli-nation (Janick et al.1996, Quinet et al.2016, Sapir et al.2017). Therefore, this crop is highly depen-dent on the biotic transfer of pollen between vari-eties. Although many different wild bees have been described to contribute substantially with the pollination of apple orchards (Bosch and Vicens 2000; Martins et al. 2015; Garratt et al.
2016; Blitzer et al.2016; Campbell et al.2017), the managed honey bee (Apis mellifera L.) is commonly described as the most valuable polli-nator for this crop (Free 1993; Morse and Calderone2000; Ramirez and Davenport2013). Moreover, in some regions where wild pollinators are scarce, the growers relay almost entirely on the managed honey bees to pollinate their crops (Blanche et al. 2006, Cunningham et al. 2016, Geslin et al.2017). To obtain high-quality market fruits, flowers from producer apple trees need to receive > 10 pollen grains from pollinizer trees to fecundate all their ovules (Janick et al. 1996, Jackson 2003). Although pollen flows between
pollinizer and producer trees in apple orchards is quite relevant, only a few studies have evaluated the distribution between pollinizer and producer trees that allows for adequate pollen flow (see Matsumoto et al.2008; Kron et al.2001b). More-over, there is still a lack of studies focused on how the spatial design of trees in orchards and honey bees’ hive locations modify the quantity and qual-ity of pollination. This gap of relevant information is likely due to the extreme complexity of study-ing this spatial process at a large scale (i.e., or-chards) and the difficulties associated with treat-ment replications (Lutman and Sweet2000).
Here, we developed a spatially explicit simula-tion model to examine which spatial design of pollinizer trees and hive locations maximizes the pollination services in apple orchards. Our model describes honey bee foraging behavior (e.g., movement decisions within the plantation) and pollination process (pollen removal and deposi-tion). We simulated the movement of foraging honey bees under three commonly used spatial designs of trees, combined with three scenarios of hives locations. The simulation of bee move-ment and pollen deposition, paired with the spatial design of trees and hives, will allow us to deter-mine the quality and quantity components of the pollination services.
2. METHODOLOGY 2.1. Crop and study system
Argentina and Chile are the main apple (Malus domestica L.) producers in South America. In Argentina, the area of Alto Valle de Río Negro and Neuquén is the most important region of apple production in Argentina (Geslin et al.
2017). The main apple varieties cultivated are BGolden Delicious^ and BRed Delicious,^ both of which are self-incompatible. This means that pollinizer trees and pollinators are required for pollination and, subsequently, fruit production.
Currently, farmers of the Alto Valle region commonly use one of the following three spatial designs of producer and pollinizer trees within their plantation: (1) pollinizers trees located in continuous rows on the edge of plantations; (2) pollinizer trees in continuous but alternating rows
(usually the most common management practice employed); and (3) pollinizer trees in rows intermixed with producer trees (the less common management employed). To ensure high pollen flows between pollinizer and producer trees, farmers hire beekeepers to perform active management of honey bees. Indeed, in the region, Geslin et al. (2017) found that 100% of total pollinator visits to apple flowers were made by managed honey bees. Farmers employ three to six hives per cultivated hectare, which corre-sponds with values recommended worldwide (McGregor 1976, Free 1993, Stern et al. 2001, Geslin et al.2017, Sapir et al.2017). Beekeepers commonly locate the hives in groupings alongside roadways that run along the edges of plantations, in order to facilitate management practices.
2.2. Simulation model
We developed a spatially explicit, stochastic simulation of the honey bee’s movement behavior and the resultant pollen deposition on apple flowers. All functional forms and parameter values were extracted from field observations or obtained from literature. To assess the effects of parameter values on pollen deposition patterns, we performed a sensitivity analysis (see
Appendix A), and for the parameters that were the most sensitive, we performed a validation analysis (seeAppendix B).
2.3. Bees behavior
All simulated bees started their foraging period from a fixed position representing the hive (see more details in simulation experiment), and their probability of moving from one tree to another was modeled as a multinomial distribution where each tree had a probability of secondary visitation. The probability of each tree was estimated as an expo-nential decay function depending on the distance from each tree to the bees’ current position (Crane and Mather1943; Morris1993; Cresswell2005):
pi ¼ e−β*Dij;
where piis the probability of each tree to be visited
by a bee,Dijis the distance from the i th tree to the
tree where the bee is located, andβ is the decay rate of the tree’s attraction. We assumed that there was no limitation on resources for bees and that all trees possess similar quantities of pollen. The ex-ponential decay function was selected to represent the optimal foraging behavior of bees, where the costs of flight are reduced by minimizing the dis-tance between successive visits (Pyke1978). The
parameter β was set as fixed value of 0.9 (see
Morris1993), to represent the following behaviors: (i) each bee performs several successive visits at the same tree before moving to another and (ii) move-ments between trees in the same row are more probable than movements between rows, an as-sumption that reflects the typical foraging behavior of honey bees in orchard crops (see Greenleaf and
Kremen 2006; Brittain et al. 2013, and model
validation inAppendix A).
In this model, we only simulated the pollen flows from pollinizer to producers’ trees (which represent the quality component of the pollination), because of the high levels of self-incompatibility in apple or-chards (Janick et al. 1996; Kron et al. 2001a; Ramirez and Davenport2013). During the simula-tion, every time a bee visits a pollinizer tree it collects a quantity of pollen sampled from a Poisson distribution with λc (i.e., mean number of pollen
grains collected) equal to 800 (see Thomson and Goodell2001). In addition, every time a bee visits a tree (irrespectively of tree type), it deposits a quantity of pollen that is under aBdilution effect^:
dilution¼ e−γ*n:visits producer λdiluted¼ λd*dilution
In absence of dilution, bees sampled from a Poisson distribution with the mean number of pollen grains deposited (λd) equal to 50 (see Thomson and
Goodell 2001). However, we assumed that the amount of pollen from pollinizer trees on bees’ bodies decreases geometrically during successive visits to producer trees (i.e., pollen carryover, see Thomson and Plowright 1980; Cresswell et al. 2002). The decrease rate (γ) of this dilution function was 0.33 following Thomson and Plowright 1980. This dilution effect represents the proportion of pollen available for the next visit to a tree, tending to zero when the number of successive
visits of a bee to a producer tree (n.visits_producer ) increases and to 1 when it visits a pollinizer tree. On the other hand, if the quantity of pollen grains that a bee should deposit on a tree is higher than the amount of pollen on its body, the bee will deposit only the number of pollen grains that it was carrying. The model recorded (i) the spatial coordinates (i.e., location of all visited trees) of each bee; (ii) the number of pollen grains carried and deposited by each bee in all of the visits performed; (iii) the number of pollen grains deposited on all trees; and (iv) the number of pollen grains collected from each pollinizer tree. Simulated bees were active for 3 days, the average flower stigmatic receptiv-ity (Losada and Herrero2013). At the beginning of each simulated day, bees started from the posi-tion of the hives, and performed a number of visits sampled from a Poisson distribution withλvisits=
700, which is the average value of observed visits per day per bee to multiple apple trees (Free1966, Tofilski2000). This stochasticity in the number of visits performed daily by bees allowed us to in-corporate the variability of bees’ activities and behaviors on real systems that could be caused by climatic conditions among others (Free1966).
3. ORCHARDS
Simulated apple orchards followed the spatial pattern used by farmers: a field of 1 ha with tree rows spaced 4.5 m apart and individual trees spaced 3 m apart. This design resulted in a tree density of 782 trees . ha−1, which is consistent with the densities observed commonly on apple orchards worldwide (see Brittain et al. 2013; Viana et al.2014). In order to avoid the confound-ing effects of the proportion of the different tree types, we kept constant the ratio pollinizer/ producer trees of 0.21 in all simulated orchards. Moreover, for each tree, the model assigned a number of flowers sampled from a Poisson distri-bution with an average of 1500 flowers.
3.1. Hives
Simulated honey bee hives consisted inBboxes^ located in one or more positions of the orchard depending on the scenario (see more details in sim-ulation experiment below), where the bees started
their foraging trips every day. The number of forag-ing honey bees per hive was sampled with a Poisson distribution with itsλb(i.e., mean number of bees)
equal to 2000 (Free1958,1959). This stochasticity in the number of forager bees per hive allowed us to incorporate the variability of Bhive quality^ (Free
1966, Geslin et al.,2017). 3.2. Simulation experiment
We performed simulation experiments following a factorial design that considered the effect of plan-tation design (i.e., planplan-tation design scenarios) and hive locations (i.e., hive scenarios), resulting in nine different combined scenarios (Figure 1). We con-structed the following plantation scenarios: (i) the first scenario was shaped with the pollinizer trees in rows located at the edges of the plantation (first and last two rows of the crop), with the producer trees between the pollinizers (Figure1, panels 1); (ii) the second scenario presented the pollinizer trees in continuous rows, interspersing five rows of produc-er trees with one pollinizproduc-er (Figure1, panels 2); and (iii) the third scenario, a mixture of pollinizers and producer trees within the same row (Figure 1, panels 3). The hive scenarios developed were (i) all the hives were located at a unique position on one side of the plantation (Figure1, panels A); (ii) hives were located at several positions along one side of the plantation (Figure1, panels B); and (iii) each hive was located at the middle of each one of the four sides of the plantation (Figure1, panels C). We ran ten model replicates for each of these nine scenarios. Afterwards, we estimated the total number of pollen grains deposited on each tree during the flowers’ lifespans and divided that value by the total number of flowers present in each tree, assuming that each flower receives the same number of pollen grains. Because apple flowers had ten ovules, we considered flowers to be pollen-limited if they received less than ten pollen grains. This limit is highly conservative, because most flowers need more than one pollen grain per ovule (Harder et al.2016).
Using the data obtained from the ten replicates of each scenario, we analyzed the effects of trees’ spatial designs and hives’ locations on (1) the mean levels of pollination (i.e., number of pollen grains per flower) and (2) the spatial homogeneity
of pollination (i.e., spatial distribution of pollen among plants). For the mean levels of pollination, we used the number of pollen grains per flower as our response variable, which resulted in a contin-uous response variable. We fitted a mixed-effects model with Gaussian error distribution using the lmer function from lme4 package (Bates et al.
2015) of the R software (version 2.15.1). To com-ply with model assumptions, we applied a ln + 1 transformation to the data. Spatial design of pol-linizer trees and hive locations were included as interactive fixed effects, and the replicate for each scenario as a random effect, allowing the intercept to vary among replicates. As a posterior test, we performed least-squares means test from the
lsmean package (Lenth,2016) using lsmean and cld functions.
On the other hand, to estimate if there were differences between the spatial design of pollinizer trees and hive locations on the spatial homogeneity of the pollination, we performed homogeneous spatial point pro-cesses analyses (see Hooten et al. 2017). We used the location of all trees that were not suffering pollen limitation (i.e., receiving more than ten pollen grains per flower) to estimate the Ripley’s K -statistic for each sce-nario (Kobs), which describes the degree of
homogeneity of pollen deposition between trees. These observed values were compared
Figure 1. The nine combined simulated scenarios of spatial designs of pollinizer-producer trees (big black and small gray points, respectively) and hives’ locations (squares). Plantation scenarios were identified with a number that indicates the spatial design of pollinizer trees, and a letter that indicates the spatial location of hives. This resulted in the following lists of numbers and letters (1) pollinizer trees on the edges of the plantation, (2) pollinizer trees in continuous rows, alternating pollinizer with producer, and (3) pollinizer trees in rows mixed with producer trees; (A) all the hives located at a unique position at one side of the plantation, (B) all the hives located at several positions along one side of the plantation, and (C) hives located at each of the four sides of the plantation.
with a null model of complete spatial ran-domness (CSR) using a Kolmogorov-Smirnov test (Baddeley 2008). Data analyses were carried out with the package spatstat (Baddeley and Turner 2005) of R software (version 2.15.1), using the ppp , Kest , and kstest.ppp functions.
4. RESULTS
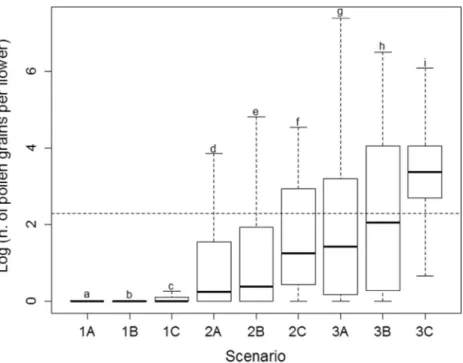
The mean levels of pollination of producer trees (i.e., number of pollen grains deposited per flower) varied significantly with both plant-ing design of pollinizer trees and hive location (TableI). The scenario with the highest levels of pollen deposition was the 3C (i.e., pollinizers and producer trees within the same row mixed, and hives located at each one of the sides of the plantation) with a mean of 31.5 pollen grains per flower (lower CL = 29, upper CL = 32) (Fig-ure 2, Table I). This was the scenario with a lower proportion of flowers (14%) exhibiting pollen limitation (Figure2, almost all the flowers are above the dotted line). On the other hand, the scenario with lowest levels of pollen deposition was the 1A (i.e., pollinizer trees at the edge and all the hives in one side of the plantation) with a mean of 1.08 pollen grains per flower (lower CL = 1.05, upper CL = 1.1) (Figure2, TableI), and all flowers suffering pollen limitation.
The spatial stability of pollination varied with the planting design of pollinizer trees but not with
the hive’s location (Figure3, TableII). The only planting design scenario that ensured a homoge-neous effective pollination was the mixing of pollinizer and producer trees within the same row (i.e., scenario 3), and was independent of hive location (Figure3, TableII).
5. DISCUSSION
Simulation models serve as excellent tools to study pollen flows in crop plants, mainly because of the complex nature of studying this process at large spatial scales (i.e., plan-tations and orchards) (Morris 1993; Cresswell et al. 2002; Walklate et al. 2004; Cresswell
2005, Lutman and Sweet 2000). The simula-tion model presented here allows for a com-parison of the pollination services to apple orchards under different spatial designs of pollinizer trees and hive locations. Although the results showed that both variables are relevant for the ecosystem service of pollina-tion to apple trees, the spatial design of pollinizer trees affected not only the mean levels of pollen deposition but also ensured spatial homogeneity of pollination services. These results have strong implications for the future management practices of apple orchards worldwide through providing rele-vant information on how to maximize polli-nation services and subsequent fruit quality.
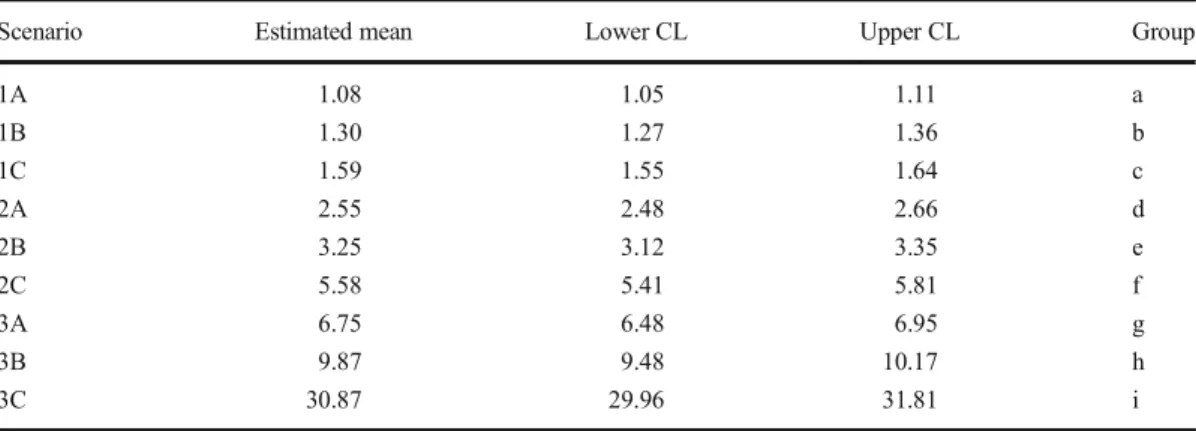
Table I. Least-squares means posterior test for the mean levels of pollen deposited per flower under the different scenarios of spatial distribution of pollinizer trees and hives’ locations. Estimated means and 95% Confidence Levels (CL) were back-transformed from log scale to the original units to aid their interpretation.
Scenario Estimated mean Lower CL Upper CL Group
1A 1.08 1.05 1.11 a 1B 1.30 1.27 1.36 b 1C 1.59 1.55 1.64 c 2A 2.55 2.48 2.66 d 2B 3.25 3.12 3.35 e 2C 5.58 5.41 5.81 f 3A 6.75 6.48 6.95 g 3B 9.87 9.48 10.17 h 3C 30.87 29.96 31.81 i
After hundreds of years of apple cultivation, growers are still experimenting with planting de-signs in self-incompatible varieties (see Morse and Calderone,2000). Our simulation model identifies the mixing of pollinizer and producer trees within the same row as the most effective planting design to maximize pollination. This planting design showed the highest level of pollen deposition and a homogeneous spatial distribution of pollen; the two variables needed for adequate pollination, and high-quality fruit production (Garibaldi et al.
2011a, b). Although this planting management seems to be the most efficient from a pollination point of view, the harvesting process using com-bine machines might not be efficient, because the combine cannot discriminate between pollinizer and producer trees, and thus will mix the fruits of different tree varieties. However, in fields that har-vest is done manually, this planting design will allow the farmers to maximize their production without any additional investments. In contrast, the plantation design with pollinizer trees at the
Figure 2. Box-plot of pollen grains deposited per flower for the nine scenarios (see description in Figure1). The horizontal dotted line indicates the minimum number of pollen grains per flower needed to fecundate all ovules and develop high-quality fruits (see M&M). Lowercase letters above the boxes indicate statistically significant differ-ences between scenarios. This shows that the amount of pollen deposited per flower in producer trees depends on the spatial designs of pollinizer trees and hives’ locations.
Table II. Kolmogorov-Smirnov test for the spatial homo-geneity of pollination. The null hypothesis establishes that trees with adequate pollination are homogeneously distrib-uted in space (i.e., no clustering). Plantations mixing pol-linizers and producer trees within the same row (i.e., scenarios 3), regardless of hives’ locations, were the only scenarios that ensured a homogeneous spatial distribution of pollen deposition. The spatial homogeneity analysis for the scenario 1A was not possible because none of the trees received sufficient pollen (see M & M).
Scenario D statistic P value
1A NA NA 1B 0.49 < 0.01 1C 0.49 < 0.01 2A 0.21 < 0.01 2B 0.13 0.03 2C 0.14 < 0.01 3A 0.06 0.31 3B 0.04 0.64 3C 0.03 0.35
edges showed the lower and more clustered levels of pollination, evidencing pollen limitation in most of the trees, particularly in those located in the central region of the orchard. This result is consis-tent with that found by Kron et al. (2001 a, b) that showed that pollen is dispersed, on average, be-tween two or three rows from the pollinizer trees. For this reason, we strongly recommend avoiding this spatial design of trees when establishing a new self-incompatible apple orchard. For already established orchards that cannot change the spatial design of trees, we recommend locating beehives more dispersed around the orchard.
As stated above, hive location is also an important factor in determining the quality of the pollination services in apple orchards. The model showed that when hives were located at all the edges of the plantation, the mean levels of pollination increased, in-dependently of the tree planting design. This result should be considered by farmers who are paying for pollination services, because most beekeepers locate hives in groups, and mostly on only one side of the plantation near the road to facilitate accessible manage-ment. Although the spatial homogeneity of
Figure 3. The Y-axis shows the estimated K -statistic, and the X -axis shows the values of r (which is the distance between trees) for the nine scenarios (see description in Figure1). Black line depicted the observed Kobs, gray dotted
lines the theoretical Ktheo,and in gray are the envelopes associated to Ktheo.This figure shows that the spatial
homogeneity of pollination depends on the spatial design of pollinizer trees but not on hives’ locations. Notice that the spatial homogeneity analysis for the scenario 1A was not possible because none of the trees received a sufficient pollen (see M&M).
pollen deposition was independent of hives’ locations, it could be explained by the fact that the foraging ranges of honey bees are higher than the extent of our simulated plan-tations (i.e., 1 ha, that is a representative size of an apple orchard in the Alto Valle region). Nevertheless, hives’ locations can be more relevant in extensive orchards, where bees’ foraging movements range is smaller than plantation size (Cunningham and Le Feuvre
2013; Cunningham et al. 2016).
Maximize production and reduce yield gaps in pollinator-dependent crops is an important topic with strong implications for farmers and con-sumers globally (Garibaldi et al.2016). The mod-el presented here can serve as a useful tool to predict the quality of the pollination services in fields under different management practices. Based on our model results, for an adequate pol-lination in apple orchards, we recommend a plant-ing design of pollinizer trees mixed with pro-ducers, and hives located in all the edges of the field (i.e., homogeneously distributed in the space). Although our model has been designed specifically to model pollination in apple or-chards, it could be easily adapted to any pollinator-dependent crop, and could be used to guide efficient pollinator management practices.
ACKNOWLEDGMENTS
We acknowledge Dr. Morales Juan Manuel for his insights during the initial development of this work, and to Rachael Dickson, for her values comments that help us to improve this manuscript.
Des modèles de simulation pour prédire le succès de la pollinisation dans les vergers de pommiers: un outil utile pour tester les pratiques de gestion
Modèle de simulation / pollinisation / vergers de pommiers / ruches d’abeilles
Simulationsmodelle zur Vorhersage des Bestäubungserfolges in Apfelplantagen: Ein nützliches Instrument, um Managementpraktiken zu überprüfen
Simulationsmodel / Bestäubung / Apfelplantage/ Honigbienen
AUTHOR CONTRIBUTIONS
AS and BG designed the idea. AS, AdV, and FT designed the model. AdV and FT developed the model and analysis. All authors discussed the results and wrote the MS. All authors read and approved the final manuscript.
FUNDING INFORMATION
This work was supported by the National Research Council of Argentina CONICET.
REFERENCES
Aizen, M.A., Garibaldi, L.A., Cunningham, S.A., Klein A.M. (2008) Long-term global trends in crop yield and production reveal no current pollination shortage but increasing pollinator dependency. Current Biology 18, 1572–5.
Aizen, M.A., Harder, L.D. (2007) Expanding the limits of the pollen-limitation concept: effects of pollen quantity and quality. Ecology 88, 271–281.
Ashman, T.L., Knight, T.M., Steets, J.A., Amarasekare, P., Burd, M., et al. (2004) Pollen limitation of plant reproduction: ecological and evolutionary causes and consequences. Ecology 85, 2408–2421.
Baddeley, A., Turner, R. (2005) Spatstat: an R package for analyzing spatial point patterns. Journal of Statistical Software 12, 1–42.
Baddeley, A. (2008) Analysing spatial point patterns in R. Technical report, CSIRO, 2010. Version 4. URL https://research. csiro. au/software/r-workshop-notes. Bates, D., Maechler, M., Bolker, B., Walker, S. (2015) Fitting Linear Mixed-Effects Models Using lme4. Journal of Statistical Software 67, 1–48.
Benton, T.G., Vickery, J.A., Wilson, J.D. (2003) Farmland biodiversity: is habitat heterogeneity the key? Trends in Ecology and Evolution 18, 182–188.
Blanche, K.R., Ludwig, J.A., Cunningham, S.A. (2006) Proximity to rainforest enhances pollination and fruit set in orchards. Journal of Applied Ecology 43, 1182– 1187.
Blitzer, E.J., Gibbs, J., Park, M.G., Danforth, B.N. (2016) Pollination services for apple are dependent on diverse wild bee communities. Agriculture, Ecosystems & En-vironment 221, 1–7.
Bosch, J., Vicens, N. (2000) Pollinating Efficacy of Osmia cornuta and Apis mellifera (Hymenoptera: Megachilidae, Apidae) on 'Red Delicious' Apple. En-vironmental Entomology 29, 235–240.
Brittain, C., William, N., Kremen, C., Klein, A.M. (2013) Synergistic effects of non-Apis bees and honey bees
for pollination service. Proceedings of the Royal Soci-ety B. 280, 20122767.
Campbell, A.J., Wilby, A., Sutton, P., Wäckers, F.L. (2017) Do sown flower strips boost wild pollinator abundance and pollination services in a spring-flowering crop? A case study from UK cider apple orchards. Agriculture, Ecosystems & Environment 239, 20–29.
Crane, M.B., Mather, K. (1943) The natural cross-pollination of crop plants with particular reference to radish. Annals of Applied Biology 30, 301–308. Cresswell, F.E., Osbrone, J.L., Bell, S.A. (2002) A model
of pollinator mediate gene flow between plant popula-tions with numerical solupopula-tions for bumblebees polli-nating oilseed rape. Oikos 98, 375–384.
Cresswell, J.E. (2005) Accurate theoretical prediction of pollinator-dependent gene dispersal. Ecology 86, 574– 578.
Cunningham, S.A., Le Feuvre, D. (2013) Significant yield benefits from honeybee pollination of faba bean (Vicia faba ) assessed at field scale. Field Crops Research 149, 269–275.
Cunningham, S.A., Fournier, A., Neave, M.J., Le Feuvre, D. (2016) Improving spatial arrangement of honeybee colonies to avoid pollination shortfall and depressed fruit set. Journal of Applied Ecology 53, 350–359. FAOStat (2013) Crops. http://faostat.fao.org/site/567/
DesktopDefault.aspx?PageID=567#ancor
Free, J.B. (1958) Attempts to condition bees to visit select-ed crops. Bee World 39, 221–30.
Free, J.B. (1959) The effect of moving colonies of honey-bees to new sites on their subsequent foraging behav-iour. The Journal of Agricultural Science 53, 1–9. Free, J.B. (1993) Insect pollination of crops (No. Ed. 2).
Academic press.
Free, J.B. (1966) The pollinating efficiency of honey-bee visits to apple flowers. Journal of Horticultural Science 41, 91–94.
Garibaldi, L.A., Steffan-Dewenter, I., Kremen, C., Morales J.M., Bommarco, R., et al. (2011a) Stability of polli-nation services decreases with isolation from natural areas despite honey bee visits. Ecology Letters 14, 1062–72.
Garibaldi, L.A., Aizen, M.A., Klein, A.M., Cunningham, S.A., Harder, L.D. (2011b) Global growth and stability of agricultural yield decrease with pollinator depen-dence. Proceedings of the National Academy of Sci-ence of the United States of America 108, 5909–5914. Garibaldi, L.A., Carvalheiro, L.G., Vaissière, B.E., Gemmill-Herren, B., Hipólito, J., et al. (2016) Mutu-ally beneficial pollinator diversity and crop yield out-comes in small and large farms. Science 351, 388–391. Garratt, M.P.D., Breeze, T.D., Boreux, V., Fountain, M.T., McKerchar, M., et al. (2016) Apple pollination: de-mand depends on variety and supply depends on pol-linator identity. Plos One,11, e0153889.
Geslin, B., Aizen, M.A., Garcia, N., Pereira, A.J., Vaissiere, B.E. et al. (2017) The impact of honey bee colony quality on crop yield and farmers’ profit in apple and
pears. Agriculture, Ecosystem & Environment 248, 153–161.
Greenleaf, S.S., Kremen, C. (2006) Wild bees enhance honey bees’ pollination of hybrid sunflower. Proceed-ings of the Royal Society B. 103, 13890–13895. Griffin, C.A.M., Eckert, C.G. (2003) Experimental analysis
of biparental inbreeding in a self-fertilizing plant. Evo-lution 57, 1513–1519.
Harder, L.D., Aizen, M.A., Richards, S. A. (2016) The population ecology of male gametophytes: the link between pollination and seed production. Ecology Let-ters 19, 497–509.
Herlihy, C.R., Eckert, C.G. (2004) Experimental dissection of inbreeding and its adaptive significance in a f l o w e r i n g p l a n t , A q u i l e g i a c a n a d e n s i s (Ranunculaceae). Evolution 58, 2693–2703. Hooten, M.B., Johnson, D.S., McClintock, B.T., Morales,
J.M. (2017) Animal movement: statistical models for telemetry data. CRC Press.
Jackson, J.E. (2003) Biology of Apples and Pears. Cam-bridge University Press, CamCam-bridge.
Janick, J., Cummins, J.N., Brown, S.K., Hemmat, M. (1996) Apples, p. 1–77. In: J. Janick and J.N. Moore (eds.). Fruit breeding, Vol. I. Tree and tropical fruits. Wiley, New York.
Knight, T.M., Steets, J.A., Vamosi, J.C., Mazer, S.J., Burd, M., et al. (2005) Pollen limitation of plant reproduc-tion: pattern and process. Annual Review of Ecology, Evolution, and Systematics 36, 467–497.
Kron, P., Husband, B. C., Kevan, P. G., Belaoussoff, S. (2001a) Factors affecting pollen dispersal in high-density apple orchards. HortScience 36, 1039–1046. Kron, P., Brian, C., Peter, G., Kevan, G. (2001b)
Across-and along-row pollen dispersal in high-density apple orchards: insights from allozyme markers. Journal of Horticultural Science and Biotechnology 76, 286–294. Lenth, R.V. (2016) Least-squares means: the R package
lsmeans. Journal of Statistical Software 69, 1–33. Losada J.M., Herrero M. (2013) Flower strategy and stigma
performance in the apple inflorescence. Scientia Horticulturae 150, 283–289.
Lutman, P.J.W., Sweet, J.B. (2000) Field experiment programmes in Great Britain to evaluate the environ-mental and agronomic consequences of growing her-bicide tolerant crops. In Proc. XI Coll. Int. sur la Biologie des Mauvaises Herbes Dijon (ed. J. P. Lonchamp), pp. 643–650. Paris: AFPP.
Martins, K.T., Gonzalez, A., Lechowicz, M.J. (2015) Pol-lination services are mediated by bee functional diver-sity and landscape context. Agriculture, Ecosystem & Environment 200, 12–20.
Matson, P.A., Parton, W.J., Power, A.G., Swift, M.J. (1997) Agricultural intensification and ecosystem properties. Science 277, 504–509.
Matsumoto, S., Eguchi, T., Maejima, T., Komatsu, H. (2008) Effect of distance from early flowering pollin-izers‘Maypole’and ‘Dolgo’on ‘Fiji’fruit set. Scientia Horticulturae 117, 151–159.
McGregor, S.E. (1976) Insect pollination of cultivated crop plants (Vol. 496). Washington (DC): Agricultural Re-search Service, US Department of Agriculture. Meyer, W.B., Turner, I.I.B.L. (1992) Human population
growth and global land-use/cover change. Annual Re-view of Ecology and Systematics 23, 39–61. Morris, W.F. (1993) Predicting the consequence of plant
spacing and biased movement for pollen dispersal by Honey Bees. Ecology 74, 493–500.
Morse, R.A., Calderone, N.W. (2000) The value of honey bees as pollinators of U.S. crops in 2000. Bee Culture 128, 1–15.
Pyke, G.H. (1978) Optimal foraging: movement patterns of bumblebees between inflorescences. Theoretical Pop-ulation Biology 13, 72–98.
Quinet, M., Warzée, M., Vanderplanck, M., Michez, D., Lognay, G., et al. (2016) Do floral resources influence pollination rates and subsequent fruit set in pear (Pyrus communis L.) and apple (Malus x domestica Borkh) cultivars? European Journal of Agronomy 77, 59–69. Ramírez, F., Davenport, T.L. (2013) Apple pollination: A
review. Scientia Horticulturae 162, 188–203. Reganold, J.P., Glover, J.D., Andrews, P.K., Hinman, H.R.
(2001) Sustainability of the three apple production systems. Nature 410, 926–930.
Sapir, G., Baras, Z., Azmon, G., Goldway, M., Shafir, S., et al. (2017) Synergistic effects between bumblebees
and honey bees in apple orchards increase cross polli-nation, seed number and fruit size. Scientia Horticulturae 219, 107–117.
Stern, R., Eisikowitch, D., Dag, A. (2001) Sequential introduction of honeybee colonies and doubling their density increases cross-pollination, fruit-set and yield in ‘Red Delicious’ apple. The Journal of Horticultural Science and Biotechnology 76, 17–23.
Thomson, J.D., Goodell, K. (2001) Pollen removal and deposition by honeybee and bumblebee visitors to apple and almonds flowers. Journal of Applied Ecolo-gy 38, 1032–1044.
Thomson, J.D., Plowright, R.C. (1980) Pollen carryover, nectar rewards, and pollinator behavior with special reference to Diervilla lonicera . Oecologia 46, 68–74. Tofilski, A. (2000) Senescence and learning in honeybee (Apis mellifera ) workers. Acta Neurobiologiae Experimentalis 60, 35–39.
Viana, B.F., da Encarnação Coutinho, J. G., Garibaldi, L. A., Gastagnino, B.G.L., Gramacho, K.P., et al. (2014) Stingless bees further improve apple pollination and reproduction. Journal of Pollination Ecology 14, 261– 269.
Walklate, P.J., Hunt, J.C.R., Higson, H.L., Sweet, J.S. (2004) A model of pollen-mediated gene flow for oilseed rape. Proceedings of the Royal Society B. 271, 441–449.