HAL Id: insu-00723412
https://hal-insu.archives-ouvertes.fr/insu-00723412
Submitted on 10 Aug 2012HAL is a multi-disciplinary open access archive for the deposit and dissemination of sci-entific research documents, whether they are pub-lished or not. The documents may come from teaching and research institutions in France or abroad, or from public or private research centers.
L’archive ouverte pluridisciplinaire HAL, est destinée au dépôt et à la diffusion de documents scientifiques de niveau recherche, publiés ou non, émanant des établissements d’enseignement et de recherche français ou étrangers, des laboratoires publics ou privés.
The 2010 explosive eruption of Java’s Merapi volcano - a
’100-year’ event
M. Surono, Philippe Jousset, John Pallister, Marie Boichu, Maria Fabrizia
Buongiorno, Agus Budisantoso, Fidel Costa Rodriguez, Supriyiat Andreastuti,
Fred Prata, David Schneider, et al.
To cite this version:
M. Surono, Philippe Jousset, John Pallister, Marie Boichu, Maria Fabrizia Buongiorno, et al.. The 2010 explosive eruption of Java’s Merapi volcano - a ’100-year’ event. Journal of Volcanology and Geothermal Research, Elsevier, 2012, 241-242, pp.121-135. �10.1016/j.jvolgeores.2012.06.018�. �insu-00723412�
The 2010 explosive eruption of Java's Merapi volcano – a
‘100-year’ event
Suronoa1
Philippe Joussetbc2
John Pallisterd3
Marie Boichue45
M. Fabrizia Buongiornof6 Agus Budisantosogh7 Fidel Costai Supriyati Andreastutia Fred Prataj8 David Schneiderk9 Lieven Clarissel10 Hanik Humaidag6 Sri Sumartig6 Christian Bignamf5 Julie Griswoldd3 Simon Carnm11
Clive Oppenheimereno412
Franck Lavignep
a
Center of Volcanology and Geological Hazard Mitigation, Jalan Diponegoro 57, 40122 Bandung, Indonesia
b
BRGM, RIS, 3 Avenue Claude Guillemin, BP36009, 45060 Orléans Cedex 2, France
c
Now at GFZ German Research Center in Geosciences, Telegrafenberg, 14473 Potsdam, Germany
d
U.S. Geological Survey, Cascades Volcano Observatory, 1300 SE Cardinal Court, Vancouver, WA 98604, USA
e
The University of Cambridge, Department of Geography, Downing Place, Cambridge CB23EN, United Kingdom
f
Isituto Nazionale di Geofisica e Vulcanolgia, Via di Vigna Murata 605, 00143 Rome, Italy
g
BPPTK (Balai Penyelidikan dan Pengembangan Teknologi Kegunungapian), Jalan Cendana 15, Yogyakarta 55166, Indonesia
h
ISTerre, CNRS, Université de Savoie, 73376 Le Bourget du Lac cedex, France
i
Earth Observatory of Singapore, Nanyang Technological University N2-01a-10, Singapore 639798
j
Climate and Atmosphere Department, Norwegian Institute for Air Research, PO Box 100, Kjeller, 2027, Norway
k
U.S. Geological Survey, Alaska Volcano Observatory, 4230 University Drive, Anchorage, AK 99508 USA
l
Université Libre de Bruxelle, Unité de Chimie Quantique et Photophysique, Campus du Solbosch, CP160/09, Avenue F.D. Roosevelt 50, 1050 Bruxelles, Belgium
m
MTU: Department of Geological/Mining Engineering & Sciences, 1400 Townsend Drive, Houghton MI 49931 USA
n
Le Studium, Institute for Advanced Studies, Orléans and Tours, France
o
L'Institut des Sciences de la Terre d'Orléans, l'Université d'Orléans, 1a rue de la Férollerie, 45071 Orléans, Cedex 2, France
p
Laboratoire de Géographie Physique, 1 Place A. Briand, 92195 Meudon Cedex, France
Abstract
Merapi volcano (Indonesia) is one of the most active and hazardous volcanoes in the world. It is known for frequent small to moderate eruptions, pyroclastic flows produced by lava dome collapse, and the large population settled on and around the flanks of the volcano that is at risk. Its usual behaviour for the last decades abruptly changed in late October and early November 2010, when the volcano produced its largest and most explosive eruptions in more than a century, displacing a third of a million people, and claiming nearly 400 lives. Despite the challenges involved in forecasting this „hundred year eruption‟, we show that the
magnitude of precursory signals (seismicity, ground deformation, gas emissions) were proportional to the large size and intensity of the eruption. In addition and for the first time, near-real-time satellite radar imagery played an equal role with seismic, geodetic, and gas observations in monitoring eruptive activity during a major volcanic crisis. The Indonesian Center of Volcanology and Geological Hazard Mitigation (CVGHM) issued timely forecasts of the magnitude of the eruption phases, saving 10,000–20,000 lives. In addition to reporting on aspects of the crisis management, we report the first synthesis of scientific observations of the eruption. Our monitoring and petrologic data show that the 2010 eruption was fed by rapid ascent of magma from depths ranging from 5 to 30 km. Magma reached the surface with variable gas content resulting in alternating explosive and rapid effusive eruptions, and released a total of ~ 0.44 Tg of SO2. The eruptive behaviour seems also related to the seismicity along a tectonic fault more than 40 km from the volcano, highlighting both the complex stress pattern of the Merapi region of Java and the role of magmatic pressurization in activating regional faults. We suggest a dynamic triggering of the main explosions on 3 and 4 November by the passing seismic waves generated by regional earthquakes on these days.
Highlights
► First scientific results from largest eruption in 100 years of Merapi volcano. ► Gas emissions were much higher than recorded at Merapi during past eruptions. ► Deep influx of gas-rich mafic magma triggered the eruption. ► Presence of an exsolved fluid phase co-existent with the pre-eruptive magma body. ► Eruption warnings by CVGHM and international team saved 10,000-20,000 lives.
Keywords Merapi; gas emissions; satellite imagery; volcano-seismology; deformation; petrology; international collaboration
1. Introduction
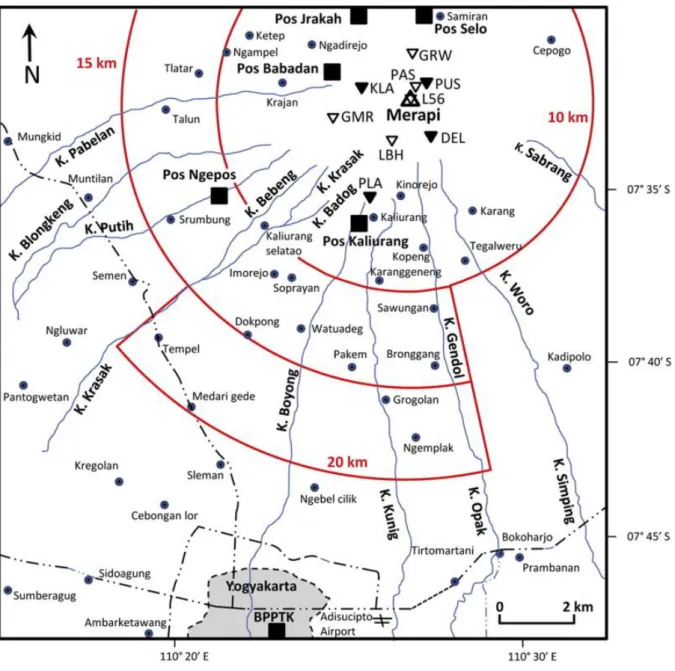
Merapi stratovolcano is located 25–30 km north of the metropolitan area of Yogyakarta, Indonesia (Fig. 1) and the environs are home to around of 1.6 million people. It overlies the Java subduction zone and is composed mainly of basaltic-andesite tephra, pyroclastic flow, lava, and lahar deposits. Eruptions during the twentieth century typically recurred every 4 to 6 years and produced viscous lava domes that collapsed to form pyroclastic flows and subsequent lahars. These eruptions were relatively small, with typical eruptive volumes of 1– 4 × 10⁶ m3 and magnitudes or volcanic explosivity indices (VEI) of 1–3 ( [Andreastuti et al., 2000], [Camus et al., 2000], [Newhall et al., 2000], [Voight et al., 2000a] and [Voight et al., 2000b]), where magnitude (Pyle, 2000) is given by [Me = log10(mass of products in kg) – 7]. Merapi volcano has been studied extensively by Indonesian and international teams, leading to improved understanding of the volcano's seismology ( [Hidayat et al., 2000],
[Ratdomopurbo and Poupinet, 2000] and [Senschönefelder and Wegler, 2006]), deformation ( [Beauducel and Cornet, 1999], [Voight et al., 2000a], [Voight et al., 2000b] and [Young et al., 2000]), potential field geophysics ( [Jousset et al., 2000], [Zlotnicki et al., 2000] and [Tiede et al., 2005]), gas emissions ( [Le Guern and Bernard, 1982], [Nho et al., 1996], [Zimmer and Erzinger, 2003], [Humaida et al., 2007], [Toutain et al., 2009] and [Allard et al., 2011]), petrology ( [Gertisser and Keller, 2002], [Gertisser and Keller, 2003], [Chadwick et al., 2007], [Deegan et al., 2010] and [Deegan et al., 2011]), physical volcanology (Charbonnier and Gertisser, 2008) and lahar inundation (Lavigne et al., 2000). Merapi's high-temperature (400°– 850 °C) summit fumaroles, continuous gas emissions, and frequent small eruptions indicate an open and hot pathway for magma ascent to the near-surface. At the summit vent level, lava domes have typically plugged the uppermost part of the conduit except during eruptions when magmatic pressure built and new domes composed of mostly degassed magma extruded and collapsed or much more infrequently, gas-rich explosive eruptions occurred.
Fig. 1. Index map showing location of Merapi volcano summit and other features referred to in the text, e.g., observatory post stations (“Pos” in Indonesian), the Merapi Observatory and Technology Center (BPPTK), major drainages (abbreviated “K.” for “Kali” in Indonesian), short-period permanent seismic stations (full inverted triangles, PUS, DEL,PLA, KLA), temporary broadband stations (empty inverted triangles, LBH, GMR, GRW, PAS, L56 = WOR at summit). Cities and towns are indicated by name. In addition, hundreds of smaller villages are present on the flanks of the volcano. Major highways are indicated by heavy dashed-dotted lines and the read arcs at 10, 15, and 20 km radius distances from the summit indicate evacuation zones that were put into effect at different times during the eruptive activity (see text for details).
The lack of large explosive eruptions at Merapi during the several decades preceding 2010 is attributed to extensive degassing during ascent of the magma through the volcano's subsurface plumbing system (Le Cloarec and Gauthier, 2003). However, stratigraphic evidence shows that large explosive eruptions, such as the one that took place in 1872 (Hartmann, 1934) also occur. Because of the relatively open-pathway for magma ascent and the lack of explosive eruptions in the recent past, it was feared that precursors to such a large eruption might only
be modest and inadequately appreciated. The increasing population on the volcano flanks meant that a large eruption could result in tens to hundreds of thousands of casualties. Fortunately, although of short duration and rapidly escalating, large-magnitude precursors were recognized and identified in time to issue warnings for the impending large 2010 eruption, which had a VEI and Me of about 4.
We report on the monitoring techniques, data, and warning issues that came into play and were gathered during the 2010 eruptive sequence. Main explosive events occurred on 26 October (~ 10:00 utc), 29 October (~ 17:10–19:00 utc), 31 October (~ 7:30 and ~ 8:15 utc), 1 November (~ 3:00 utc), 3 November (~ 8:30 utc), 4 November (17:05 utc). We use a
combination of petrologic, seismologic, geodetic, and gas emission data, along with remotely sensed observations of changes in morphology and eruption rate to propose a preliminary model for this „100-year‟ eruption.
In Section 2, we describe technical details of both “traditional” monitoring methods used at Merapi volcano and “state-of-the-art” satellite observations, extensively used during the 2010 eruption. In Section 3, we describe the chronology of the eruption and how our geophysical and satellite observations were interpreted, leading to timely warnings that saved 10,000– 20,000 lives. In Section 4, a preliminary eruption model is proposed, based on our analysis of the available monitoring signals and petrological data. Finally, we suggest that the
management and decision-making during the crisis was successful thanks to a combination of long-term in-country expertise in dealing with volcanic crises and an unprecedented level of international collaboration. We conclude in summarising observations and interpretations on the eruption dynamics and propose a series of questions that need to be addressed for a better understanding of Merapi's most explosive eruption of the past 100 years.
2. Observational methods used during the 2010 Merapi eruption
Merapi has long been monitored using seismology, deformation, gas emission studies and petrology (Purbawinata et al., 1996) by CVGHM and its observatory and technology center in Yogyakarta (Balai Penyelidikan dan Pengembangan Teknologi Kegunungapian, or BPPTK). Under non-eruptive conditions, the rate of inflation/deflation (measured as change in lengths of Electronic Distance Measurement (EDM) lines between the volcano's summit and flanks) is ~ 0.003 m d- 1; the cumulative seismic energy release is less than 35 MJ d- 1 with daily averages of 5 multiphase earthquakes and 1 volcano-tectonic earthquake; the baseline SO2 flux is ~ 50–100 Mg d- 1 ( [Nho et al., 1996] and [Humaida et al., 2007]), and the long-term eruption rate is 1.2 × 10⁶ m3 y- 1 (Siswowidjoyo et al., 1995).
2.1. Geodesy
Deformation was measured using both tiltmeters near the summit and an Electronic Distance Measurement (EDM) network. The Electronic Distance Measurement (EDM) network utilized reflectors at high elevations on all flanks and measurements were carried out from five observation posts (Jrakah, Babadan, Selo, Kaliurang, and Ngepos) at distances of ~ 5– 10 km from the summit of Merapi.
2.2. Seismology
Seismic monitoring and analysis were carried out in real time and used qualitatively during the crisis to infer magmatic and eruptive processes. Earthquake activity was monitored with
four short-period (Mark Products L-4 seismometers) permanent stations (PUS, KLA, DEL, and PLA, Fig. 1) and a real-time temporary broadband seismological network of five stations: one Streikesen STS-2 (station LBH) and four Güralp CMG40T sensors (stations GMR, GRW, PAS, WOR) from July 2009 to September 2010, and then station L56 from September 2010). Seismometers installed in July 2009 were part of the MIAVITA (MItigate and Assess risk from Volcanic Impact on Terrain and human Activities) European research project (Thierry et al., 2008). Technical problems including poor synchronization (lack of GPS signal) prevented a full analysis in real-time at some stations (GMR, L56, LBH).
The seismicity at Merapi volcano during the 2010 crisis revealed that all types of earthquakes previously identified at Merapi (Ratdomopurbo and Poupinet, 2000) were represented in the 2010 activity (Budi-Santoso et al., this issue; Jousset et al., this issue): Volcano-Tectonic (VT) earthquakes, Low-Frequency earthquakes (LF), tremor, “Multiphase” earthquakes (MP), “guguran” = rock falls (RF), and Very-Long Period events (VLP). Real Time Seismic Amplitude (RSAM) data ( [Murray and Endo, 1992] and [Endo and Murray, 1999]) played a crucial role in evaluating the status of the volcano activity during the eruptive sequence. Also, as part of the MIAVITA project, a seismic station (CRM) was set-up at about 46 km south from the summit close to the Opak fault, source for a M6.3 earthquake that killed more than 6000 people during the prior eruption of Merapi volcano in 2006. During 4 November, stations PUS, KLA, and DEL, L56 and PAS were destroyed, and the remaining PLA station (at 6 km) was saturated (> 0.025 mm/s). Consequently, seismic amplitude observations at the CRM station were crucial during the climactic phase on 4 November (see Section 3).
Although close range stations have been critical for warnings and research during past small eruptions at Merapi, this eruption clearly illustrates the value of including distal as well as proximal stations in volcano monitoring networks.
To locate events, we performed seismic analysis using the STA/LTA (Short-term
Average/Long-term Average) detection technique and picked P-phases (and when possible S- phases) using an algorithm which includes an estimation of picking uncertainty (e.g., Jousset et al., 2011). We located VT earthquakes using both a linear (Lahr, 1999) and a non-linear location iterative technique, which searches for the best fit between observed (picked) travel times and synthetic travel times. The latter are computed at regularly distributed points on a 3D-grid in the volcanic edifice, where velocity and density are parameterized. Computation is performed first with a coarse grid and subsequent iterations use a refined grid set-up around the hypocenter location found at the first iteration, and a volume defined by the 68%
confidence level surface (e.g., Jousset et al., 2011). This method allows a fast hypocentre computation and can be implemented in real-time. Unfortunately, synchronization problems prevented us from implementing this technique in real-time during Merapi's eruption. Hypocentre positions were calculated as soon as possible after the eruption. Hypocentre positions are affected by lack of a detailed velocity model for shallow levels of the crust at Merapi ( [Wegler and Luehr, 2001], [Wagner et al., 2007] and [Kulakov et al., 2009]). They are located along the length of the conduit down to 8 km below the summit. The frequency content of records has been analysed through a variety of signal processing tools and methods (e.g., Lesage, 2009), including Fast Fourier Transform (FFT), complex frequency analysis (Sompi method, e.g., Kumagai et al., 2010), and particle motion analysis.
2.3. Satellite SAR, visible, and near-visible imagery
A variety of satellite data were utilized including commercial Synthetic Aperture Radar (SAR) from the COSMO SkyMed RADARSAT-2, TerraSAR-X sensors, and when weather
and orbits permitted, thermal infrared from the ASTER sensor and high-resolution visible and near-infrared data from the GeoEye 1 and WorldView-2 sensors. Cloud cover limited
exploitation of data from optical sensors. However, the radar satellites supplied frequent and detailed images of the volcano summit crater, rapidly growing lava domes, vent features, and pyroclastic flow deposits (including that of the large flow emplaced on 4 November that extended towards Yogyakarta; see Section 3). Despite cloud cover, the pyroclastic flow of 26 October was also detected by ASTER thermal sensor on 1 November. Images were available for analysis by both volcanologists at the USGS Alaska and Cascades Volcano Observatories and the Instituto Nazionale di Geofisica e Vulcanologia (INGV) in Italy, typically within 2– 6 hours of acquisition, and critical data and analyses were delivered to CVGHM within the same time periods each day or in some cases twice a day during the crisis. The commercial SAR data were collected with horizontal polarization and with beam resolutions that varied from 1–8 m, depending on acquisition mode.
2.4. Gas measurements
In-situ monitoring of volcanic gas emissions (H2O, SO2, CO2, H2S, CO, HCl, H2, O2, and CH4) was carried out by regularly collecting samples from the Woro solfatara. Sampling was done by bubbling the gas through NaOH solutions contained in evacuated flasks (Giggenbach and Goguel, 1988). Measurement of insoluble gas in the NaOH solution was carried out by gas chromatography. The dissolved gases were analyzed using spectrometric and volumetric methods.
Ground-based ultra-violet (UV) Differential Optical Absorption Spectroscopy (DOAS) measurements (Galle et al., 2003) proved highly challenging during the eruption because a wide area around the volcano was inaccessible (due to the exclusion zone), the plume was ash-rich, and the weather adverse (high humidity and frequent rainfall). Nevertheless, a combination of gas and ash plume remote sensing from the ground and satellites provided crucial information on degassing during the entire 2010 crisis. Satellite data were especially important during the most explosive phases of eruption, as they provided measurements of SO2 emissions and maps of volcanic cloud dispersal, which were used to issue advisories for aviation hazard mitigation by the Volcanic Ash Advisory Centre (VAAC) at Darwin,
Australia.
Whenever possible, DOAS observations were carried out from Babadan, Ketep and
Yogyakarta, which are 4, 9, and 28 km from the crater, respectively. Ocean Optics USB2000 spectrometers were used spanning a wavelength range of ~ 288–434 nm with a Full Width Half Maximum (FWHM) spectral resolution of ~ 0.60 nm. Spectrometers were coupled to a simple quartz-lens telescope mounted on a rotating platform, which enabled scanning of vertically rising plumes, except on 4 November where the telescope was held in a fixed position and pointed towards the dense plume. Each UV spectrum was recorded with a total integration time of a few seconds. Plume rise speeds were determined from video images, allowing an estimation of the SO2 emission rates. The true SO2 flux was under-estimated when the plume was ash-rich due primarily to hindered UV transmission through the dense plume (especially on 4 and 12 Nov).
SO2 burdens in the plume were available daily from satellites, utilizing the infrared (IR) IASI sensor (Infrared Atmospheric Sounding Interferometer, Clarisse et al., 2008) with overpasses at ~ 9:30 AM and ~ 9:30 PM local time, and every 24 h from the UV OMI sensor (Ozone Monitoring Instrument, Carn et al., 2008) with overpasses at ~ 1:30–2:00 PM local time.
Sparse data from the AIRS sensor (Atmospheric Infrared Sounder, Prata and Bernardo, 2007), with overpasses at ~ 1:30 AM and ~ 1:30 PM local time, were also available during the paroxysmal phase. OMI is able to detect SO2 emissions in the lower troposphere whereas IASI and AIRS are restricted to SO2 in the upper troposphere (above ~ 5 km altitude) or higher, where most plumes traveled during the explosive phases of the eruption. For simplicity in IASI and AIRS retrievals, we assumed a plume altitude of 16 km during the entire eruption. Plume altitudes reported by the Darwin VAAC were used to assign the appropriate SO2 altitude for OMI retrievals (~ 17 km for 4–5 November, and altitudes in the ~ 5–8 km range after 5 November). Subtracting the SO2 burdens from two consecutive images allowed us to evaluate a mean SO2 flux (on 12 or 24 h depending on the sensor), assuming negligible SO2 depletion in the plume. The OMI detection limit is roughly evaluated at ~ 200 Mg d- 1, based on estimations of the SO2 flux from ground DOAS measurements. Fluxes can be under-estimated when the satellite swath does not span the entire plume, so we restrict our evaluation of fluxes to cases when satellite swaths intersected most of the volcanic cloud. Unfortunately, the presence of a dispersed aged plume in images from 5 to 9 November impeded accurate estimation of new SO2 emissions from the volcano using IASI images. However, analysis of the area immediately downwind of Merapi with OMI data permitted estimation of SO2 release from new emissions during this period. Prior to 5 November and after 9 November, IASI could not detect any SO2 emissions, probably due to the low altitude of the plume.
2.5. Petrological methods and electron microprobe analyses
Samples were observed first with the optical microscope using reflected and transmitted light and modes counted. Textures and grain sizes and relations between minerals were recorded. Minerals and glass were analysed for Si, Al, Ti, Fe, Mn, Mg, Na, K, F, Cl, and S in polished sections using a JEOL-JXA-8530 F electron microprobe (EM) at the Nanyang Technological University (Singapore) using wavelength dispersive spectrometers. An accelerating voltage of 15 kV, current of 15 nA, and spot size of about 1 μm was used for mineral analyses. For glass the current was decreased to 10 nA, and spot sizes increased to 5 to 10 mm. Na and K were always counted first. Counting times were 10 s peaks and 5 s on backgrounds for the major elements, and up to 120 s for peaks and 60 s for backgrounds for S. Backscattered electron images, and X-ray distribution maps were also obtained with the EM. Standards used in the calibration were minerals from Astimex (albite, garnet, rutile, pyrite, olivine, sanidine, diopside, celestite, fluorite, biotite, rhodonite, and tugtupite). The calibration was checked against an in-house dacite glass standard analysed by X-ray fluorescence. Precisions vary according to concentration: major elements have 2-sigma precisions of 0.5–1%; precisions for minor elements are 5–10%.
3. 2010 eruption: monitoring, chronology, warnings, and impacts 3.1. Alert levels at Merapi volcano
The early warning system at Merapi is the same as at all volcanoes in Indonesia and is based on the analysis of instrumental and visual observations. It comprises 4 alert levels: Level I indicates the activity of the volcano is in normal state, with no indication of increasing
activity, although poisonous gases may threaten the area close to the vent or crater. Level II is set when visual and seismic data indicate that the activity is increasing. Level III is set when a trend of increasing unrest is continuing and there is concern that a dangerous eruption may occur. Level IV is set when the initial eruption starts (i.e., ash/vapor erupts which may lead to
a larger and more dangerous eruption). The alert level is declared to the public through National Agency for Disaster Management (BNPB) and the local governments. For each level, CVGHM gives recommendations for what the people living around the volcano are supposed to do. However, orders to the public such as evacuation orders are given by BNPB and local governments, which also organize evacuations.
3.2. Intrusion phase (31 October 2009 – 26 October, 2010)
EDM (Electronic Distance Measurement) data provided some of the earliest signs of
precursory unrest in November 2009, when an extended period of deflation that followed the 2006 eruption reversed to inflation. Early indications of increased seismic activity included swarms of volcano-tectonic (VT) earthquakes on 31 October 2009, 6 December 2009, and 10 June 2010. In September 2010, marked increases in ground inflation (Fig. 2), earthquake counts and seismic energy release (Fig. 3), temperature, CO2, and H2S abundances of summit fumaroles (Table 1) were observed. Based on these changes, on 20 September 2010, CVGHM raised the alert from level I (normal background conditions) to level II (increased activity) in anticipation of what many expected to be another small to moderate size eruption.
Fig. 2. Electronic Distance Measurement data for lines between observatory posts and the summit of Merapi (see Fig. 1). Reflectors near the summit of the volcano were destroyed by the eruption of 26 October, preventing further observations. Shortening of EDM lines between the volcano's summit and flanks is indicative of pressurization and inflation of the upper part of the volcano with magma, whereas increasing distances indicates deflation. (a) EDM observations for 3 lines Babadan-summit (West) Jrakah-summit (North) and Kaliurang-summit (South). "Relative Distance" refers to the change in line length with respect to time, reference taken arbitrarily on 1 September 2010. (b) Detail of the Kaliurang-summit EDM line, and displacement rate.
Fig. 3. (a) Dayly count of the seismicity recorded at Merapi during 2010 eruption. VT = Volcano-tectonic; MP = Multiphase (= Hybrid earthquake); LF = low-frequency; Rockf = Rockfall earthquakes; Pyroclastic F = Pyroclastic flows; RSAM = Real-time Seismic Amplitude Measurement. (b) Location of earthquake prior and during the eruption.
Table 1. Major-element analyses of juvenile components from pyroclastic flows from Merapi volcano and gas analyses from the summit Woro fumarole field. n.d. = not detected.* All Fe reported as Fe2O3.** Average (avg.) and standard deviation (s.d.) of analyses from 1954, 1957, 1992, 1994 and 1998 of Gertisser and Keller (2003).*** H2 + O2. Fumarole gas analyses are individual samples on 26 May and 20 October. September averages are for 3 samples analyses. On May analysis, peaks of H2 and O2 + Ar can be separated; since August 2010, H2 + O2 are analyzed together.
Year: 2010 2006 1954-1998⁎⁎ 1872 avg. s.d. SiO2 55.8 55.9 55.5 0.2 52.5 Al2O3 19.2 19.2 19.1 0.1 18.9 Fe2O3⁎ 7.78 7.45 7.53 0.07 9.51 MgO 2.33 2.36 2.42 0.02 3.47 CaO 8.27 8.23 8.22 0.08 9.55 Na2O 3.90 3.50 3.74 0.13 3.05 K2O 2.16 2.17 2.24 0.02 1.98 TiO2 0.74 0.74 0.71 0.02 0.88 P2O5 0.32 0.37 0.31 0.01 0.37 MnO 0.20 0.20 0.19 0.01 0.21
2010 fumarole gas analyses (% mo l) 26 May Sept. avg. 20-Oct. 20-Oct.
T (°C) 460 575 575 575 H2 + O2 0.07 0.0013⁎⁎⁎ 0.02⁎⁎⁎ 0.4⁎⁎⁎ N2 1.1 0.1 0.02 3.0 CH4 0.01 n.d. 0.01 0.03 CO n.d. 0.01 0.03 0.2 CO2 5.6 10 34.6 62.6 SO2 0.8 1.0 0.3 2.6 H2S 0.2 0.45 2.5 4.7 HCl 0.2 0.36 0.6 0.5 HF n.d. n.d. n.d. n.d. NH3 0.01 0.5 2.8 2.6 H2O 92 87 58.8 23.3 CO2/SO2 7 10 115 24 CO2/H2S 28 22 14 13 CO2/HCl 28 28 58 125 CO2/H2O 0.06 0.1 0.6 2.7
The period from 20 September until the initial explosive eruption on 26 October was marked by a dramatic increase in all monitored parameters (Aisyah et al., 2010; Fig. 2,
Fig. 3 and Fig. 9). No localized deformation on the northern flank was detected by the Northern EDM lines. On the contrary the rate of shortening of the line between the summit and south flank of the volcano (indicative of summit inflation) followed an exponential trend from < 10 mm d- 1 in early September to > 500 mm d- 1 just before the eruption on 26 October. The resulting cumulative shortening was ~ 3 m (Fig. 2). Typically preceding eruptions of Merapi there is significant shortening of EDM lines on the south side of the volcano while EDM lines on the north side show little change. Consequently, it is generally thought that the north side of the volcano is effectively buttressed by the adjacent northern volcano, Merbabu. Prior to the 26 October eruption, however, the seismicity rate increased and SO2 fluxes reached levels comparable to the highest rates observed during past Merapi eruptions (from 1992 to 2007) (Fig. 3 and Fig. 9). A remarkable increase in CO2/SO2 and H2S/SO2 ratios was detected in fumarole gas composition between the end of September and 20 October
(Table 1). The number of both volcano-tectonic (VT) earthquakes corresponding to shear fracturing in the edifice and multiphase events (MP, also called “hybrid” earthquakes)
corresponding to magma movement increased exponentially in October 2010 (Fig. 3). Besides the sharp increase of VT and MP events, the number and magnitude of rock falls (RF) also intensified prior to the eruption. From 1 to 18 October, more than 200 very-long-period (VLP) signals were recorded at summit stations, with some large VLP events recorded at all
broadband stations (Jousset et al., this issue).
Compared to previous eruptions, the greater frequency of earthquakes, the amplitude of released seismic energy, the rapid and large deformation (from EDM), and significant gas emissions implicated a larger volume of magma than seen in the past decades of Merapi's episodic activity. During this period of rapid escalation, on 21 October CVGHM raised the alert from level II to III (indicating a much higher level of unrest and increased likelihood of eruption). On 25 October at 18:00 local time, after seismicity and deformation increased to unprecedented levels, the alert was raised to its highest level IV and CVGHM warned that there was a high probability of a large explosive eruption, greater in magnitude than those of recent history. The level IV alert called for evacuation of several tens of thousands of people within a region extending to a radius of 10 km from the volcano's summit.
3.3. Initial explosive phase (26 October – 1 November)
The 25 October forecast proved accurate and timely as 23 h after the alert was issued, an explosive eruption began at 10:02 utc on 26 October and ended at ~ 12:00 utc. This eruption generated an ash plume that reached 12 km altitude, released SO2 emissions much larger than recorded during previous Merapi eruptions (from 1992 to 2007), and produced pyroclastic density currents that extended 8 km down the Kali Gendol and Kali Kuning drainages on the south flank of the volcano. The eruption killed the renowned mystical guardian of Merapi volcano, Mbah Marijan and 34 others who had refused to evacuate the village of Kinahrejo, located 7 km from the summit.
Repeated acquisitions of commercial Synthetic Aperture Radar (SAR) data from the
COSMO-SkyMed, RADARSAT, and TerraSAR-X satellites and delivery of these data within hours of collection enabled near real time monitoring of changes at the volcano's summit and mapping of the extent of pyroclastic density currents, despite cloud cover during much of the eruptive episode. The explosive eruptions on 26 and 31 October removed the 2006 lava dome, enlarged and deepened the summit crater, deeply incised the headwall of the Kali Gendol
drainage (Fig. 4a,b), and produced a pink (oxidized) tephra layer and clast-poor sandy pyroclastic flow deposits. Backscattered electron images obtained with the electron microprobe show that many fragments in the deposits are weathered and altered, probably derived from the old summit dome complex; however a minor component of vesicular andesite scoria may represent the initial 2010 juvenile magma. Based on analysis of radar images from before and after the eruption, we estimate that the 26 October eruption excavated ~ 6 × 10⁶ m3 of mainly non-juvenile material from the summit.
Fig. 4. Synthetic Aperture Radar (SAR) images of the summit of Merapi volcano before and after the times of the 26 October explosive eruption and the 4 November explosive eruptions. For clarity,
images are oriented with respect to line of sight of the radar. Arrows indicate north (N) direction and approximate scale. G (Kali Gendol), K (Kali Kuning), Kj (Kinahrejo). a, RADARSAT image, 11 October, 2009. Arrow indicates the 2006 lava dome. b, TerraSAR-X image, 26 October, showing new summit crater (arrow) produced by explosive eruption of 26 October. c, TerraSAR-X image, 4 Nov 2010, showing large (~ 5 × 10⁶ m3) lava dome (D). Pyroclastic flow deposits (PF) from the 26 October eruption appear dark in the radar images. d, enlargement of the summit area of image a. e,
RADARSAT image of 5 November, 2010, showing pyroclastic flow deposits (PF, dark grey) and surge deposits (S, light grey). These deposits formed earlier during the main phase of the 4–5 November explosive eruption. An enlarged, elongate crater, produced by the November 4–5 eruption is also evident at the summit. f, enlargement of the summit area of image c.
A period of relative quiescence ensued on 26–28 October and was followed by smaller explosive eruptions on 29 October (~ 17:10–19:00 utc), 31 October (~ 7:30 and ~ 8:15 utc) and 1 November (~ 3:00 utc). More than 150 large low-frequency (LF) earthquakes (with dominant frequencies ~ 2 Hz) occurred between 29 October and 3 November. Following Chouet (1996), we attributed these LF earthquakes to movement of gas and magma within the edifice (Jousset et al., this issue).
These observations confirm that the 2010 eruption did not begin with extrusion of lava (which characterized the recent eruptions of Merapi volcano) but instead with an explosive cratering event. They also raised CVGHM concerns that the 2010 eruption could be larger than those of the past century.
3.4. Magmatic phase (1 November – 7 November)
Satellite radar imagery revealed that the dome growth during the period 1–4 November was extremely rapid for Merapi. The average rate for this period was 25 m3 s- 1, two orders-of-magnitude greater than during recent dome-building eruptions (Hammer et al., 2000), and an order-of-magnitude greater than the relatively rapid rates inferred to have taken place at Merapi during the most explosive eruptive episodes of the 19th century ( [Hartmann, 1935] and [Newhall and Melson, 1983]). Between 1 and 4 November, the new summit lava dome grew to ~ 5 × 10⁶ m3 in volume (Fig. 4c,d). The initial period of this rapid dome growth was accompanied by a relatively low level of SO2 degassing compared to the more explosive phases of the eruption (Fig. 9).
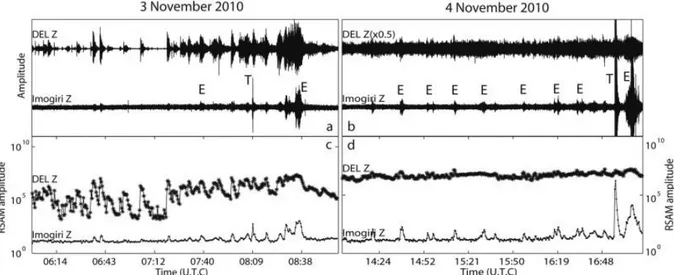
On 3–4 November, eruptive intensity increased again with stronger degassing and a series of explosions, some of which could be heard in Yogyakarta. Early on 3 November, data from close-range seismic stations became saturated (> 0.025 mm/s) due to increased intensity of tremor (corresponding to continuous eruption and strong degassing). Seismic signals from the Imogiri station, located 46 km south of summit, showed increased amplitude that correlated with RSAM peaks from proximal stations, which were attributed to the repeated explosions (Fig. 5a,c). SO2 emission rates a few orders of magnitude higher than recorded in previous eruptions were detected (Fig. 9). A large explosion occurred on November 3 at 08:40 utc (Fig. 5). CVGHM recommended extending the evacuation zone on the west and south from 10 km to 15 km on 3 November at 9:05 utc, which increased the number of displaced people to more than 100,000. Pyroclastic flows on 3 November reached 12 km (at 10:30 utc), without
casualties. Intense volcanic tremor continued after the explosion, indicating continuous eruption, and continuous pyroclastic flows.
Fig. 5. Record of the seismic amplitude at Imogiri station located 46 km south of Merapi volcano. a, Normalised vertical component signals recorded at a proximal station (DEL, Deles, 4 km from Merapi's summit) and at a distal station (CRM, Imogiri, 46 km south) during the 3 November explosion sequence. T symbols indicate small (M < ~ 1) tectonic earthquakes on the Opak fault, E symbols indicate explosions at the Merapi volcano summit. b, same as a for data from 4 November. c, RSAM computed for stations DEL and CRM (Imogiri) on 3 November. Note that RSAM at DEL is multiplied by 108 for clarity. d, same as c for data from 4 November.
On 4 November, the tremor increased again and was felt as Mercalli intensity 2–3 shaking at 10–20 km from the volcano. All four proximal real-time seismic stations were completely saturated (> 0.025 mm/s). Seismic amplitudes from the distal Imogiri station at the time of the climactic explosion (4 November at ~ 17:05 utc) were up to 5 times larger than signals
associated with the 3 November explosion (Fig. 5b,d). This observation, along with unusually rapid rates of dome extrusion recognised in satellite data from the preceding 3 days, prompted the decision to extend the exclusion zone again, from 15 to 20 km on the southwest and south (Fig. 1).
The intermittent and sometimes sustained explosive eruptions during the night (local time) of 4–5 November (included the climactic eruption on 4 November at 17:05 utc) produced an ash column that ascended to 17 km altitude along with a pyroclastic flow that travelled ~ 16 km along the Kali Gendol drainage in the direction of Yogyakarta (~ 15 km radial distance from the summit). These events took place several hours after the evacuation zone was extended to 20 km (Figs. 4c and 6). The flows and related surges of 4–5 November destroyed numerous evacuated villages over a broad area of the upper slopes of the volcano and in an overbank-surge area of ~ 13 km2 (Figs. 4e, 6a) lower on the flank, including the village of Bronggang, where unfortunately, evacuations had not yet taken place and many of the 367 fatalities occurred. Additional pyroclastic flows traveled lesser distances along the upper sections of other drainages on the northwest, west, and southern slopes of the volcano.
Fig. 6. Pyroclastic flow deposits illustrated using SAR change detection and thermal channel of ASTER data. a, Perspective view of SAR change detection analysis performed using two COSMO-SkyMed data acquired on 1 May 2010 and 11 November 2010; the image shows the deposits (black areas) around the pre-eruption channel (white pixels inside black areas). A total length of about ~ 15 km and a covered area of 13 km2 have been estimated from this analysis. b, Perspective view of
temperature image from ASTER data acquired over Merapi (foreground) and Merbabu (background) volcanoes on 1 November 2010 (night time); elevated temperatures signify the deposit of the
pyroclastic flow of 26 October. The two temperature profiles along the pyroclastic flow show
retrieved temperatures integrated across the 90 × 90 m2 sensor footprint, total length of the hot area detected by ASTER is ~ 7.2 km (A-B plus C-D segments), corresponding to the portion of the 26 October flow deposit still very hot on 1 November.
Post-eruption images of the summit show a new, roughly circular crater with a diameter of ~ 400 m, breeched on the southeast by a sloping trough that extends down slope along the path of Kali Gendol (Fig. 4f). The new dome (together with much of the former summit) was destroyed during the climactic explosive eruption on 4 November (Fig. 4e,f). Our image analysis indicates that in addition to removing the new lava dome, the eruption of 4–5
November excavated an additional 10 × 106 m3 or more of non-juvenile material from the pre-2010 summit dome complex.
On 6 November, tremor amplitude decreased slowly in parallel with decreased explosive activity. Later on 7–8 November, RSAM increased again and remained at relatively high levels for another 2 days, which prompted CVGHM to quickly rebuild parts of the seismic monitoring system that were heavily damaged during the climactic eruption on 5 November. Due to danger, new stations were temporarily set-up more than 10 km from the summit (e.g., at Ketep, see Fig. 1). The destroyed stations (PUS, DEL, and KLA) were rebuilt after the eruption ended. RADARSAT images collected at 11:00 and 23:00 utc on 6 November show that rapid extrusion resumed on 6 November and produced a new ~ 1.5 × 10⁶ m3 lava dome in < 12 h at a minimum effusion rate of 35 m3 s- 1. The increased tremor amplitude and very large extrusion rate again raised concerns of the possibility of another even larger eruptive phase, which fortunately did not ensue.
3.5. Waning phase (8–23 November)
After 8 November, seismic activity (mainly tremor and some volcano-tectonic earthquakes probably associated with stress readjustment after the large eruption) started to slowly decrease in intensity. Satellite data indicated that dome growth ceased by 8 November and was followed by a period of dome subsidence and gas and ash emissions from several vents adjacent to or penetrating the new lava dome. These emissions continued through mid-November with a decreasing intensity (Fig. 9). On 14 mid-November the exclusion zone was relaxed from 20 to 15 km on the south and western flanks and to 10 km on the less-exposed north and eastern flanks of the volcano. The alert level was decreased from level IV to level III on 3 December and from level III to level II on 30 December.
Reconfiguration of the summit crater over the course of the eruption channeled the majority of pyroclastic flows and subsequent lahars down the Gendol drainage and sparing Kali Kuning the worst of the eruption. Over 282 lahar events have been identified in almost all the rivers of the Merapi volcano from October 27, 2010 to February 25, 2012. During the first rainy season, most of the lahar events occurred on the Western flank, mainly in Kali Putih (55 lahars). Fifteen rain-triggered lahars have been reported during the eruption. Maximum peak discharge reached 1800 m3s- 1 during the 30March 2011 lahar event in the Kali Pabelan (max. depth 7 m). Discharges estimations of the lahars in Kali Putih rarely exceed 260 m3s- 1. Occurrence of dozens of lahar flows at the same location led to major changes in the geomorphic settings of downstream locations, especially along Kali Putih, Pabelan, Gendol and Opak. River bank erosion and lahar inundation have damaged 678 houses (215 were totally destroyed or buried, 463 partially damages), most of them along Kali Putih. Twenty sabo-dams and 12 bridges have been taken away by lahars, and some major roads have been
frequently inundated, such as the main road from Yogyakarta to Magelang and Semarang (which has been cut more than 20 times).
3.6. Summary and Impacts
During the four phases of the eruption, the alert level IV was set before the first eruption and remained at IV through the end of the crisis. The excluding area radii (10, 15, and 20 km from summit) were the parameters that were used to increase the threat level. These were timely set-up and properly estimated. While data from BNPB indicate that a total of 367 people were killed, 277 injured and 410,388 people were displaced, the accurate forecasts by CVGHM and prompt evacuations of many tens of thousands of people saved 10,000–20,000 lives (a
conservative estimate based on BNPB reports of 2300 houses destroyed and multiplied by 4 to 8 people associated with each household).
For the first time, Merapi eruptions resulted in major disruptions of air traffic in Yogyakarta, which has resulted in a paralysis of the city's activities. During the volcanic crisis, about 2000 flights were canceled, comprising 1350 flights during the closure of the airport for 15 days, and 600 flights due to a lack of a sufficient number of reservations after its reopening. Some companies like Garuda Indonesia suspended or transferred their flights to other airports, whereas the low cost carriers like Lion Air continued to fly despite the risks involved. The eruption of Merapi was fatal to Mandala Airlines, which encountered financial problems since 2010 and declared bankruptcy on 13 January 2011. The eruption disrupted the pilgrimage to Mecca for thousands of Muslims who had waited and saved for years to be able to perform. Nevertheless, the organizers were able to cope with the crisis by relocating the departure airport for the pilgrimage.
4. Insight into eruption dynamics from petrology, seismicity, and gas observations
4.1. Petrology of the new magma
In contrast to the last VEI 4 eruption of Merapi in 1872, which was basaltic (Hartmann, 1934) and contained vesicular “breadcrusted” blocks, juvenile blocks from the main pyroclastic flows of 4–5 November in Kali Gendol are dense amphibole-bearing pyroxene andesites with compositions similar to those from 2006 and to other eruptions of the past few decades (Gertisser and Keller, 2003; Table 1). They contain ~ 30% phenocrysts of plagioclase, amphibole, two pyroxenes, oxides, and 5–10% vesicles in a microlite-bearing groundmass (Fig. 7). Tephra deposits from the 2010 eruption, collected at the Ngepos observatory (11 km SW of the summit and near the axis of the plume) are thin (5 cm total, of which 2 cm is from the 4–5 November eruption) and non-pumiceous. The 4–5 November tephra deposit consists of sand-sized angular broken grains of dense andesite and initial results from isopach mapping suggest a relatively small bulk volume of < 20 × 106 m3.
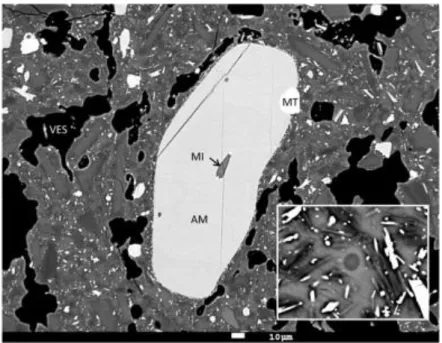
Fig. 7. Backscattered electron image of andesite from 4 November, 2010. Sample is from a
prismatically jointed juvenile block collected from a pyroclastic flow deposit in Kali Gendol. The large grain at the center of the image is a nearly euhedral amphibole (AM) phenocryst which has a very thin (or absent) reaction rim and a melt inclusion (MI) with 1200 ppm S. The bright white grains in the image are magnetite (MT), black areas are vesicles (VES), and the groundmass contains abundant plagioclase, pyroxene and magnetite microlites and interstitial glass. Other areas of the sample contain abundant complexly zoned plagioclase, clinopyroxene and orthopyroxene. The inset
enlargement shows detail of the groundmass: elongate dark microlites are plagioclase, bright grains are magnetite and pyroxene and the intermediate grey areas are 66-68% SiO2 glass. The circular spot is a 5 μm-diameter electron beam damage area.
Two-pyroxene geothermometry (Andersen et al., 1993) yields pre-eruptive temperatures of 1000 ° C ± 20 ° C. The juvenile samples contain three types of amphibole crystals: (1) euhedral crystals lacking reaction rims and containing 13–14 wt% Al2O3, (2) crystals that are texturally similar to type 1 but with lower Al2O3 (10–11 wt%) and higher F + Cl contents, and (3) rare crystals with thick coarse-grained reaction borders, yet compositionally similar to type 1. Plagioclase phenocrysts range from An90 to An45 [An = 100 X Ca/(Ca + Na + K)], microlites average An35, and plagioclase-melt equilibria (Lange et al., 2009) indicate pre-eruptive H2O in melt of 5.0 ± 0.5 wt. %. This abundance of H2O indicates minimum pressures of about 200 MPa or 6 km depth. The presence of high alumina amphiboles suggests even higher pressures, perhaps up to 1000 MPa as shown in experimental results with more silica rich melts (e.g., Prouteau and Scaillet, 2003). Glass inclusions in the amphiboles and
pyroxenes contain up to 1200 ppm S and 0.4 wt % Cl, whereas, the matrix glass is
substantially degassed (microprobe analyses indicate < 100 ppm S and < 1% H2O). Additional details of the petrology are given in Andreastuti et al. (this issue).
4.2. Seismicity
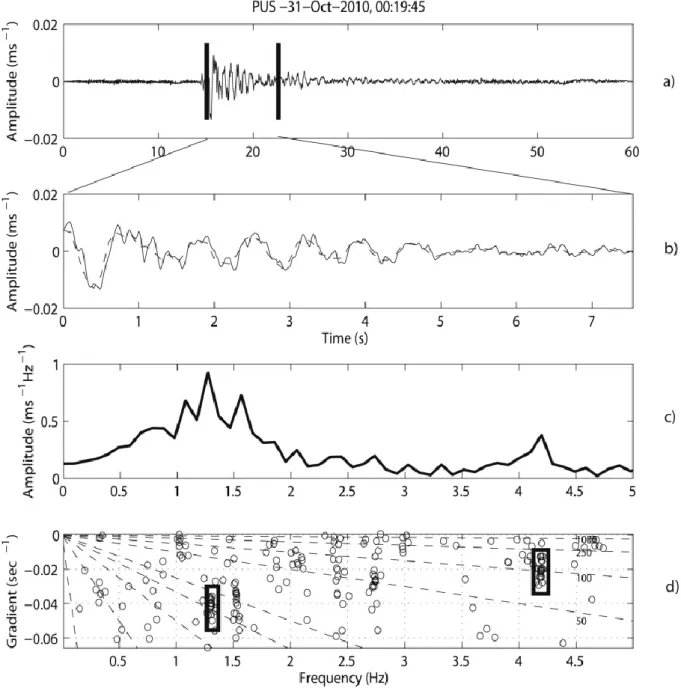
We analyzed several low-frequency (LF) earthquakes (including monochromatic LF earthquakes) recorded on 31 October and 1 November 2010 in terms of their complex frequency content (Kumagai et al., 2010; Fig. 8). LF earthquake models (e.g., Chouet, 1986; Kumagai & Chouet, 1999; [Neuberg, 2000] and [Jousset et al., 2003]) explain the frequency
content of the LF signals by modeling the resonance of a fluid-filled container; the frequency content of the synthetic signals depend on physical properties of the fluid (volatiles) inside the container and the hosting rock or magma. Kumagai & Chouet (1999) compared the seismic attenuation factor (Q) derived from observed and synthetic signals as an indicator of the nature of the fluid contained in the resonator. For a large LF event at Merapi on 31 October 2010, we find Q ~ 20–30 for the fundamental mode. By neglecting intrinsic attenuation effects, these Q values suggest that the fluid was a mixture of CO2 and H2O (i.e., a large gas component), bubbly water, or basaltic magma with bubbles (Kumagai and Chouet, 2000; Kumagai, pers. comm., 2011). Each of these interpretations are consistent with a large gas influx from depth and/or a large heat pulse which would produce abundant steam from ground water contained in the edifice before the magmatic phase. The number of LF per day (22 on 31 October) and their low Q before the magmatic phase suggest the existence of a high gas content in the rising magma (Jousset et al., this issue).
Fig. 8. Complex frequency analysis performed on one of the coda of a LF earthquake (31 October 2010 at 00:20) recorded on the vertical component of the station PUS (1 km from summit, see Fig. 1). a. Record of the LF earthquake; vertical lines indicated the signal used for the Sompi analysis, enlarged in b. b. Signal used for the analysis; the box indicates the portion of the signal used for analysis. Dotted line is the modeled seismogram by Sompi analysis c. Corresponding Fourier spectral amplitude. d. Plot of the complex frequency of the individual wave elements (frequencies lower than 5 Hz) for all trial of the autoregressive orders (5–40). The clusters of points within ellipses represent clear signal, and the scattered points represent incoherent noise. The solid lines represent lines along which the factor Q is constant.
In addition, we recorded one regional earthquake (M4.2) that preceded the sequence of explosions on 3 November and two syn-eruptive tectonic earthquakes on 3 and 4 November (Fig. 5). The 4 November event was by far the larger of the two and overlaps in time with the beginning of the climactic phase of the eruption. These observations suggest that regional tectonic earthquakes may have triggered higher levels of eruptive activity at Merapi, as conjectured also during the 2006 Merapi eruption (Walter et al., 2007). More generally, the correspondences between eruptive vigor and local tectonic faulting indicate that
pressurization-depressurization cycles during eruptions affect loading and slip on nearby faults – a relationship that also explains distal VT earthquakes preceding eruptions ( [White and Power, 2001] and [Posgay et al., 2005]), but rarely documented during an eruption.
4.3. Gas observations
The sampling of the fumarolic field of Woro, near the summit of Merapi, has been regularly performed by CVGHM-BPPTK for many years, and was stopped for safety reasons a few days before the first explosive eruption on 26 October 2010 (Table 1). The high temperature (> 400 °C) and low O2 and N2 concentrations are indicative of relatively pristine magmatic gases (Giggenbach et al., 2001). CO2, SO2, H2S, and HCl are consequently likely of magmatic origin. We observed a large increase in temperature and several volatile ratios (CO2/SO2, CO2/HCl and CO2/H2O) in the months preceding the eruption, with a remarkably dramatic increase in CO2 abundance, from 10 wt. % in September 2010 to 35–63 wt. % on 20 October (Table 1). Given the different solubility laws and speciation of CO2, SO2, HCl, and H2O volatile species (Oppenheimer, 2003), the increase of the gas ratios noted above points to a progressive shift to a deep degassing source. This is also supported by the decrease in CO2/H2S, as H2S is the increasingly stable sulfur species with depth and temperature and decreasing fO2 (oxygen fugacity). This deep source may be an input of fresh magma, likely of mafic composition, into the Merapi's magmatic system, which supplied a volatile phase rich in CO2 and H2S (compared to SO2, HCl, and H2O degassed at shallower depth). In addition, crustal decarbonation of limestone may have contributed to CO2 ( [Deegan et al.,
2010] and [Deegan et al., 2011]). Some of the CO2 and H2S escaped to the surface via a permeable fracture network and was detected at Merapi's high temperature fumaroles, providing an early warning. Did this new mafic magma rise to higher level and remobilize a more differentiated magma, already present in Merapi's magma reservoirs and thereby trigger its eruption? Although this seems likely (there is evidence of magma mixing in samples from Merapi, see Borisova et al., 2011), this question requires further petrological studies that might, for instance, constrain the timing of mixing to just before the eruption as documented at Pinatubo (Pallister et al., 1996) and Soufrière Hills volcanoes (Murphy et al., 1998). Nevertheless, the observations indicate degassing of ascending magma which released progressively larger amounts of SO2, HCl, and H2O.
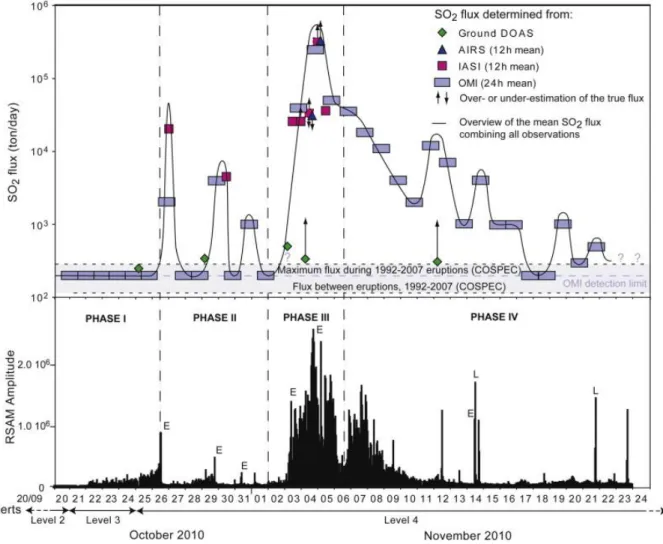
A time-series of SO2 flux estimated from ground-DOAS and satellite measurements, which covers all eruptive phases, is shown in Fig. 9. These emission rates are greatly in excess of both background and eruptive emissions recorded at Merapi volcano between 1986 and 2007 ( [Nho et al., 1996] and [Humaida et al., 2007]; this issue) and started well ahead of the climatic phase of the eruption on 4 November 2010. Significant increases in SO2 emissions
accompanied the initial explosive eruptions on 26 and 29/30 October. The SO2 emission rate then decreased to a relatively „low‟ level for this eruption (but still at elevated levels
compared to past Merapi eruptions) during the first dome-building episode on 1–3 November. Emissions increased again significantly on 3 November, simultaneously with increasing tremor amplitude, and peaked during the climactic explosive eruptions of 4–5 November.
Trends of degassing and RSAM during all phases of the eruption (Fig. 9) show that gas release was correlated with energetic tremor and high eruption rates during the most explosive phases of the eruption.
Fig. 9. Comparison between SO2 fluxes and RSAM data. a, Overview of SO2 degassing during the 2010 Merapi volcano eruption (UTC time). SO2 fluxes were determined from ground-based scanning DOAS measurements (mean fluxes measured over hour-long intervals) and satellite images, from IR IASI and AIRS sensors (mean fluxes calculated for12 h intervals) and the UV OMI sensor (mean fluxes calculated for 24 h intervals). OMI is more sensitive than IR sensors to lower tropospheric plumes (< ~ 5 km altitude). Therefore, when the plume is weaker, OMI was the primary source of mean SO2 flux estimates. The black line has been manually added to interpolate between discrete values of the SO2 flux to highlight degassing trends. Ranges for SO2 emissions during and between eruptions taking place between 1999 and 2007 are from scanning correlation spectrometer (COSPEC) measurements ( [Nho et al., 1996] and [Humaida et al., 2007]). Question marks indicate gaps in OMI data coverage, or interference from SO2 plumes emitted by other Indonesian volcanoes. Refer to the text for
explanations concerning the reasons of over or under-estimations of the true flux. b, RSAM computed for the Plawangan station (6 km from the summit). A clear correspondence between RSAM and SO2 flux is demonstrated, supporting our identification of four distinct phases to the eruption (indicated by PHASE I to IV). E stands for explosion; L for Lahar.
A cumulative SO2 output of ~ 0.44 Tg is estimated for the entire eruption based on satellite observations. We use the „petrologic method‟ (Westrich and Gerlach, 1992) to calculate the volume of andesitic magma needed to account for this release of SO2. Assuming the andesite magma contained 30 vol% phenocrysts, ~ 1000 ppm by mass of sulfur in the melt that degassed syn-eruptively (based on Allard et al., 2011; and our S analyses in glass inclusions which range from a few hundred to 1200 ppm, and the low values of S in matrix glass), and a density of ~ 2600 kg m- 3, then the eruption magnitude would have corresponded to a dense-rock equivalent volume of lava and tephra of ~ 0.12 km3, or a mass of 3.1 × 10¹¹ kg.
However, our initial estimate of the bulk volume of the juvenile deposits from the 2010 eruption is only ~ 0.03–0.06 km3, consisting of 0.01–0.02 km3 of tephra fallout, 0.02–
0.04 km3 of pyroclastic density current deposits (in addition there were 0.01–0.02 km3 of non-juvenile material excavated from the summit). Broadly similar volume estimates are made by Komorowski et al. (this issue) and Cronin et al. (this issue). Correcting to dense-rock
equivalent volumes (based on a mean density of Merapi pyroclastic flow deposits of ~ 1950 kg m- 3 from Lube et al. (2011)), suggests a juvenile magma dense-rock equivalent volume of only 0.02–0.05 km3, corresponding to a mass of 6 × 10¹⁰ – 1.2 × 10¹¹ kg. Thus the magnitude based on sulfur release exceeds by a factor of ~ 3–5 that represented by the juvenile component of the mapped deposits. This mismatch points to the existence of an exsolved S-rich fluid phase in the pre-eruptive magma body ( [Wallace, 2001], [Shinohara, 2008] and [Oppenheimer et al., 2011]) possibly associated with deep recharge of new magma, likely of mafic composition, as discussed above.
4.4. Preliminary eruption model
Taken together, these petrologic, gas composition and flux, seismic, and volcanological observations of the 2010 eruption suggest that the eruption was fed by unusually rapid ascent of a large volume of volatile-rich magma from depths of 5–30 km, which pressurized the volcano and powered the explosive phases of the eruption. Derivation of magmas over such an extensive depth range is consistent with multiple magma reservoirs as suggested by Chadwick (2008). As observed at many instances elsewhere, no seismicity deeper than 8– 9 km was identified associated with the eruption, consistent with a hot and aseismic conduit at greater depths. The presence of euhedral and unreacted amphibole (Fig. 7 and Andreastuti et al., this issue) is consistent with the relatively high water content as inferred from plagioclase-melt equilibria and indicates rapid ascent (Rutherford, 2008) probably within the week of rapid escalation in monitoring parameters preceding the 26 October eruption.
Several observations suggest that the unusually explosive character of the 2010 eruption was a consequence of separation of a gas phase from the magma and its rapid transport to the
surface: these include the low vesicularity of juvenile blocks in most of the deposits; the relatively small volumes of tephra and pyroclastic density current deposits, given the large explosivity of the 4–5 November eruption; increased CO2/SO2 and H2S/SO2 ratios in fumarole gases preceding the eruption; sulfur in excess of that which can be accounted for by the
erupted magma using the “petrological method”; increased LF seismicity as indicative of superheated water or high gas content; and high tremor level after the paroxysmal explosion. The relatively small volume of tephra and absence of a widespread fine ash cloud collocated with the extensive SO2 cloud detected by OMI, IASI, and AIRS is also consistent with separation of a voluminous gas phase prior to the explosive November 4 eruption. However on this latter point, we acknowledge that detection of fine ash in tropical volcanic clouds is challenging due to interference from water vapor, meteorological clouds and ice ( [Rose et al.,
1995] and [Tupper et al., 2004]). We also acknowledge that the LF seismicity analysis is hindered by high noise levels.
The alternation between explosive (26, 29, 31 October, and 4–5 November) and rapid lava dome extrusion (1–4 November and November 6) suggests variable gas content in the erupting magma. This was also called on to explain similar differences in eruptive behavior during the VEI ~ 4 1930 eruption of Merapi (Van Padang, 1930). We suggest that alternating explosive and effusive eruptive behavior at Merapi may be the consequence of gas
segregation in magma occurring during ascent in the conduit ( [Gonnerman and Manga, 2003] and [Michaut et al., 2009]) and to the non-linear effects of degassing and crystallization on magma viscosity during ascent at shallow levels (Melnik and Sparks, 1999).
5. Concluding remarks and perspectives
Rapid ascent of gas-rich magma has been proposed at other highly explosive eruptions (Castro and Dingwell, 2009), raising concerns that there may be little time to issue warnings even at long-dormant volcanoes. Fortunately, despite the rapid onset and short-duration of the precursory signals leading up to the 26 October and 4 November eruptions, CVGHM
recognized the precursory activity as signaling that large explosive eruptions were imminent and issued warnings that saved many thousands of lives. Recognizing this precursory activity was possible because CVGHM has had a long history of systematic real-time monitoring at Merapi, which had been used to establish baselines and characterize prior volcanic activity. Also fortunately, due to increased capabilities in communications and satellite remote sensing, and due to the broad and diverse research focus on Merapi, international collaborators were able to deliver near-real-time data and advice that complemented the extensive experience of CVGHM in interpreting the volcanic activity of Merapi.
The following list summarises the key observations and interpretations concerning the 2010 eruption:
•
High levels of CO2, increase in CO2/SO2 and H2S/SO2 recorded in fumarole gas samples over the months prior to the eruption, all support a deep degassing source associated with an input of fresh magma most likely of mafic composition.
•
Strong degassing was measured during the whole eruption, with emission rates a few order of magnitude higher than recorded at Merapi during past eruptions from 1986 to 2007. According to satellite data, a total of ~ 0.44 Tg of SO2 was released during the eruption, associated with a plume that disrupted air traffic over Asia and Australia.
•
The mass of SO2 detected by satellites is not readily accounted for by syn-eruptive degassing of the measured ejecta. This mismatch in sulphur budgeting points to the presence of an exsolved fluid phase in the pre-eruptive magma body, which may have played a crucial role in the ensuing explosivity of the eruption.
•
Our petrologic data show that the 2010 magma is chemically and petrologically similar to that erupted in 2006 except for the much higher abundance of unreacted amphiboles, which suggests faster magma ascent.
•
Deformation was greater than observed during previous eruptions, but tightly focussed on the summit and its southern flank. There was no evidence for broad (edifice-wide) deformation.
•
A large number and magnitude of earthquakes accompanied the eruption, including VT, MP, episodes of tremor, as well as LF and VLP earthquakes. These seismic data indicate transport of large volumes of magma and fluids.
•
Rapid rates of lava dome growth and alternation between explosive and rapid effusion indicate variable gas content of magma reaching the surface, possibly reflecting gas segregation in the conduit during ascent.
•
The summit morphology changed dramatically as a result of the eruptions (Fig. 10), indicative of both explosive cratering and collapse.
Fig. 10. Morphology of the summit area. a, Before the October-November eruption. b, After the eruption. Depth of the new crater is about 200 m.
Lahars following the 2010 eruption were larger than any previously recorded after previous 20th and 21st century eruptions of Merapi.
Amongst the main questions that need to be addressed in more detail, we include the following:
•
How can the magmatic model for the 2010 eruption presented here be improved? For example: Was magma mixing a trigger for the eruption and to what degree was limestone decarbonation involved? (see Andreastuti et al., this issue).
•
Why were most of the juvenile components in the tephra and flow deposits dense andesite? Where are the more vesicular juvenile magmatic components (e.g., scoria or pumice) that one typically associates with such an explosive eruption? (see
Komorowski et al., this issue; Cronin et al., this issue)
•
Does the 2010 eruption mark a change to more explosive eruptions of Merapi in the future, perhaps as seen in the late 19th and early 20th centuries, and if so, what changes in monitoring, hazard analysis, and early warning protocols are needed? (see Mei et al., this issue; Cronin et al., this issue; Budi-Santoso et al., this issue)
•
What new strategies and methods should be implemented for future research and monitoring of Merapi volcano?
As a result of the effective crisis management, we conclude that international collaboration is the way forward to tackle these questions (annex 1). We emphasize the integration of seismic and satellite remote sensing data for real-time and near-real time monitoring of the eruption and the vital role it thereby played in decision support, especially with respect to locations of exclusion zones. The eruption also represented a major test for several international programs, including MIAVITA and SAFER, to respond with the urgent need to acquire and interpret diverse sources of data during a major volcanic crisis. Rapid delivery of satellite data to the responsible authority for emergency response is paramount. In this case, CVGHM's role as the sole agency tasked with providing forecasts and warnings to Indonesian communities at risk and to the media was a major factor in effective handling of the crisis. Nevertheless, there remains considerable scope to enhance access to remote sensing data, to improve exchange protocols and data tools, and to facilitate data interpretation by those working at the front line. We encourage not only wider participation in the International Charter for Space and Major Disasters, but also investment by government space and research agencies to expand the constellation of operational civilian radar satellite systems.
Merapi's 2010 eruption offers a rich set of scientific data and represents a case study of international scientific cooperation. This paper, as a preliminary overview of available observations and interpretations, aims at providing a starting point for building a more complete model of the complex eruptive processes that took place at Merapi volcano in October-November 2010. We encourage further detailed analyses and studies in order to advance our understanding of, and ability to forecast explosive volcanism.
Acknowledgements
We all acknowledge efforts of BPPTK staff for their careful monitoring of Gunung Merapi for many years. S. and P.J. acknowledge discussions with Pierre Thierry, Amélie Vagner, Gonéry Le Cozannet, Franck Lavigne, Jean-Philippe Metaxian, Philippe Lesage. Hendra Gunawan (CVGHM) contributed to P.J.'s smooth stay while in Yogyakarta. S. and J.P. acknowledge the support of USAID's Office of Foreign Disaster Assistance to the Volcano Disaster Assistance Program for collaborative work in Indonesia. J.P also thanks the U.S. Embassy and USAID mission in Jakarta for their assistance and support, as well as colleagues in the USGS Advanced Systems Center and Alaska Volcano Observatory for their remote sensing support. J.P., D.S., and J.G. especially thank USGS colleagues Ron Keeler, Chris Noyles, Bill Burton, Michele Combs, Tina Neal and Brenda Jones for their support. L.C. is a Postdoctoral Researcher with F.R.S.-FNRS. Indyo Pratomo provided ash samples for rock analysis. P. J. acknowledges the French Embassy in Jakarta for the support for the mission extension during the eruption. P.J. is also grateful to Marie Le Sourd (Lembaga Indonesia Perancis), Adrien Picquout and Valérie Diard for their strong support in Yogyakarta, and many BRGM colleagues for remote support and advices. We thank Cynthia Werner, William Scott, Marcello De Michele, John Evert, Ulrich Wegler and an anonymous reviewer for their careful reviews of the manuscript, which improved it. S., P.J., A.B., M.B., F.B., F.P., H. H., S. S. and C.O. thank the European MIAVITA project for financial support. The MIAVITA project is financed by the European Commission under the 7th Framework Programme for Research and Technological Development, Area “Environment”, Activity 6.1 “Climate Change, Pollution and Risks". TerraSAR-X data were provided by the German Space Agency and RADARSAT and GeoEye data were provided through the International Charter for Space and Major Disasters. ASTER images obtained via collaboration between NASA JPL and INGV. The SAFER project financed by the European Commission provided SAR images. S.C. acknowledges NASA support (award nos. NNX09AJ40G and NNX10AG60G) for OMI SO2 data analysis. C.O. additionally acknowledges support via the UK National Centre for Earth Observation (NERC NE/F001487/1 “Dynamic Earth and Geohazards” theme: http://comet.nerc.ac.uk/).
Appendix 1. International collaboration during the 2010 eruption at Merapi
Increased satellite tasking frequency and expedited product generation were supported by several pre-existing national and international hazard response protocols including the International Charter for Space and Major Disasters (RADARSAT-2 and TerraSAR-X), the NASA Urgent Request Protocol (ASTER), and the U.S. Geological Survey (USGS) Hazards Data Distribution System (GeoEye 1 and WorldView-2). Thanks to links with European Community project SAFER (Services and Applications For Emergency Response), the INGV remote sensing team obtained SAR acquisitions from the COSMO-SkyMed constellation. Satellite and ground observations (seismic, deformation, SO2) were gathered at CVGHM's observatory in Yogyakarta and interpreted by a scientific team working under crisis
circumstances. On 22 October, during the rapid escalation in monitoring parameters CVGHM contacted the Volcanic Disaster Assistance Program (VDAP) of the U.S. Geological Survey (USGS) and U.S. Agency for International Development with a request for monitoring assistance utilizing remote sensing. On 27 October, CVGHM invited BRGM (Geological Survey of France) and the University of Cambridge within the framework of the MIAVITA European project to join the monitoring team in seismology and gas analysis at BPPTK, Yogyakarta. On the same day, working through the International Charter for Space and Major Disasters and tasking a variety of satellite resources, the VDAP team began delivering remote