HAL Id: hal-00437681
https://hal.archives-ouvertes.fr/hal-00437681
Submitted on 11 Feb 2010
HAL is a multi-disciplinary open access
archive for the deposit and dissemination of
sci-entific research documents, whether they are
pub-lished or not. The documents may come from
teaching and research institutions in France or
abroad, or from public or private research centers.
L’archive ouverte pluridisciplinaire HAL, est
destinée au dépôt et à la diffusion de documents
scientifiques de niveau recherche, publiés ou non,
émanant des établissements d’enseignement et de
recherche français ou étrangers, des laboratoires
publics ou privés.
Dimensionless study of the total response of thermally
stimulated luminescence
Franck Mady, Dominique Lapraz, Philibert Iacconi
To cite this version:
Franck Mady, Dominique Lapraz, Philibert Iacconi. Dimensionless study of the total response of
thermally stimulated luminescence. Radiation Measurements, Elsevier, 2008, 43 (2-6), pp.180-184.
�10.1016/j.radmeas.2007.11.022�. �hal-00437681�
Radiation Measurements 43 (2008) 180-184
Dimensionless study of the total response of thermally stimulated
luminescence
Franck Mady
*, Dominique Lapraz and Philibert Iacconi
LPES-CRESA (EA 1174), University of Nice-Sophia Antipolis, Parc Valrose, Nice, France
Received 13 August 2007; received in revised form 13 August 2007; accepted 13 August 2007
Abstract
The response of thermally stimulated luminescence (TSL) is investigated theoretically. An original dimensionless treatment is proposed, first to highlight the key dimensionless factors rationalizing the competition between the mechanisms at play during the TSL readout, and second to clean up the approach from any particular values of the relevant physical parameters. The approach holds for an unlimited number of interactive traps. The total response from a current trap is derived and cast into simple formal expressions as a function of the recombination cross-section, the set of trapping cross-sections, and of initial trap occupancies (i.e. those existing before the readout of the current peak). This allows one to calculate each peak response by taking proper account of carrier transfers accompanying the successive peak readouts.
Keywords: TSL; Dose response;
*
Corresponding author. Tel.: +33492076330; fax: 33492076336
E-mail adresses : mady@unice.fr (F. Mady),
lapraz@unice.fr (D. Lapraz), iacconi@unice.fr (P. Iacconi) 1. Introduction
Thermally stimulated luminescence (TSL) is used as a routine solid-state dosimetry technique. Nevertheless, its modelling still lacks of dimensionless analysis highlighting the key factors which govern its response. Basic mechanisms at play – trapping, detrapping and recombination – are usually accounted for by a set of differential kinetic equations, but their resolution has not provided the sought factors: simplest formal treatments were based on severe approximations (well-known kinetic order models with single active traps and quasi-equilibrium approximation). More realistic models, involving several interactive traps, have been treated numerically for restricted sets of parameter values (see e.g. Chen et al., 1981; Bull et al., 1986; Berkane-Krachai et al., 2002; Mady et al., 2006), or formally with significant complexity (Lewandowski and McKeever, 1991).
In dosimetry, what is expected from a TSL theory is basically a relation between the absorbed dose and the measured response. The total response integrated over a relevant temperature range is only governed by intrinsic dosimeter properties, as trapping and recombination cross-sections or trap concentrations, and by trap occupancy at the onset of this range. This occupancy depends on the radiation dose and dose-rate given to the dosimeter prior to the readout (Chen et al., 1981). Thus, the dose response modelling first requires the determination of the initial trap occupancy yielded by irradiation. It then demands to calculate the total response as a function of initial trap occupancy. The present work focuses on the latter stage.
Since we deal with integrated responses, there is no point in considering a time or temperature-resolved approach here. This frees us from the mathematical complexity that forces to resort to numerical resolution and makes the theory independent of the nature or kinetics of the stimulation allowing the readout. Then, general expressions of the response are derived within a simple formalism. The key coefficients governing the response are naturally pointed out by the dimensionless treatment.
2. Theoretical route of attack
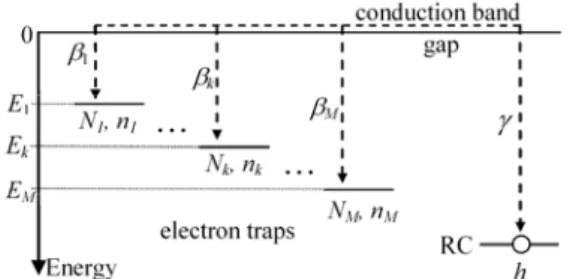
A typical system similar to that of usual TSL models is illustrated in Fig. 1. TSL is assumed to originate from the stimulated release of trapped electrons which subsequently recombine with holes on recombination centres (RC). The treatment being independent of the carrier polarity, it would hold for holes as well. A set of M discrete gap levels is considered. Each level is denoted by its order index k which increases with trap depth (1 ≤ k ≤ M). βk is the trapping coefficient of traps k (electron thermal velocity multiplied by the capture cross-section of traps k), while γ is the recombination coefficient (electron thermal velocity multiplied by the recombination cross-section). Nk and nk are the densities of traps k and of electrons in traps k respectively, and h is the concentration of holes on RC.
Mady et al. / Radiation Measurements vol 43 (2008) 180-184
Fig 1. Typical energy scheme showing traps, recombination centres (RC), trapping and recombination transitions. Trap depths Ek increase with k.
The total TSL response of the pth peak, due to the emptying of trap p, results from a conversion between two equilibriums characterized by the absence of carriers in the conduction and valence bands. At initial state, electrons are distributed on traps p to M, levels 1 to (p – 1) having been emptied at lower temperature. At final state, electrons that have escaped recombination are retrapped on traps (p + 1) to M.
In what follows, initial concentrations are indicated by a superscript (p). Final populations are denoted by a superscript (p + 1) since they also define initial occupancies relative to the emptying of the (p + 1)th trap. The sample neutrality is then written as:
∑
= = M p k p k p n h( ) ( ) , or∑
( ) + = + + = M p k p k p n h 1 1 ) 1 ( . (1)During the readout of the current peak p, nk (for p +1 ≤ k ≤ M) and h obey usual equations, where nc is the transient electron
concentration in the conduction band:
(
k k)
c k k n N n dt dn − =β , (2) h n dt dh c γ − = . (3)For levels p + 1 ≤ k ≤ M, thermal release is neglected within the temperature range of the pth peak. Then, partial integration of Eq. (2) and (3) between initial and final states gives:
(
)
⎥⎥ ⎦ ⎤ ⎢ ⎢ ⎣ ⎡ ⎟⎟ ⎠ ⎞ ⎜⎜ ⎝ ⎛ − × − = − + + γ βk p p p k k p k p k h h n N n n ( ) ) 1 ( ) ( ) ( ) 1 ( 1 , k ≥ p+1. (4)3. Dimensionless formulation and total response
After Eq. (4), competition between recombination with holes on RC and retrapping on levels k > p is naturally rationalized by the αk = βk/γ ratios. We furthermore define trap occupancies ϕk as the fraction of occupied traps nk/Nk, and introduce the proportion ξk of traps k with respect to the total density of traps:
∑
= = M j j k k N N 1 / ξ .The total TSL response of the pth peak is equal to the total number of recombination taking place throughout the peak readout. If every recombination is radiative, this response is equal to h(p)– h(p+1), the variation of the hole concentration on RC between initial and final states. We then define the dimensionless total response Rp of the pth peak by:
p p p p N h h R ) 1 ( ) ( − + = . (5)
The normalization is such that 0 ≤ Rp ≤ 1. The case Rp = 1 is achieved when all traps k ≥ p are initially saturated.
From (1), (4) and (5), one obtains the formal equation of Rp for initial occupancy rates ϕk(p), trap weights ξk and cross-section ratios αk (k = p..M):
(
)
⎥ ⎥ ⎥ ⎥ ⎦ ⎤ ⎢ ⎢ ⎢ ⎢ ⎣ ⎡ ⎟⎟ ⎟ ⎟ ⎠ ⎞ ⎜⎜ ⎜ ⎜ ⎝ ⎛ − − − − =∑
∑
= + = k M p k p k k p p M p k p k k p p p p R R α ϕ ξ ξ ϕ ξ ξ ϕ ) ( 1 ) ( ) ( 1 1 1 1 . (6)This leads to Rp = ϕp(p), that is h(p) – h(p+1) = np(p), in the absence of traps deeper than the pth one (ξk = 0 for k > p), or if deep traps are initially saturated (ϕk(p) = 1 for k > p). Then, carriers released from the pth trap can not be retrapped (except on the pth trap itself from which they are rapidly re-emitted). Finally, they all recombine and take part in the total response.
4. Case of a single trapping cross-section
When traps have a same trapping cross-section, i.e.
αk = α for k = 1..M, Eq. (4) shows that (ϕk(p+1) – ϕk(p))/(1 –
ϕk(p)) does no depend on k. ϕk(p+1) is therefore independent of k
if ϕk(p) is the same for any k. This is actually true regardless of
initial and final moments, even between ϕk(1) and trap occupancy before irradiation: if traps are all initially empty, they will fill up parallel to one another under irradiation. Thus, the ϕk(1) and the subsequent ϕk(p) for p > 1 will be all independent of k and Eq. (6) will reduce to:
( ) ( )
(
( ))
( )(
( ))
⎥⎥ ⎦ ⎤ ⎢ ⎢ ⎣ ⎡ ⎟⎟ ⎠ ⎞ ⎜⎜ ⎝ ⎛ + − − − − = α ξ ξ ϕ ξ ϕ ξ ξ ϕ p D p p p p p p p D p p R R 1 1 1 . (7)Now, ϕ(p) is the trap occupancy of traps k ≥ p before the pth peak readout and ξD
(p)
is the fraction of traps deeper than the
pth one, that is ( ) ∑ + = = M p k k p D 1 ξ
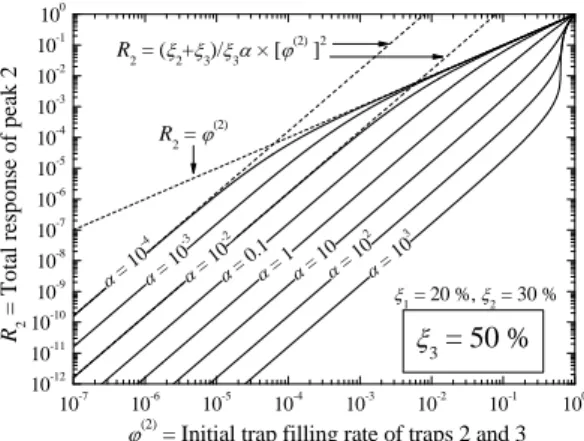
ξ . Note that ξD(0) = 1 and ξD(M) = 0. Fig. 2 and 3 show the R2 plots obtained after Eq. (7) as a function of the initial occupancy ϕ(2). These examples consider a three trap system (M = 3) with ξ1 = 20%, ξ2 = 30%,
ξ3 = 50% (Fig. 2) and ξ1 = 69%, ξ2 = 30%, ξ3 = 1% (Fig. 3).
They well illustrate the effect of the deep trap density (N3
10-7 10-6 10-5 10-4 10-3 10-2 10-1 100 10-12 10-11 10-10 10-9 10-8 10-7 10-6 10-5 10-4 10-3 10-2 10-1 100 α = 1 0-4 α = 1 0 -3 α = 0 .1 α = 1α = 1 0 α = 10 -2 α = 1 02 R2 = (ξ2+ξ3)/ξ3α × [ϕ(2) ]2 R2 = Tota l response of pea k 2
ϕ(2) = Initial trap filling rate of traps 2 and 3 R2 = ϕ(2)
α = 1 03
ξ3 = 50 %
ξ1 = 20 %, ξ2 = 30 %
Fig 2. Dimensionless integrated response of peak 2 as a function of initial occupancy of traps 2 and 3 for a three trap system with ξ1 = 20%, ξ2 = 30% and ξ3 = 50%. The three traps have the same trapping cross-section (α values are indicated on the plots).
10-7 10-6 10-5 10-4 10-3 10-2 10-1 100 10-12 10-11 10-10 10-9 10-8 10-7 10-6 10-5 10-4 10-3 10-2 10-1 100 α = 1 0-4 α = 1 0-3 α = 1 0-2 α = 0 .1 α = 1α = 1 0 α = 1 0 2 α = 1 0 3 α = 1 0 4 R2 = (ξ2+ξ3)/ξ3α × [ϕ(2)]2 R2 = ϕ(2) ϕ(2)
= Initial trap filling rate of traps 2 and 3
R2 = T ot al re sp on se o f pe ak 2 ξ1 = 69 %, ξ2 = 30 % ξ 3 = 1 %
Fig 3. Same as Fig. 2 for ξ1 = 69%, ξ2 = 30% and ξ3 = 1%. Note the difference due to the concentration of the deepest (third) trap at high α and high initial occupancy rate.
5. Useful approximations
Explicit approximations of Eq. (6) can be derived for convenience. Let us first examine the strong retrapping hypothesis, when most carriers released from the pth trap are captured on levels (p + 1) to M instead of recombining. Then,
(h(p) – h(p+1))/ h(p) << 1, that is ∑ = << M p k p k k p pR ) ( ϕ ξ ξ , and a first
order expansion of (6) readily gives:
(
)
∑
∑
= + = − + = M p k p k k M p k p k k k p p p R ) ( 1 ) ( ) ( 1 1 ϕ ξ ϕ ξ α ϕ . (8)In case of weak retrapping, carriers released from the pth trap mostly recombine with holes and 1 – Rp/ϕp(p) << 1. If one further assumes that negligible retrapping is due to the predominance of the recombination cross-section over every trapping one rather than to saturation of traps k > p, one also has αk << 1 for k = p+1..M. Then, the approximated Rp obtained by first order expansions of Eq. (6), is found to be the same as Eq. (8). Thus, Eq. (8) seems to be an appropriate approximation in either limit situation.
If a single trapping cross-section is assumed (αk = α), Eq. (8) can be written as:
) ( ) ( ) 1 ( ) ( ) ( 1 1 p p p D p D p p R ϕ ϕ ξ ξ α ϕ − × + = − . (9)
At weak trap occupancy, the second term in the denominator of Eq. (9) is much greater than unity and Rp obeys:
2 ) ( ) ( ) 1 ( p p D p D p R ϕ αξ ξ − = . (10)
The response is then quadratic with respect to initial occupancy (see examples of Fig. 2 and 3). As ϕ(p) increases, the denominator of Eq. (9) tends to unity and the response becomes linear, independent of α: Rp ~ ϕ(p). Such quadratic and linear TSL responses have already been predicted (Sunta et al., 1994; Kristianpoller et al., 1974, Mady et al., 2006). They are formally demonstrated here, and quantified as a function of the physical parameters of the standard model.
Eq. (9) becomes exact, i.e. rigorously equivalent to Eq. (7), when α = 1. For examples of Fig. 2 and 3, Eq. (9) slightly overestimates Rp for α < 1 and yields an underestimated value for α > 1. The relative error is only about a few percent over a wide range of initial occupancy, but it forms a peak around the quadratic-to-linear transition. The peak maximum is at 5-10% for α < 1, so the approximation is always reliable in this case. This error is much greater for α >> 1, when the transition appears as a ‘vertical’ increase (e.g. when ϕ(2) is in the range 0.5 - 1 in Fig. 2 or 0.01-0.1 in Fig. 3). Then, the term in square brackets of Eq. (7) tends to unity and a more adequate approximation is:
( ) ( ) ( ) p p D p p p D p R ξ ξ ϕ ξ ξ − ⎟⎟ ⎠ ⎞ ⎜⎜ ⎝ ⎛ + = 1 . (11)
This approximation also corresponds to a linear increase of Rp, independent of α. It tends towards Rp ~ ϕ(p) as ϕ(p) approaches unity. A detailed examination of Eq. (7) indicates that Eq. (11) is valid when ϕ(p) > ϕc. The critical value ϕc is ξD
(p)
/ ξD
(p-1)
; it gives the location of the vertical transition: ϕc = 0.625 in Fig. 2 and ϕc = 3.2×10⁻² in Fig. 3. At ϕ << ϕc, the quadratic regime is accurately described by Eq. (9) or (10), as for α < 1.
In Eq. (8), for traps with different trapping cross-sections and initial occupancies, it is much more difficult to highlight linear and quadratic regimes of Rp according to ϕp(p). However, taking αk >> 1 for k = p+1..M in Eq. (6) still yields a linear relation at high occupancies:
p p D M p k p k k p p p p R ξ ξ ϕ ξ ξ ϕ ( ) 1 ) ( ) ( + 1 − =
∑
+ = if ) ( ) ( p D M p k p k kϕ ξ ξ > ∑ = . (12)6. Iterative calculation of successive peak responses
A simple iterative scheme can be proposed to predict the total response of the successive glow peaks. First, the total response Rp of a current peak p is given by Eq. (6). Second, Eq. (4) allows the calculation of initial trap occupancies ϕk(p+1) at the (p + 1)th step as a function of initial occupancies at the
Mady et al. / Radiation Measurements vol 43 (2008) 180-184
(
)
⎥ ⎥ ⎥ ⎥ ⎦ ⎤ ⎢ ⎢ ⎢ ⎢ ⎣ ⎡ ⎟⎟ ⎟ ⎟ ⎠ ⎞ ⎜⎜ ⎜ ⎜ ⎝ ⎛ − − × − + =∑
= + k M p m p m m p p p k p k p k R α ϕ ξ ξ ϕ ϕ ϕ ) ( ) ( ) ( ) 1 ( 1 1 1 . (13)If initial occupancies are known at the pth step, Rp can be calculated either numerically by (6) or analytically with the approximated form (8) if applicable. Eq. (13) then provides new occupancies at the (p + 1)th step, thus enabling the calculation of Rp+1… The problem now lies in finding the first trap filling state ϕk(1) left by irradiation in the dosimeter. This state depends on the material, on the absorbed dose and on the dose-rate. Its general calculation is worth peculiar publication and is far beyond the scope of this work. The following section just presents a particular example where radiation-induced occupancies and the related responses can be calculated formally as a function of the absorbed dose.
7. Application example
The case αk = α = 1, corresponding to a single cross-section equal to the recombination one, ensures a full formal treatment. Then, trap occupancies are independent of the trap level k at any step p and Eq. (9) and (13) leads to:
( ) ( 1) ) ( ) ( 1 ) 1 ( − − + + = p D p p p p D p ξ ϕ ξ ϕ ξ ϕ . (14)
For the sake of example, the assumption of low doses is made here: the dimensionless dose coefficient D, defined as the ratio of the total density of electron-hole pairs excited by irradiation to the total concentration of traps (sum of the Nk for k = 1.. M), is such that D << 1. Then, initial trap filling is
approximately ϕ(1) = D regardless of the dose-rate and the following equations can be derived from Eq. (14) and (9):
( )
(
)
D D D p D p − + = − 1 1 ) ( ξ ϕ , (15) ( )(
)
(
( )p)
D p D p D D D R ξ ξ + + = −1 2 . (16)The TSL response of the pth peak depends on the fractions of traps deeper than the (p – 1)th and pth ones. If these fractions were very small, such as ξD(p-1) , ξD(p) << D << 1, Rp would tend to unity because of trap saturation. However, ξD(p-1) and
ξD(p) are likely to be much greater than D if D << 1, so Rp is expected to be proportional to D2. This quadratic dose response holds for all peaks p, except for p = M since
ξD(M) = 0. The response of this last peak varies linearly with the dose because of the absence of deeper traps.
8. Conclusion
Dimensionless expressions of the total TSL response have been derived in the context of a simple model accounting for essential physics in a set of interactive traps. The obtained equations clearly demonstrate that the αk = βk/γ ratios are the only relevant coefficients that determine the effect of trapping and recombination cross-sections on each peak response. This
fact, which has already been observed from simulations (Mady et al, 2006), is here formally demonstrated.
Starting from a given dosimeter model – defined by its cross-section ratios αk = βk/γ and trap weights ξk – and from a set of initial trap occupancies, the iterative procedure of section 6 gives the response of successive peaks associated with traps of increasing depths. Carrier transfer, i.e. enhancement of deep trap occupancies due to retrapping of carriers released during the readout of a shallow level, is naturally taken into account. The main assumption of the treatment is the absence of detrapping from traps deeper than the active one in the temperature range of the current peak. Therefore, what we refer to as successive peaks must be separate peaks. If a group of several neighbouring traps yields overlapping peaks, the formalism will provide the total response of the peak group if all associated traps have the same β. Then, subscripts p or k refer to the whole group of traps rather than to a single level.
Apart from the particular case α = 1 where explicit equations and formal solutions exist, the proposed procedure can be implemented in a computer program to perform very efficient calculations of the dose and dose-rate response of any peak of a series. This requires the calculation of initial trap occupancies as a function of dose and dose-rate. We currently consider this issue with an adequate dimensionless formalism which is to be presented in a forthcoming publication.
References
Berkane-Krachai, A., Iacconi, P., Bindi, R., Vinceller, S., 2002. Analysis with a multilayer model of heating rate effect on thermally stimulated luminescence, conductivity and exoelectronic emission of α-Al2O3. J. Phys. D: Appl.
Phys. 35, pp 1895-1902.
Bull, R.K., McKeever, S.W.S., Chen, R., Mathur V.K., Rhodes, J.F., Brown, M.D., 1986. Thermoluminescence kinetics for multipeak glow curves produced by the release of electrons and holes. J. Phys. D: Appl. Phys. 19, pp 1321-1334.
Chen, R., McKeever, S.W.S., Durrani, S.A., 1981. Solution of the kinetic equations governing trap filling. Consequences concerning dose dependence and dose-rate effects. Phys. Rev. B 24 (9), pp 4931-4944.
Kristianpoller, N., Chen, R., Israeli, M., 1974. Dose dependence of thermoluminescence peaks. J. Phys. D: Appl. Phys. 7, pp 1063-1072.
Lewandowski, A.C., McKeever, S.W.S., 1991. Generalized description of thermally stimulated processes without the quasiequilibrium approximation. Phys. Rev. B 43 (10), pp 8163-8178.
Mady, F., Bindi, R., Iacconi, P., Wrobel, F., 2006. Influence of absorbed dose and deep traps on thermoluminescence response: a numerical simulation. Radiat. Prot. Dosim. 119 (1-4), pp 37-40.
Sunta, C.M., Yoshimura, E.M., Okuno, E., 1994. Supralinearity and sensitization of thermoluminescence. Part I: a theoretical treatment based on an interactive trap system. J. Phys. D: Appl. Phys. 27, pp 852-86.