HAL Id: hal-00569528
https://hal.archives-ouvertes.fr/hal-00569528
Submitted on 26 Feb 2011HAL is a multi-disciplinary open access archive for the deposit and dissemination of sci-entific research documents, whether they are pub-lished or not. The documents may come from teaching and research institutions in France or abroad, or from public or private research centers.
L’archive ouverte pluridisciplinaire HAL, est destinée au dépôt et à la diffusion de documents scientifiques de niveau recherche, publiés ou non, émanant des établissements d’enseignement et de recherche français ou étrangers, des laboratoires publics ou privés.
AND SPECIFIC-HEAT OF TL2BA2CU1O6+DELTA
90 K-SUPERCONDUCTORS OBTAINED BY A NEW
PROCESS
Christine Opagiste, M. Couach, A.F. Khoder, T. Graf, A. Junod, G. Triscone,
J. Muller, T.K. Jondo, J. -L. Jorda, R. Abraham, et al.
To cite this version:
Christine Opagiste, M. Couach, A.F. Khoder, T. Graf, A. Junod, et al.. METALLURGY, HRTEM, MAGNETIC-PROPERTIES AND SPECIFIC-HEAT OF TL2BA2CU1O6+DELTA 90 K-SUPERCONDUCTORS OBTAINED BY A NEW PROCESS. Physica C: Superconductivity and its Applications, Elsevier, 1993, 205 (3-4), pp.247-258. �10.1016/0921-4534(93)90389-8�. �hal-00569528�
Metallurgy, HRTEM, magnetic properties and specific heat of
TI
2Ba
2Cu
10
6+x90K - superconductors obtained by a new process
C. Opagiste, M. Couach and A.F. Khoder
Centre d'Etudes Nucléaires de Grenoble/SPSMS/LCP, BP 85 X, F-38041 Grenoble Cedex, France T. Graf, A. Junod, G. Triscone and J. Muller
Département de Physique de la Matière Condensée, 24 Quai E.-Ansermet, Université de Genève, CH-1211 Genève 4, Switzerland T.K. Jondo, J.-L. Jorda, R. Abraham, M.Th. Cohen-Adad and L.A. Bursill 1 Laboratoire de Physico-chimie Minérale II, Université Claude Bernard Lyon I, F-69622 Villeurbanne Cedex, France O. Leckel and M.G. Blanchin
Laboratoire de Physique des Matériaux, Université Claude Bernard Lyon I, F-69622 Villeurbanne Cedex, France
Abstract:
High-quality T12Ba2CuO 6 + X (2201) compounds were synthesized using a high-pressure route. Starting
from T12Ba205 and CuO, the reactions yielding either the orthorhombic or the tetragonal
(superconducting) phases were carried out under 100 bar of oxygen or argon and helium, respectively. Preferential thallium losses are prevented and high sintering temperatures can be used to obtain pure samples with large 2201 grains. The experiments performed include metallographic examinations, X ray diffraction, microprobe analysis, plasma emission spectroscopy, HRTEM, AC susceptibility, Meissner field cooling, hysteresis loops, normal-state susceptibility and specific heat measurements.
1. Introduction
The physical properties of the high-To cuprates often depend critically on the precise conditions of synthesis. This fact is particularly evident in the case of the T12Ba2CulO6+a (2201) system, since two related but distinct phases are stable: the orthorhombic, metallic but non-superconducting phase and the tetragonal superconducting phase with T c varying from 0 to 90 K according to the degree of oxidation. Oxidation and thallium losses in the course of the reaction process appear as the main parameters to be controlled if one aims at improving the quality as characterized by phase purity, compositional homogeneity and grain size. Due to the volatility of T1203, thallium losses occur during the 2201 compound formation at atmospheric pressure [ 1] and the reaction temperature has to be kept low. A new route of preparation under high pressure, in the 100 bar range, and at high temperature (
850-930 ° C) allows us to easily obtain high-quality polycrystalline samples.
2. Sample preparation
Previous investigations by Jorda et al. [ 1,2 ] have shown that the congruent melting oxide T12Ba205 is a convenient starting material to
produce the 2201 compounds. We used T12Ba205 and CuO (Cerac, 99.9%) powder
either directly (batch B) or after annealing for 3 days at 750°C under 1 bar 02 (batch A). After pressing the stoichiometric mixture under 5 kbar, the pellets were given appropriate heat treatments, i.e.
(1) reaction at 900-930°C under 100 bar of oxygen during 30 min to obtain the orthorhombic, non-superconducting phase. The weight loss is somewhat below 0.8%;
(2) reaction at 850°C under 100 bar or argon or helium during 12 min, followed by regrinding and repeating the procedure twice, to form the tetragonal superconducting 2201 phase. A more
significant weight loss of 1.5% is observed in this case.
3. HRTEM
The following observations were made in order to characterize the defect structures of various preparations and thereby guide improvements in elaboration techniques. More fundamentally, we attempt to understand why T12Ba2CulO6+X may exhibit superconducting
transition temperatures over the range 0-90 K, depending on the sample preparation.
Electron microscopic observations were made using a JEOL-200CX instrument operating at 200 keV. The objective lens pole pieces allowed interpretable atomic resolution of 0.23 nm to be achieved for very thin crystals (say ~< 10nm). A double-tilt goniometer was used, with tilt range limited to + 10 °.
Figures 1 (a) and (b) compare typical HRTEM images of one orthorhombic (12E-7) and one tetragonal (12EA-0) sample. The degree of crystalline order and perfection was quite remarkable, compared with earlier preparations at 1 atm [ 1 ].
Virtually no extended defects such as intergrowths of adjacent phases, dislocations or twin boundaries were found. Small traces of an amorphous or poorly crystalline material were found, only rarely, attached to the surface of the tetragonal phase. Perhaps not surprisingly, there was no gross difference between the structure images of the two phases, since the atomic coordinates and site occupancies are not significantly different. Computer simulations of the HRTEM images were achieved without difficulty using published crystallographic data [ 3 ]. This allowed the CuO2 sheets to be
identified (as indicated by the arrows) in figs. 1 (a) and (b). After careful inspection of the two sets of HRTEM images one may gain the qualitative impression that, if there is any observable difference between the two phases, it concerns only the perfection of individual CuO2 sheets, and the adjacent T1-O layers. Fluctuations of intensity and image detail occur more frequently for the orthorhombic phase (fig. 1 (a)) than for the tetragonal phase (fig. 1 (b)).
One may conclude that the presence of varying densities of small defects in the CuO2 sheets, such as copper and/or oxygen vacancies, or the presence of thallium vacancies or Cu substituted for T1 on the adjacent T1-O layers, would certainly lead to variable To. Further attempts to resolve this issue, by controlling the T1/Cu ratio and the oxygen stoichiometry, are proceeding. HRTEM is expected to play a direct role in this study since it has the capability to reveal local fluctuations in short-range ordering within the CuO2 sheets.
Fig. 1. HRTEM images of orthorhombic (a) and tetragonal (b) T12Ba2CulO6+X. The images are
obtained under conditions where the atomic
columns appear as black dots; the projection of the unit cell (outlined) does not match with the structural model.
4. X-ray, metallographic and microprobe investigations
The crystal structure was studied at ambient temperature by X-ray diffraction using
a Guinier camera with Cu Kα radiation. Silicon was added to the powdered samples as an internal standard (a= 5.4308Å).
The lattice parameters of the T12Ba2CulO6+X
orthorhombic and tetragonal phases were determined from least-squares fits using more than 20 lines (10 ° <40< 160°). The lines were indexed according to the space group I4/mmm for the tetragonal phase [4,5] and Ccc2 (A2aa) for the orthorhombic phase [6]. The X-ray diffraction patterns of a tetragonal (12EA-0) and an orthorhombic (TKO-930) sample are presented in fig. 2. The lattice parameters are listed in table 1.
Fig. 2. Calculated and measured X-ray diffraction patterns for tetragonal (12EA-0) and orthorhombic (TKO-930) samples.
Microstructural investigations were carried out after polishing the samples using diamond paste. The surface was examined in a light microscope and in a scanning electron microscope (SEM, Cambridge Instruments Stereoscan 360). In the latter case, the polished samples were covered with a 6 A thick silver layer. Energy dispersive analysis (EDAX) was performed on the M lines
of thallium, L lines of barium and K lines of copper by means of a Tracor Northern system. These investigations were corrected by a standard. The global stoichiometry of our samples was determined using plasma emission spectroscopy. Figure 3 shows optical micrographs of three tetragonal superconducting samples (TA2-850, TM-850 and THE-850) and one orthorhombic non-superconducting sample (TKO-930). Only 2201 grains can be seen in this figure. In the samples prepared using batch B, we observed in polarised light some yellow traces (< 5% by volume) of starting T12Ba205 impurity phase and very small CuP grains ( < 0.1% by volume). Using batch A, only CuP and Ba2Cu3Ox impurities were detected (both < 0.1% by volume). Figure 4 shows a SEM image of the TM-850 sample. The EDAX analyses, the plasma emission spectroscopy, the HREM investigations and the analysis of the impurity phases indicate in both the tetragonal and orthorhombic samples synthesised at high pressure that:
(1) the global stoichiometry is T1:Ba:Cu = 2:2:1. Consequently, the small mass loss during the synthesis has to be attributed to all metallic elements and also to the oxygen content in the preparation of the tetragonal phase;
(2) we do not find a significant variation of the cation stoichiometry between the 2201 grains; (3) we do not observe cation vacancies in the 2201 structure;
(4) depending on the initial batch, we observed a small difference in the ratio TI/Cu between local and global analyses in our 90 K superconducting samples. This suggests a small homogeneity domain Tl1-xCux ( 0 ≤ x ≤ 0.1 ). The
superconducting properties and the change of structure can be attributed to the oxygen concentration alone. Note that under one atmosphere pressure, the tetragonal superconducting phase can only be obtained with a deficiency of thallium [1, 7, 8].
Fig. 4. SEM image of the TM-850 tetragonal sample.
5. AC susceptibility
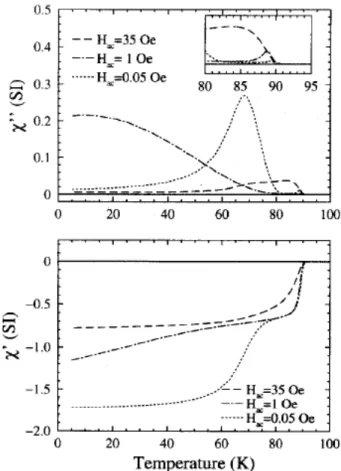
The superconducting transitions were detected by means of a mutual inductance bridge operating between 80 and 800 Hz. The AC field amplitude was set in a first run to a low value of typically 0.05 Per ms. The earth field is compensated by a screen of µ-metal. All curves show a double transition similar to the example shown in fig. 5. The low-temperature value of the susceptibility is equal to -1.72 (sample TH2-850) due to underestimation of the shielded volume. Actually, normalisation to the geometrical volume would give at low temperature a value of the susceptibility near -1.2 which corresponds closely to the expected value in the case of complete shielding with demagnetising effects taken into account. The upper transition at 90 K does not give rise to any appreciable dissipation at low field amplitude. Its shape does not depend on the amplitude or the frequency of the AC field, and its amplitude relative to full shielding is close to the Meissner fraction of the sample determined at a relatively high field strength of 20 Oe (see below). The second step between 60 and 80 K is accompanied by a broad dissipation peak. Its midpoint is shifted by +2.5K when the frequency of the AC field is increased from 80 to 800 Hz. Its shape and position depend strongly on the amplitude of the AC field; the second transition is completely washed out by a field amplitude larger than 20 Oe rms. This behaviour is characteristic of a granular superconductor with very weak intergranular
coupling [9]. The upper step close to 90 K gives the intragrain transition temperature. Between this temperature and approximately 80 K, the sample effectively behaves as a superconducting powder. The lower transition occurs when the critical current of the junctions between the superconducting grains exceeds the order of magnitude H/R, where R is the radius of the sample. The latter ratio amounts to only 0.5 A/cm2
, i.e. orders of magnitude below values typical of YBa2Cu307 close to Tc. Inter-grain
links are therefore particularly weak in the 2201 material, although the reason is unclear. A similar behaviour was observed in the related family of Bi2Sr2CaCu208+x ceramics [10].
On the other hand, an intra-granular dissipation peak grows with the AC field amplitude being increased (see inset of fig. 5). The growth of this dissipation peak is due to the fact that the bulk of the grains is becoming effectively probed as the AC field amplitude is increased and the screening by the surface barriers is no more efficient during the major part of the AC ripple [11].
Fig. 5. AC susceptibility of sample TH2-850 at three levels of excitation: 35, 1 and 0.05 Oe. Upper graph: imaginary part; lower graph: real part.
6. DC field effect: the irreversibility line
Due to their large anisotropy, the Tl-based compounds, as the Bi-Tl-based family, show large domains of reversibility in the (H, T) plane. The determination of the frontier-line or irreversibility line H*(T), although the experimental and theoretical criteria for its definition are still controversial, presents some interest for the classification of these materials as far as critical current promises are concerned. In the case of the present T12Ba2CulO6+X, we
determined the H*(T) by measuring the AC susceptibility under a DC magnetic field. The apparent huge shift of the onset temperature (see fig. 6 -χ ’<0) is due to the fact that in the reversible regime χ’ has a positive weak value which on the scale of the whole transition could not be distinguished from null value. Thus the onset temperature of χ’ < 0 does not correspond to a Tc(H) critical temperature but rather to the departure from reversibility [ 12 ].
The irreversibility line determined by this criterion is shown on fig. 7. Although a H1/3 power law appears to be approximately obeyed, no simple power law can be established as in the case of other high-Tc compounds. This fact may be due to the polycrystalline character of the samples and thus to the angular dependence of H* (T).
Fig. 6. AC susceptibility of sample TH2-850 in different DC magnetic fields.
Fig. 7. Tc(χ’’max) and Tc(χ’onset) vs. H 1/3
.
7. Meissner effect
In these measurements, we use the c.g.s, system where B=H+4πM and χv=M/H=ρχg The
Meissner effect (field cooling) was measured using a RF SQUID magnetometer with an external magnetic field of 20 Oe. The Meissner flux expulsion ratio f = -4πχv was evaluated
using an effective sample volume given by m/ρ, where m is the sample mass and ρ the X-ray density (ρ = 8.0 g/cm3
). A geometric demagnetisation factor D=0.11-0.19, depending on the sample shape, was taken into account. The corrected susceptibility reads χg = χg
m /( 1 -4πDρχg m ), where χg m is the measured
susceptibility. The external magnetic field was calibrated using a high-purity Pb sphere in the superconducting state.
Figure 8 shows the Meissner flux expulsion for four tetragonal samples. The sharpness of the transitions at 90-92 K (onset) denotes the homogeneity of the oxygen concentration. The low-temperature tail follows the behaviour predicted for a granular sample with R/λ(0)~ 30, where R is the radius of the superconducting grains and 2(0) is the penetration depth at T= 0K [ 13 ]. This ratio is consistent with the usual values of λ (0) in high-temperature superconductors and with the average grain size observed in optical micrographs. An analysis of the effective superconducting volume is given elsewhere [ 5 ].
to 6K in the oxidised orthorhombic phase (sample TKO-930, not shown).
Fig. 8. Field cooling susceNibility (Meissner effect) at H= 20 Oe. Ideal diamagnetism corresponds to 4gχg = - 1 in these units. Inset: expanded scale. The low-temperature tail is consistent with a grain size to penetration depth ratio of about 30.
8. Normal-state susceptibility
The normal-state susceptibility was measured using
the same magnetometer with an external magnetic field of 20 kOe. No significant amount of ferromagnetic impurities was detected by means of Honda's method [ 14 ] in batch A used for samples TH2-850, THE-850 and TM-850 (see table 1 ). Figure 9 shows the normal-state susceptibility of three tetragonal samples (TM-850 and TA2-(TM-850 prepared under argon, TH2-850 prepared under helium). The slight Curie-Weiss behaviour of sample TA2-850 is due to the presence of a small amount of BaCuO2
impurity phase. This sample does not contain any residual T12Ba2O5 precursor. On the
contrary, samples TM-850 and TH2-850 contain no BaCuO2, but a small amount of T12Ba2O5,
which was observed at the limit of detection of X-ray and micrographic techniques. The susceptibility of the pure precursor T12Ba2O5 is
also presented in fig. 9. It remains diamagnetic and almost constant from 100 to 400 K.
The presence of this unreacted precursor results in a small downward shift of the total susceptibility with respect to the intrinsic
contribution of the T12Ba2CuO6 phase. We note
that both the susceptibility of sample TA2-850 corrected for the Curie contribution, and the susceptibility of samples TM-850 and TH2-850 corrected for T1EBa2Os, can be brought into coincidence if the concentration of the latter impurity is ~ 5% by volume. The resulting intrinsic susceptibility of T12Ba2CuO6 is shown
as a full line in fig. 9. It is small, diamagnetic, and essentially constant above 150 K.
For a number of oxide superconductors where the transition temperature Tc can be varied appreciably with different hole doping, e.g. La2-xSrxCuO4-y [15-17], YBa2Cu307-d [18,19],
T12Ba2CuO6+x [20], Bi2Sr2CaCu2O8+X [10],
Y2Ba4Cu7015+z [21], an interesting empirical
correlation emerges between Tc and the normal-state magnetic susceptibility. At the hole doping that maximises Tc, the normal-state susceptibility tends to become temperature independent. Above (or below) the optimum, the slope δ χg/δ T is negative (or positive), respectively. The intrinsic normal-state susceptibility of T12Ba2CuO6 above the region
of superconducting fluctuations is remarkably temperature independent (see fig. 9). By analogy with the systems mentioned above, it can be concluded that samples superconducting at 90 K are close to the optimum hole doping. We note, however, that a recent publication reports superconductivity up to 110 K in some T11.85Ba2Cu1.15O6 crystals [22]. This point
deserves further investigation.
The diamagnetic core susceptibility of T12Ba2CuO6 is -2.29x10
-7emu/g if we assume
that the oxidation states of the elements are Tl+3
Ba+2
Cu+
20-2
[23]. This value normalised to one mole is similar to those of the superconducting phases in the YBaCuO system, YBa2Cu307-d, YBa2Cu3.507.5+d and YBa2Cu408
[24]. In contrast to the latter, the 2201 phase of the TIBaCaCuO system has but one copper atom per formula unit to overcome the core diamagnetism by the Pauli and orbital contributions. This fact probably explains why the total magnetic susceptibility is negative. The total susceptibility χo(T=0) extrapolated from a b o v e 1 2 0 K i s – 5 x 1 0-8emu/g, or
-4x10⁻⁵
emu/mole Cu. These values include a correction of 1x10⁻⁸
emu/g or 1x10⁻⁵
emu/mole Cu for the T12Ba205 impurity. Our results are in
fair agreement with those of Allgeier et al. [20]. The sum of the Pauli and van V l e c k contributions amounts to 1.54x10⁻⁴ emu/ mole Cu, to be compared with 1.6x10⁻⁴ / mole Cu for YBa2Cu307 [24].
The rounding χg (T) just above Tc is attributed to superconducting fluctuations. The leading term of the Gaussian fluctuation contribution can generally be written as χfl (T)=-Aτα where
τ = ⏐1-T/Tc⏐. Unexpectedly, the exponent a that best fits the incipient diamagnetism is neither -0.5 nor -1, as would be expected for 3D or 2D fluctuations, respectively, but -2. The meaning of this observation is still unclear.
Fig. 9. Normal-state susceptibility vs. temperature at H= 20 kOe for three tetragonal samples. The lowest curve shows the susceptibility of the precursor T 12Ba205. See
text.
9. Hysteresis measurements and critical currents
Using the SQUID magnetometer, we also measured the magnetic hysteresis at 5 and 77 K (see fig. 10). The measurements of M(H) were taken after zero-field cooling from above To. The complete re-versibility at 77 K, almost 15 K below To, is unusual. In terms of the "irreversibility line" concept, T12Ba2CuO6 is
more closely related to Bi2Sr2CaCu208 than to
YBa2Cu307.
Fig. 10. Magnetization cycles at (a) 5 K and (b) 77 K.
The critical current is evaluated on the basis of Bean's critical model [25,26 ]:
jc ~ - 3 (M+(H) – M-(H))/∅,
where jc is the critical current, M+(H) and M-(H) are the magnetisations measured with increasing and decreasing magnetic field, respectively, and ∅ is the diameter of the cylinder perpendicular to the field (in usual units A/cm2, emu/cm3, and cm): jc ~ -30{M+(H) – M-(H) }/∅).
Using the sample diameter for ∅, we obtain a macroscopic critical current density of about 8x10³ A/cm2 at 1 T and 5 K. Using rather the typical grain size of 5 µ m, consistent with optical micrographs and with the shape of Meissner curves, we obtain jc = l.6x106A/cm2, a value that is more characteristic of intragranular critical current densities. At 77 K and 1 T, the absence of any hysteresis only gives an upper limit of 12 A/cm 2 for the macroscopic critical current density. This rough analysis is only expected to yield relative indications.
10. Specific heat
The calorimeter used for this study is of the adiabatic, continuous heating type; the sample is in vacuo. Years of operation have confirmed an accuracy better than 1% using 0.5g samples, whereas the scatter may be as low as 0.1 to 0.2%. Three samples were selected for the specific heat experiments in the temperature range 30-300 K (table 1). Sample TA2- 850 was synthesised in high-pressure argon, whereas sample THE-850 was synthesised in high-pressure helium. Both have identical TCs close
fig. 8). The specific heat curve of sample 12EA11 prepared in argon (Tc=84.5K, Meissner midpoint), not shown, is similar to that of TA2-850.
A giant peak was observed at 83.74 K for those samples which were prepared under argon (see fig. 11 ), somewhat reminiscent of Butera's unusual results on YBa2Cu307 [27].
Fig. 11. Specific heat C/T vs. temperature for sample TA2-850 prepared under Ar protective atmosphere (upper curve), and sample THE-850 prepared under He (lower curve). Inset: enlargement of the Ar peak at 83.74 K, sample TA2-850, using progressively smaller temperature intervals to determine the "instantaneous" specific heat, from 0.8 K (lowest curve) to 0.4, 0.2, 0.1 and 0.05 K (uppermost curve).
Emphasizing the resolution at the expense of an increased scatter, we find that the width of the peak at half-height is close to 0.1 K, while the amplitude exceeds the baseline specific heat by ~100% (fig. 11, inset). This peak almost coincides with Tc for sample 12EA11, but experiments with the higher-Tc sample TA2-850 on the one hand, and with the argon-free sample THE-850 on the other hand, clearly demonstrate that this anomaly has nothing to do with superconductivity. It is merely due to the melting of minute amounts of argon gas trapped
in pores. Let us recall that the triple point of Ar, a fixed point of the ITS-90 temperature scale [28], is given by T=83.8058K and p=0.68 bar, whereas its critical point lies at 150.9 K and 48 bar. The integrated latent heat indicates that sample TA2-850, weighing 0.61 g, contains 170µg of argon. The evaporation of argon also gives rise to an excess specific heat extending up to 130 K, but decreasing strongly beyond 110K (fig. 11). This reflects a distribution of gas pressures in the pores, with a typical value of 20 bar at room temperature. The closed pores represent then 6% of the sample volume, to be compared with a total porosity of about 30%. The extrapolated pressure in the pores is 70 bar at 850°C. Pores are therefore sealed at high temperatures during the heat treatment rather than during cooling under constant external pressure. This effective sealing may severely limit diffusion in the bulk if one subsequently attempts to oxidise the sample (e.g. to induce a tetragonal to orthorhombic phase conversion). The superconducting transition is not easily distinguished from these extrinsic features in the samples prepared under argon gas. We therefore turn to the sample prepared in helium for a further analysis (fig. 11, lower curve).
Figure 12 shows an enlargement of the transition region. The C/T scale is expanded to show 5% of the total specific heat at To+ 20 K. No mean-field step is observed, but a smeared break in the slope is noticeable. Such a change in the slope cannot be accounted for by any positive phonon distribution. It is clearly due to the condensation of electrons. We attempted to fit the data over a wide region using the following model. The phonon density-of-states is represented by three Einstein peaks located at energies ω0, ω1 and ω2;
their weights are D0, D1, and D2.
The electronic mean-field specific heat is represented by the two-fluid model, with C-mf = 3γT3/TC2 for T<TC and C+mf = γT for T>TC. Anticipating the result, we mention that
this term will be insignificantly small, as expected from the absence of any observable specific heat jump. The choice of the two-fluid model is therefore not critical. The superconducting fluctuations are represented by
a contribution derived from the Lawrence-Doniach model [29], expressing the smooth crossover from 3D Gaussian fluctuations close to T~ to 2D Gaussian fluctuations farther away from TC:
Cfl is the fluctuation specific heat in J/cm3K,
Vc = ξab2.ξc is the coherence volume, ξab and ξc
are the coherence lengths in the (a, b) plane and along the c-axis, respectively; τ = ⏐1-T/Tc⏐ is the reduced temperature, and d is the interlayer distance. The leading power of τ close to Tc is -1/2, and the term containing d/2ξc may be
omitted with practically unchanged results. The parameters ω0, ω1, ω2, D0, D1, D2, γ, Tc and Vc
are refined simultaneously using 700 data between 40 and 230 K. The region 90 to 93 K is omitted. The result for all parameters is stable with respect to the starting point of the least-squares fit program. The residual standard deviation is 0.15%.
Concerning the phonon spectrum, we only mention that the ωs thus found lie within the range of expected phonon frequencies (106, 296 and 670K), and that their total weight comes out as 1.04 times 3N modes per gram-atom, a reasonable result. The fit determines three other parameters: the specific heat jump, 0.4 mJ/(K2mole formula unit), which is
insignificantly small, the critical temperature Tc=91.8K, and an average coherence length (ξab2.ξc)1/3 = 7.5 Å. Using a similar analysis, we found (ξab2.ξc)1/3 = 6 . 4 to 6.5Å both for YBa2Cu307 and Bi2Sr2CaCu2O8 [30]. Figure 12
(inset)shows the total specific heat minus the fitted phonon contribution. The anomaly at Tc never exceeds 0.9% of the total specific heat. Let us mention, however, that the accuracy of such an analysis including the lattice specific heat given by a fitted phonon spectrum could be assessed in the system Bi2Sr2CaCu2O8+y, where
Tc could be alternatively suppressed by a
suitable heat treatment [31].
Fig. 12. Total specific heat C/Tvs. temperature for sample THE-850, expanded scale in the vicinity of Tc = 91.8 K. Inset: electron specific heat (total specific heat minus fitted lattice specific heat) Ce/T in the vicinity of To. The uppermost curve shows 1% of the total specific heat. The curve passing through the data is the fitted function including both 3D/2D Gaussian fluctuations and a small mean-field jump. The latter is negligibly small, as shown separately by the lowest curve.
The most intriguing feature is the absence of any well-developed mean-field specific heat jump at Tc. Smearing by inhomogeneities is not a very satisfactory explanation, since the homogeneity, grain size, Meissner effect, etc. compare favourably with those of YBa2Cu307 samples
which show a clear-cut jump. One may speculate that the electron density-of-states at the Fermi level is extremely small, and/or that the transition at 90K does not result in long-range coherence.
Let us mention here that granularity at the 5 µm scale can hardly explain the loss of the specific heat jump. Generally speaking, granularity may suppress the jump by reducing the effective dimensionality to zero. The relevant parameter characterizing the shift from the mean-field result is the ratio of the average single-electron level spacing to the thermal energy,
density-of-states per unit volume, and Ω is the small particle volume. For δ = 0.1 to l, the specific heat jump at Tc is washed out [32]. Even using the extremely low Sommerfeld constant given by the fit, sizeable effects would require a particle size of 100 Å or less in TI2Ba2CuO6.
11. Conclusion
Starting with the T12Ba205 precursor and
CuO, we have shown that the tetragonal TI2Ba2CuO6+x superconducting phase with
TC=90 K can easily be synthesised using a high
pressure (100 bar) of argon or helium at 850°C. The high pressure effectively prevents the thallium evaporation. The orthorhombic non-superconducting phase is synthesised at 930 °C under 100 bar of oxygen. Synthesised at high pressure, we found that the cation stoichiometry of these two phases is the same. HRTEM investigations indicate no metallic element vacancies, but we do not exclude some homogeneity domain Tll-xCux.
The superconducting transitions of our tetragonal samples are sharp and present a substantial Meissner effect at low temperature (60%). The AC susceptibility at low field shows distinct intra- (90 K) and inter-grain transitions. The latter are due to the bad coupling between the superconducting grains (weaklink structure). At larger excitation field, the second transition disappears. AC susceptibility measurements under a DC magnetic field show a large reversibility domain in the (H, T) plane. Magnetisation measurements at constant temperature (M(H)T) indicate no significant
hysteresis suggesting very low pinning and consequently a low intergrain critical current density. Investigation of the normal state susceptibility shows no intrinsic Curie-Weiss behaviour and a temperature independence in the region where the superconducting fluctuations no longer contribute. By analogy with other high-To systems, this fact suggests that we are at the optimum hole doping for maximum superconducting critical temperature. Although the specific heat measurements show
an anomaly at Tc which can be accounted for in terms of fluctuations with a Lawrence-Doniach coupled layer model, the mean-field specific heat jump which can be deduced from ouranalysis is negligibly small.
Acknowledgements
The authors are grateful to J.A. Fernandez, F. Liniger, F. Monnier, A. Naula and K. Wang for their technical assistance. This work was supported partially by the program EURODOC and the Fonds National Suisse de la Recherche Scientifique.
References
[1] J.-L. Jorda, T.K. Jondo, R. Abraham, M.T. Cohen-Adad, C. Opagiste, M. Couach, A.F. Khoder and F. Sibieude, Physica C205 (1993) 177.
[2] T.K. Jondo, R. Abraham, M.T. Cohen-Adad and J.-L. Jorda, J. Alloys Compounds 186 (1992) 347.
[3] L.A. Bursill, O. Leckel and M.G. Blanchin, J. Alloys Compounds, E-MRS Strasbourg, 1992, to be published.
[4] Y. Shimakawa, Y. Kubo, T. Manako, H. Igarashi, F. Izumi and H. Asano, Phys. Rev. B 42 (1990) 10165.
[5] C. Opagiste, M. Couach, A.F. Khoder, R. Abraham, T.K. Jondo, J.-L. Jorda, M.Th. Cohen-Adad, A. Junod, G. Triscone and J. Muller, J. Alloys Compounds, E-MRS Strasbourg, 1992, to be published.
[6] A.W. Hewat, P. Border, J.J. Capponi, C. Chaillout, J. Chenevas, M. Godinho, E.A. Hewat, J.L. Hodeau and M. Marezio, Physica C 156 ( 1988 ) 369.
[7] J.B. Goodenough and A. Manthiram, J. Solid State Chem. 88 (1990) 115.
[8] A. Manthiram, M. Paranthaman and J.B. Goodenough, Physica C 171 (1990) 135.
[9] K.-H. Miiller, Physica C 159 (1989) 717. [10] G. Triscone, J.-Y. Genoud, T. Graf, A. Junod and J. Muller,Physica C 176 ( 1991 ) 247. [11] A.F. Khoder and M. Couach, in: Magnetic Susceptibility of Superconductors and other Spin Systems (1992).
[12] A.F. Khoder, M. Couach and J.Y. Henry, Europhys. Lett. 15 (1991) 337.
[13] J.R. Clem and G. Kogan, Jpn. J. Appl. Phys. 26-3 (1987) 1161.
[14] K. Honda, Ann. Phys. 32 (1910) 1027. [15] D.C. Johnston, Phys. Rev. Lett. 62 (1989) 957.
[16] D.C. Johnston, J. Magn. Magn. Mater. 100 (1991) 218.
[17] J.B. Torrance, A. Bezinge, A.I. Nazzal, T.C. Huang, S.S.P. Park.in, D.T. Keane, S.J. La Placa, P.M. Horn and G.A. Held, Phys. Rev. B 40 (1989) 8872.
[18] T. Kawagoe, T. Mizoguchi, K. Kanoda, T. Takahashi, M. Hasumi and S. Kagoshima, J. Phys. Soc. Jpn. 57 (1988) 2272.
[19] G. Triscone, J.-Y. Genoud, T. Graf, A. Junod, J. Muller, J. Alloys Compounds, E-MRS Strasbourg, 1992, to be published.
[20] C. Allgeier and J.S. Schilling, Physica C 168 (1990) 499.
[21] G. Triscone, J.-Y. Genoud, T. Graf, A. Junod and J. Muller,
Physica C 201 (1992) 1.
[22] N.N. Kolesnikov et al., Physica C 195 ( 1992 ) 219.
[23] Konig's tables, Landolt-B~rnstein, New Series, Vol. 1I/2, 16 (Springer, Berlin/New York, 1966 ).
[24] J.-Y. Genoud, T. Graf, A. Junod, G. Triscone and J. Muller, Physiea C 185-189 (1991) 597.
[25] C.P. Bean, Rev. Mod. Phys. 36 (1964) 31. [26] W.A. Fietz and W.W. Webb, Phys. Rev. 178 (1969) 657.
[27] R.A. Butera, Phys. Rev. B 37 (1988) 5909. [28] H. Preston-Thomas, Metrologia 27 (1990) 3.
[29] L.N. Bulaevskii, V.L. Ginzburg and A.A. Sobyanin, Physica C 152 (1988) 378; ibid., 156 (1988) 652.
[30] A. Junod, to be published. [31] A. Junod, to be published.
[32] B. Miihlschlegel, D.J. Scalapino and R. Denton, Phys. Rev. B6 (1972) 1767.