HAL Id: inserm-00468713
https://www.hal.inserm.fr/inserm-00468713
Submitted on 31 Mar 2010HAL is a multi-disciplinary open access archive for the deposit and dissemination of sci-entific research documents, whether they are pub-lished or not. The documents may come from teaching and research institutions in France or abroad, or from public or private research centers.
L’archive ouverte pluridisciplinaire HAL, est destinée au dépôt et à la diffusion de documents scientifiques de niveau recherche, publiés ou non, émanant des établissements d’enseignement et de recherche français ou étrangers, des laboratoires publics ou privés.
Educational disparities in mortality among adults with
diabetes in the U.S.
Rosemary Dray-Spira, Tiffany Gary-Webb, Frederick Brancati
To cite this version:
Rosemary Dray-Spira, Tiffany Gary-Webb, Frederick Brancati. Educational disparities in mortality among adults with diabetes in the U.S.: Education and Mortality in US Diabetic Adults. Diabetes Care, American Diabetes Association, 2010, 33 (6), pp.1200-5. �10.2337/dc09-2094�. �inserm-00468713�
Educational Disparities in Mortality among Adults with Diabetes in the US
Running title: Education and Mortality in US Diabetic Adults
Rosemary Dray-Spira, MD, PhD 1,2,3
Tiffany L. Gary-Webb, PhD, MHS 1
Frederick L. Brancati, MD, MHS 1,4
1
Department of Epidemiology, Johns Hopkins Bloomberg School of Public Health, Baltimore, MD, USA
2
INSERM, UMRS 1018, CESP, Epidemiology of Occupational and Social Determinants of Health, F-94807, Villejuif, France
3
University of Versailles Saint-Quentin, UMRS 1018, F-94807, Villejuif, France
4
Department of Medicine, Johns Hopkins University School of Medicine, Baltimore, MD, USA
Correspondence and reprint requests: Rosemary Dray-Spira
INSERM U1018-CESP, Equipe Determinants Professionnels et Sociaux de la Sante Hôpital Paul Brousse, 16 Av. Paul Vaillant-Couturier
94807 Villejuif Cedex France
Tel: +33 (0)1 77 74 74 39 / Fax: +33 (0)1 77 74 74 03 E-mail: Rosemary.Dray-Spira@inserm.fr
Abstract: 240 words
Text: 2753 words, 2 Tables and 2 Figures 21 References
Abstract
Objective: To measure relative and absolute educational disparities in mortality among US adults with diabetes and to compare their magnitude to disparities observed within the non-diabetic population.
Research Design and Methods: 85 867 individuals (5007 with diabetes) aged 35-84 years who participated in the National Health Interview Survey from 1986 to 1996 were followed for mortality through December 31, 2002. Relative and absolute educational disparities in all-cause, CVD and non-CVD mortality were measured.
Results: In relative terms, the risk of all-cause mortality was 28% higher in diabetic adults with the lowest versus the highest position on the educational scale (Relative Index of Inequality, RII 1.28 [1.08-1.53]). This inverse relationship reflected marked disparities in CVD mortality and was found in all age, gender and race/ethnicity groups except Hispanics. Although substantial, this relative educational gradient in mortality among adults with diabetes was smaller than in the non-diabetic population. In absolute terms, diabetic adults with the lowest position on the educational scale suffered 503 excess deaths per 10 000 person-years of follow-up as compared to those with the highest position. These absolute disparities were stronger than in the non-diabetic population. The results were even more striking for CVD mortality.
Conclusions: The risk of mortality differs substantially according to educational level among persons with diabetes in the US. Although relative educational disparities in mortality are weaker in adults with versus without diabetes, their absolute impact is greater and translates into a major mortality burden.
In the US, over 20 million adults have diabetes mellitus and the prevalence is expected to rise substantially in the coming decades (1, 2). Diabetic complications impose an enormous burden on public health, and persons with diabetes have an age-adjusted mortality rate approximately twice as high as those without (3).
The public health burden of diabetes is unevenly distributed across socioeconomic strata. First, diabetes is more common in ethnic minorities and persons of low education and income level (4, 5). Second, in people with diabetes, socioeconomic position (SEP) may influence major determinants of health such as access to care, quality of care, and health behaviors (6).
Correspondingly, SEP may have a profound impact on the morbidity and mortality associated with diabetes. In Europe, socioeconomic health disparities have been reported among persons with diabetes in various settings (5, 6); though, two large record linkage studies (7, 8) found that the magnitude of socioeconomic differentials in survival was weaker in persons with diabetes than in the general population, a result that has remained largely unexplained. In the US, only few studies have focused on SEP-related disparities among persons with diabetes, and then only in selected subpopulations (9-12), making it difficult to determine the impact of such disparities at the population level and their public health importance.
To fully monitor health disparities, the general consensus is that both relative and
absolute measures are required (13, 14). The objective of this study was to quantify relative and absolute educational disparities in mortality within the US diabetic population according to cause of death and across age, gender and race/ethnicity strata; and to compare the magnitude of these disparities to those found in the non-diabetic population.
Research Design and Methods
Study design and population
We used data collected in the National Health Interview Survey (NHIS) from 1986 to 1996 and linked to the National Death Index (NDI) for mortality through December 31, 2002. The NHIS is a continuous, annual, household survey conducted by the National Center for Health Statistics. The survey uses a stratified cluster probability sampling design to collect information from a representative sample of the civilian, noninstitutionalized US population. A complete description of NHIS procedures is available elsewhere (15). The NHIS sample is divided into six representative subsamples. Each subsample is administered one of six checklists of chronic conditions and respondents are asked to indicate the presence or absence of each condition specified on the particular list assigned to them. The present analyses were restricted to the subsample asked about the presence of diabetes. The NHIS and NDI are linked using a probabilistic matching algorithm to determine the vital status of all NHIS participants aged 18 years or older. It is estimated that the matching methods correctly identify over 99% of all living NHIS respondents and 96% of those who died, with no substantial difference according to age, gender, race/ethnicity or socioeconomic status (16).
Variables of interest
For each participant who died by December 31, 2002, available data included information on the quarter and year of death and on the underlying causes of death classified according to the International Classification of Diseases, Tenth revision. Cardiovascular disease (CVD) causes of death were those coded as I00 to I78.
Educational attainment was used as the main indicator of SEP because unlike income and occupation, education is unlikely to be affected by poor health in adulthood. Detailed
information on the highest level of school completed was collected and the variable was categorized as: “Less than high school (HS) degree” (HS not completed); “HS degree” (HS diploma or general equivalency diploma); and “More than HS degree” (some college, vocational or technical school, associate’s degree bachelor’s, master’s, or professional degree).
Race/ethnicity was self-reported.
Participants with diabetes were those who reported themselves or whose proxy reported they had diabetes in the past 12 months.
Statistical Analysis
Analyses were restricted to participants aged 35-84 years. Participants were considered at risk for death during the period between the time of NHIS interview and either the quarter of
their death, the quarter of their 85th birthday or the fourth quarter of 2002, whichever occurred
first.
Direct standardization was used to estimate age- and sex-standardized mortality rates overall and according to educational level among persons with and without diabetes, using the whole population (regardless of diabetes) as the standard.
Educational disparities in mortality were measured using multivariate Cox regression models controlling for time-updated age, sex, race/ethnicity and survey year. Terms of interaction between education and diabetes status were included in the models to measure differences in the magnitude of educational disparities between persons with and without diabetes.
Two indicators were used to estimate relative educational disparities in mortality. First, hazard ratios (HR) associated with educational level were computed, using the highest level of education as reference. Whereas HR are easy to interpret, comparisons of HR across various groups of the population are complicated by different distributions of educational level across these subgroups. Indeed, the advantages conferred by, e.g., holding a high school degree probably differ across age, gender or race/ethnicity strata. The use of the Relative Index of Inequality (RII) as a measure of educational inequalities overcomes this problem by providing a continuous measure of inequalities that accounts simultaneously for the size and relative position of educational groups (13). It does so by using a specific measure of individuals’ relative
educational position, i.e. the mean proportion of the overall population that has an educational level higher than his/her own. For example, each individual in the lowest educational group is assigned a value corresponding to the proportion of the population with middle or high
education, plus half of the proportion of the population with low education. This is therefore a continuous measure, taking the value 0 for someone at the top of the educational scale and 1 for a person at the bottom.
The RII, obtained by regressing mortality on this new indicator, is the predicted ratio of mortality rates at the two extremes of the educational scale. We calculated the RII overall (using individuals educational position relative to the whole population as indicator of education) and separately across age, gender and race/ethnicity strata (using individuals educational position relative to the population within their strata as indicator of education).
Absolute educational disparities in mortality were estimated by the Slope Index of Inequality (SII), corresponding to the slope coefficient obtained by regressing mortality on the indicator of relative educational position defined above. The SII is the predicted difference in
mortality rates between the two extremes of the educational scale. Confidence intervals of RII and SII were estimated using a bootstrap procedure.
We accounted for the complex sampling design and data weighting of NHIS in
estimating standardized mortality rates, but not in estimating associations between education and
mortality. All statistical analyses were performed using Stata/SE 10.0® (Stata Corporation,
College Station, TX).
Results
Characteristics of the study population
We identified 86,817 adults aged 35 to 84 years at the time of NHIS interview, who had been asked about the presence of diabetes and for whom NDI-linked data were available. Of these, we excluded 863 with missing data on educational attainment and 87 who died within the quarter following interview, yielding a final sample of 85,867 individuals. The median follow up time was 10.5 years (range: 1 quarter to 16.8 years). At baseline, 5,007 (5.6%) participants reported having diabetes; they accounted for 43,295 person-years of follow-up. The 80,860 non-diabetic participants accounted for 851,223 person-years of follow-up.
Regardless of diabetes status, participants who did not complete high school (HS) and HS graduates were older and more likely to be women than those with more than a HS degree. Participants with less than a HS degree were also more likely to be non-Hispanic Blacks or Hispanics (Table 1).
Mortality
Of the 15,351 participants who died, 2188 (14.0%) had diabetes at baseline. CVD accounted for 46.6% of the causes of death among participants with diabetes versus 40.2% among those without. Major non-CVD causes of death were cancers (17.6% of deaths), diabetes (14.7%) and respiratory conditions (5.9%) among participants with diabetes, and cancers
(29.7%) and respiratory conditions (10.1%) among those without.
All-cause, CVD and non-CVD mortality rates were 340.0, 150.7 and 189.3 per 10,000 years, respectively, in adults with diabetes versus 136.9, 52.1 and 84.8 per 10,000 person-years, respectively, in those without. As shown in Figure 1, all-cause, CVD and non-CVD mortality rates were inversely associated with educational level both in adults with and without diabetes.
Relative educational disparities in mortality
As shown in Table 2, the inverse relationship between education and mortality risk was statistically significant among adults with diabetes even after accounting for age, sex,
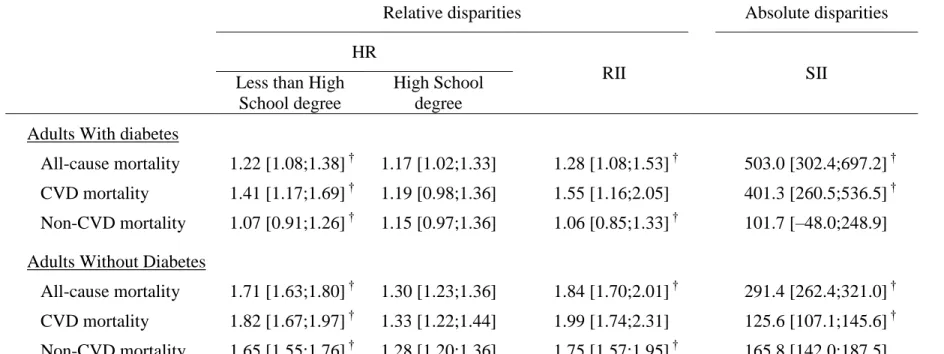
race/ethnicity and survey year. Overall, the risk of all-cause mortality was 28% higher in diabetic adults with the lowest vs. the highest position on the educational scale, as measured by the RII. This inverse relationship between education and mortality risk in adults with diabetes reflected marked educational differences in the risk of CVD mortality. Conversely, the risk of non-CVD mortality did not differ significantly across education strata in adults with diabetes.
Evidence for the existence of an inverse educational gradient in all-cause and CVD mortality risk was found both in diabetic adults aged 35-64 years and in their older counterparts, in diabetic men and women, and in white and black diabetic adults (Figure 2). However, such a
The magnitude of educational disparities in all-cause, CVD and non CVD mortality was significantly lower in adults with diabetes as compared to their non-diabetic counterparts (Table 2).
Absolute educational disparities in mortality
As shown in Table 2, the difference in the estimated risk of all-cause mortality between diabetic adults with the lowest versus the highest position on the educational scale, as measured by the SII, was 503.0 deaths per 10,000 person-years. This difference was largely driven by educational disparities in CVD mortality, accounting for 401 excess deaths per 10,000 person-years of follow-up. These absolute educational disparities in all-cause and CVD mortality were greater in adults with diabetes than in their non-diabetic counterparts. In contrast, absolute educational disparities in non-CVD mortality did not differ in magnitude according to diabetes status.
Conclusions
Our results suggest that differences in educational position produce substantial disparities in mortality risk in US adults with diagnosed diabetes regardless of age, gender and
race/ethnicity. In relative terms, these disparities are weaker than in non-diabetic adults. However, in absolute terms, adults with diabetes suffer the greatest mortality burden from low educational position, with a difference of over 500 deaths per 10,000 person-years of follow-up between the two extremes of the educational scale. These disparities are mainly driven by CVD mortality, a cause of death for which many effective preventive measures are available.
Strengths of this study which lend weight to these conclusions include a nationally representative cohort large enough to afford multiple stratified multivariate analyses and long-term follow-up that is nearly 100% complete.
The main limitation of our study is reliance on self-report of diabetes. The accuracy of diabetes self-report has been reported to be high overall, though to improve with educational level (17). Moreover, approximately one third of US adults with diabetes are estimated to be undiagnosed (18), a rate possibly higher among persons with low education (19). This suggests that self-reported cases of diabetes may under-represent the milder cases, i.e. those either undiagnosed or diagnosed but under-reported, especially among persons with a low education. Consequently, educational health disparities measured within adults with diagnosed diabetes may be more marked than those occurring in the whole population of persons with diabetes.
Additionally, although educational health disparities may differ according to diabetes type (7), NHIS does not attempt to distinguish between type 1 and type 2 diabetes. However, since type 2 diabetes accounts for the large majority (90-95%) of cases in the US, our results mostly pertain to type 2 diabetes (1).
Mortality rates provided in the study were estimated accounting for sampling weights, thus they are representative of the US population. However, we could not account for data weighting in estimating associations between education and mortality because we were unable to calculate correct sampling weight for bootstrap analyses and thus to provide an accurate estimate of RII and SII variances. Complementary analyses show that regardless of diabetes status, point estimates of HR and RII do no substantially differ whether calculations are based on weighted or unweighted data. Though, SII estimate in adults with diabetes appears greater using weighted rather than unweighted data (600.3 vs. 503.0 deaths per 10,000 person-years for all-cause
mortality), suggesting that absolute educational disparities in mortality among US adults with diabetes may be underestimated in our study.
By showing that the risk of mortality differs according to educational attainment, both in relative and in absolute terms, our results provide strong evidence for the existence of
educational disparities in mortality in US adults with diagnosed diabetes. Thereby, the present study suggests that socioeconomic disparities in health previously reported among persons with diabetes in Europe (5, 6) occur in the US context as well. Underlying pathways may involve a large range of factors including patient factors (e.g., health behaviors, material conditions or psychosocial factors) as well as characteristics of the providers, the community and the health care system (6). Given the major burden of diabetes in the US across the various socioeconomic strata of the population, such disparities may have a major public health impact at the national level.
In relative terms, our findings indicate that educational disparities in mortality among US adults with diabetes are mainly driven by differences in the risk of death from CVD causes. Including deaths with diabetes as underlying cause in the definition of CVD deaths did not change this finding (data available on request). In addition, such disparities among adults with diabetes are substantial in all age, gender and race/ethnicity strata except Hispanic adults. The absence of educational health disparities among Hispanics has been reported among the general population as well (20), suggesting that its underlying mechanisms are likely to be independent of diabetes status.
Although they are substantial, educational disparities in mortality in adults with diabetes appear to be smaller as compared to disparities in non-diabetic adults. Such difference has also been reported in Italy (7) and in Finland (8), two countries with equitable access to health
services. One possible explanation is that diabetes management levels off disparities in health care and health behaviors across the various educational groups. Our findings suggest that such a salutary role of diabetes management may occur as well in the context of the US health care system - a hypothesis supported by a recent study showing that, concurrently with major improvement in diabetes management over the past decade, there has been limited widening of educational health disparities in the US diabetic population (21). Whether this arises from the specificities of diabetes management itself or from its beneficial consequences in terms of enhancing health care access and use deserves further studies.
We found that in diabetic adults absolute disparities in mortality are strong --specifically from CVD-related causes-- and, in contrast to relative disparities, greater than in the non-diabetic population. Indeed, we found that diabetic adults who hold the lowest position on the
educational scale suffer 503 excess deaths per 10,000 person-years of follow-up as compared to those with the highest position, a gap 73% higher than in the non-diabetic population. The results were even more striking for CVD mortality, with a gap 319% higher in the diabetic versus the non-diabetic population. The contrasted results we obtained using either relative or absolute measures of disparities stem from the fact that the burden of CVD mortality is dramatically higher in adults with versus without diabetes. This finding highlights the relevance of using both relative and absolute measures of inequalities in order to adequately assess health disparities, and suggests that educational health disparities among adults with diabetes have a major public health impact.
In summary, we have shown that the risk of mortality differs substantially according to educational level among persons with diabetes in the US. Although relative educational
disparities in mortality are less marked in adults with diabetes than in those without, their absolute impact is greater and translates into a major mortality burden. Considering the major burden of diabetes in the US, especially among the most deprived categories of the population, this suggests that reducing social health inequalities among persons with diabetes is likely to have a major public health impact. Future research should determine pathways underlying these educational disparities with an eye towards developing strategies to eliminate them.
Acknowledgments
All data used in this study were collected by the National Center for Health Statistics (NCHS), Centers for Disease Control and Prevention.
Dr. Brancati is supported by the NIDDK Diabetes Research and Training Center (P60 DK079637).
References
1. Engelgau MM, Geiss LS, Saaddine JB, Boyle JP, Benjamin SM, Gregg EW, Tierney EF, Rios-Burrows N, Mokdad AH, Ford ES, Imperatore G, Narayan KM. The evolving diabetes burden in the United States. Ann Intern Med 2004;140(11):945-50.
2. Wild S, Roglic G, Green A, Sicree R, King H. Global prevalence of diabetes: estimates for the year 2000 and projections for 2030. Diabetes Care 2004;27(5):1047-53.
3. International Diabetes Federation. Diabetes Atlas. 3nd ed; 2006.
4. Cowie C, Eberhardt M. Sociodemographic characteristics of persons with diabetes. In: Harris M, Cowie C, Stern M, et al, editors. Diabetes in America. 2nd ed. Bethesda, MD: National Institute of Health; 1995. p. 85-116.
5. Espelt A, Borrell C, Roskam AJ, Rodriguez-Sanz M, Stirbu I, Dalmau-Bueno A, Regidor E, Bopp M, Martikainen P, Leinsalu M, Artnik B, Rychtarikova J, Kalediene R, Dzurova D, Mackenbach J, Kunst AE. Socioeconomic inequalities in diabetes mellitus across Europe at the beginning of the 21st century. Diabetologia 2008;51(11):1971-9.
6. Brown AF, Ettner SL, Piette J, Weinberger M, Gregg E, Shapiro MF, Karter AJ, Safford M, Waitzfelder B, Prata PA, Beckles GL. Socioeconomic position and health among persons with diabetes mellitus: a conceptual framework and review of the literature. Epidemiol Rev 2004;26:63-77.
7. Gnavi R, Petrelli A, Demaria M, Spadea T, Carta Q, Costa G. Mortality and educational level among diabetic and non-diabetic population in the Turin Longitudinal Study: a 9-year
follow-up. Int J Epidemiol 2004;33(4):864-71.
8. Koskinen SV, Martelin TP, Valkonen T. Socioeconomic differences in mortality among diabetic people in Finland: five year follow up. BMJ 1996;313(7063):975-978.
9. Haffner SM, Hazuda HP, Stern MP, Patterson JK, Van Heuven WA, Fong D. Effects of socioeconomic status on hyperglycemia and retinopathy levels in Mexican Americans with NIDDM. Diabetes Care 1989;12(2):128-34.
10. West SK, Munoz B, Klein R, Broman AT, Sanchez R, Rodriguez J, Snyder R. Risk factors for Type II diabetes and diabetic retinopathy in a mexican-american population: Proyecto VER. Am J Ophthalmol 2002;134(3):390-8.
11. Chin MH, Zhang JX, Merrell K. Diabetes in the African-American Medicare population. Morbidity, quality of care, and resource utilization. Diabetes Care 1998;21(7):1090-5. 12. McEwen LN, Kim C, Karter AJ, Haan MN, Ghosh D, Lantz PM, Mangione CM, Thompson
TJ, Herman WH. Risk Factors for Mortality Among Patients With Diabetes: The Translating Research Into Action for Diabetes (TRIAD) Study. Diabetes Care 2007;30(7):1736-41. 13. Mackenbach JP, Kunst AE. Measuring the magnitude of socio-economic inequalities in
health: an overview of available measures illustrated with two examples from Europe. Soc Sci Med 1997;44(6):757-71.
14. Keppel K, Pamuk E, Lynch J, Carter-Pokras O, Kim I, Mays V, Pearcy J, Schoenbach V, Weissman JS. Methodological issues in measuring health disparities. National Center for Health Statistics. Vital Health Stat 2005;2(141).
15. National Center for Health Statistics, Centers for Disease Control and Prevention. National
Health Interview Survey. Available at: http://www.cdc.gov/nchs/nhis.htm.
16. National Center for Health Statistics. The 1986-2000 National Health Interview Survey Linked Mortality Files: Matching Methodology. Hyattsville, MD; 2005.
17. Okura Y, Urban LH, Mahoney DW, Jacobsen SJ, Rodeheffer RJ. Agreement between self-report questionnaires and medical record data was substantial for diabetes, hypertension,
myocardial infarction and stroke but not for heart failure. J Clin Epidemiol 2004;57(10):1096-103.
18. Cowie CC, Rust KF, Byrd-Holt DD, Eberhardt MS, Flegal KM, Engelgau MM, Saydah SH, Williams DE, Geiss LS, Gregg EW. Prevalence of diabetes and impaired fasting glucose in adults in the U.S. population: National Health And Nutrition Examination Survey 1999-2002. Diabetes Care 2006;29(6):1263-8.
19. Smith JP. Economics of Health and Mortality Special Feature: Nature and causes of trends in male diabetes prevalence, undiagnosed diabetes, and the socioeconomic status health
gradient. Proc Natl Acad Sci U S A 2007;104(33):13225-31.
20. Goldman N, Kimbro RT, Turra CM, Pebley AR. Socioeconomic gradients in health for white and Mexican-origin populations. Am J Public Health 2006;96(12):2186-93.
21. Dray-Spira R, Gary TL, Brancati FL. Socioeconomic position and cardiovascular disease in adults with and without diabetes mellitus: United States trends, 1997-2005. J Gen Intern Med 2008;23(10):1634-41.
Table 1. Characteristics of the 85,867 participants with and without diabetes, according to educational level (numbers are weighted % unless stated otherwise)
ADULTS WITH DIABETES (N=5,007)
ADULTS WITHOUT DIABETES (N=80,860) Less than High School Degree (N=2,179) High School Degree (N=1,699) More than High School Degree (N=1,129) Less than High School Degree (N=18,969) High School Degree (N=30,013) More than High School Degree (N=31,878) Age at the time of interview (years)
Mean (standard error) 64.8 (0.27) 61.3 (0.34) 58.5 (0.40) 59.8 (0.14) 53.0 (0.12) 49.9 (0.11)
35-64 48.4 56.2 65.8 59.6 78.6 85.4 65 and up 51.6 43.8 34.2 40.4 21.4 14.6 Gender Men 41.6 44.8 57.1 47.5 42.2 51.7 Women 58.4 55.2 42.9 52.5 57.8 48.3 Race/ethnicity Non-Hispanic Whites 61.6 80.5 77.0 69.8 84.2 85.0 Non-Hispanic Blacks 22.9 12.6 13.6 14.5 8.7 6.8 Hispanics 12.7 4.4 5.2 12.7 4.7 4.2 Other Non-Hispanics 2.8 2.5 4.2 3.0 2.4 4.0
Table 2. Relative and absolute educational disparities* in all-cause, CVD and non-CVD mortality among adults with and without diabetes
Relative disparities Absolute disparities
HR
RII SII
Less than High School degree
High School degree Adults With diabetes
All-cause mortality 1.22 [1.08;1.38] † 1.17 [1.02;1.33] 1.28 [1.08;1.53] † 503.0 [302.4;697.2] †
CVD mortality 1.41 [1.17;1.69] † 1.19 [0.98;1.36] 1.55 [1.16;2.05] 401.3 [260.5;536.5] †
Non-CVD mortality 1.07 [0.91;1.26] † 1.15 [0.97;1.36] 1.06 [0.85;1.33] † 101.7 [–48.0;248.9]
Adults Without Diabetes
All-cause mortality 1.71 [1.63;1.80] † 1.30 [1.23;1.36] 1.84 [1.70;2.01] † 291.4 [262.4;321.0] †
CVD mortality 1.82 [1.67;1.97] † 1.33 [1.22;1.44] 1.99 [1.74;2.31] 125.6 [107.1;145.6] †
Non-CVD mortality 1.65 [1.55;1.76] † 1.28 [1.20;1.36] 1.75 [1.57;1.95] † 165.8 [142.0;187.5]
HR: Hazard Ratio of death (Reference category: individuals with more than a high school degree)
RII: Relative Index of Inequality (ratio of mortality rates of individuals with the highest and lowest educational level in the population)
SII: Slope Index of Inequality per 10,000 person-years (difference between mortality rates of individuals with the highest and lowest educational level in the population)
* All measures are adjusted for age, sex, race/ethnicity and survey year
†
Figure 1. Age and sex-standardized all-cause, CVD and non-CVD mortality rates (and 95% confidence intervals) according to educational level among adults with and without diabetes
Figure 2. Relative Index of Inequality* (and 95% confidence intervals) in all-cause, CVD and non-CVD mortality among adults with diabetes by age (A), gender (B) and race/ethnicity (C)
Figure 2 captions
Adults With Diabetes 0 100 200 300 400
All-Cause mortality CVD mortality Non-CVD mortality
M o rt a li ty R a te p e r 1 0 0 0 0 p e rs o n -y e a rs
Less than High School degree High School degree More than High School degree Adults Without Diabetes
0 100 200 300 400
All-Cause mortality CVD mortality Non-CVD mortality
M o rt a li ty R a te p e r 1 0 0 0 0 p e rs o n -y e a rs
0 0,5 1 1,5 2 2,5 3 3,5 4 4,5 5 5,5 R e la ti v e I n d e x o f In e q u a li ty Men Women B
All-cause mortality CVD mortality Non-CVD mortality 0 0,5 1 1,5 2 2,5 3 3,5 4 4,5 5 5,5 R e la ti v e I n d e x o f In e q u a li ty 35-64 years 65 years and up A
All-cause mortality CVD mortality Non-CVD mortality
0 0,5 1 1,5 2 2,5 3 3,5 4 4,5 5 5,5 R e la ti v e I n d e x o f In e q u a li ty Non-Hispanic Whites Non-Hispanic Blacks Hispanics C